

Abstract
PURPOSE
To identify visually significant spectral-domain optical coherence tomography (SD-OCT) features of epiretinal membranes (ERM) in patients with uveitis.
DESIGN
Retrospective cohort and cross-sectional study.
METHODS
Eighty consecutive eyes with uveitis and SD-OCT– documented ERM were included. Clinical data were collected at the time of diagnosis of ERM and at the final visit. SD-OCT images at the last visit were evaluated to identify fovea and ERM configuration and structural changes. Changes of 10% and 20% in central subfield thickness between initial and last SD-OCT were calculated and correlated with visual acuity (VA). An ERM thickness map was created using validated SD-OCT grading software.
RESULTS
VA improved significantly in eyes with more than 12 months of follow-up (P = .03). Although inflammation activity and medical treatment methods were no different in eyes with more or less than 12 months of follow-up, 16 eyes in the subset with longer follow-up underwent cataract extraction and intraocular lens implantation. Kaplan-Meier analysis demonstrated few vision losses during the follow-up period. Change in central subfield thickness did not correlate with VA. Foveal center involvement (P < .001), focal attachment of the ERM (P = .003), and foveal inner segment and outer segment junction disruption (P = .006) were associated independently with lower VA. ERM was thinner in eyes with 20/40 or better VA (4.6 ± 0.6 μm) compared with eyes with VA of less than 20/200 (P =.02). Longer duration of ERM was associated with thicker ERM (P < .05).
CONCLUSIONS
In most eyes with uveitis and ERM, VA remains stable if ocular inflammation and comorbidities are addressed appropriately.
Epiretinal membranes (erm) develop frequently in patients with uveitis1 and contribute to visual morbidity, including visual impairment, metamorphopsia, micropsia, and occasional monocular diplopia.2,3 Although ERMs may be detected by funduscopy, detection sensitivity has been increased by the use of optical coherence tomography (OCT).4 Among various OCT technologies, spectral-domain (SD) OCT allows better visualization and improved understanding of the pathologic features of ERM and the underlying retinal changes.5 Furthermore, the axial resolution of SD-OCT (generally in the 5- to 7-μm range for the most common SD-OCT instruments) is especially promising for performing a detailed evaluation of the outer retina and for facilitating correlation with visual prognosis.6,7 Although morphologic SD-OCT parameters have been correlated with visual prognosis in patients involved with idiopathic ERM,3,5–9 such observations have not extended to uveitic ERMs. Defining such clinically relevant, visually significant characteristics of the uveitic ERMs would help in tailoring proper follow-up and management of this complication.
Retinal thickness maps provided by built-in OCT programs have become significant diagnostic and outcome parameters in management of macular pathologic features,10,11 but such an approach does not necessarily provide specific and relevant outcome parameters in patients with ERM. Furthermore, error frequency of automated detection and segmentation of the retinal boundaries in the presence of ERM is high with built-in SD-OCT programs.12 This limits the reproducibility of thickness maps and the quantitative measures of the morphologic features of ERM, which may be of value in assessing patients’ visual performance and prognosis. However, Sadda and associates and Joeres and associates reported a novel OCT reading and grading approach entitled 3D-OCTOR that allows trained users to address automated segmentation errors by manual correction and segmentation of predetermined retinal, epiretinal, and subretinal layer boundaries, followed by automated calculation of relevant thickness and volume statistics.13–15 In the present study, potentially visually significant features of uveitic ERM and the underlying neurosensory retina were assessed qualitatively and quantitatively and were correlated with visual acuity.
METHODS
OCT images of 80 eyes of 54 consecutive uveitic patients with an SD-OCT–supported diagnosis of ERM in a referral uveitis clinic at the Doheny Eye Institute seen between August 2009 and November 2010 were collected and analyzed. The Institutional Review Board of the University of Southern California approved the data collection and analysis protocol. The study was in accordance with Health Insurance Portability and Accountability Act requirements. All cases were documented by either 1 or both of 2 SD-OCT devices, the Cirrus HD-OCT (Carl Zeiss Meditec, Dublin, California, USA) or Spectralis HRA+OCT (Heidelberg Engineering, Heidelberg, Germany).16
Clinical data types were collected from the baseline visit at the time of clinical diagnosis of ERM and from the last visit. The collected information included age, sex, anatomic and clinical diagnosis, duration of the uveitis, and clinical examination findings. Standardization for Uveitis Nomenclature (SUN) Working Group guidelines were used for uveitis anatomic classification and inflammation grading and activity.17 Patients with sclerouveitis were included if they met the inclusion criteria. Patients with poor-quality SD-OCT images that prevented evaluation and quantification of the SD-OCT data were excluded. Management of uveitis was based on therapeutic approaches encompassing specific treatment for the underlying systemic condition combined with topical and systemic corticosteroids. Immunomodulatory agents were added if intraocular inflammation was not controlled by corticosteroids and as corticosteroids-sparing agents. Treatment approaches were aimed at zero intraocular inflammation activity.
• QUALITATIVE ANALYSIS OF THE SPECTRAL-DOMAIN OPTICAL COHERENCE TOMOGRAPHY IMAGES
Gray-scale SD-OCT images of all study eyes at their last visit were viewed on a 22-inch liquid crystal display monitor (1920 × 1080 pixels) for the evaluation of the ERM features. All macular B-scans were evaluated for the pattern (focal or broad) of attachment of ERM to the internal limiting membrane (ILM) of the retina. Patterns of attachment were defined as focal (Figure 1, Top left) and broad (Figure 1, Middle left).5,18,19 If both attachment morphologic features were present to a similar extent in different parts of the macula, the pattern of attachment was recorded as both (Figure 1, Bottom left). The central horizontal B-scan passing through the foveal center and 8 superior and 8 inferior B-scans were evaluated for the presence or absence of specific structural features, including the following: (1) presence (Figure 1, Top left and Middle left) or absence (Figure 1, Top right) of involvement of the foveal center by the ERM; (2) normal foveal concavity (Figure 1, Middle right) versus lost foveal concavity (Figure 1, Top left and Middle left); (3) presence or absence of cystoid macular edema (CME) at the fovea (Figure 1, Middle right and Bottom right); (4) integrity of the inner segment/outer segment (IS/OS) junction (Figure 1, Top left) and minor disruption (less than 200 μm in length; Figure 1, Bottom right) and significant disruption (more than 200 μm in length; Figure 1, Bottom left) of IS/OS junction line; and (5) integrity of the external limiting membrane (ELM) of the retina (Figure 1, Top left) and minor disruption (less than 200 μm in length; Figure 1, Bottom right) and significant disruption (more than 200 μm in length; Figure 1, Bottom left) of the ELM. The size of the disruption of IS/OS junction and the ELM were measured with the automated calipers of the SD-OCT machines’ built-in program.
FIGURE 1.
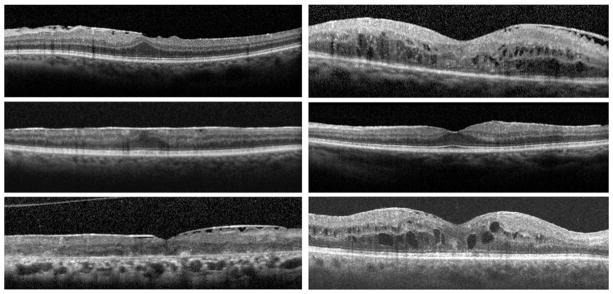
Spectral-domain optical coherence tomography features of epiretinal membrane (ERM) and underlying retina in patients with uveitis. (Top left) The foveal center is involved with the ERM. There is focal attachment of ERM. Foveal concavity is lost. There is no cystoid macular edema (CME). The inner segment and outer segment (IS/OS) junction and the external limiting membrane (ELM) are preserved. (Top right) The fovea is not involved. There is focal attachment of ERM and foveal concavity is preserved. CME is present and there is major disruption of IS/OS junction and ELM. (Middle left) The foveal center is involved with the ERM. There is global flat attachment of the ERM. Foveal concavity is lost. CME is absent and the IS/OS junction and ELM are preserved. (Middle right) The fovea is not involved with ERM and foveal concavity is well preserved. There is a global flat ERM attachment with intact IS/OS junction and ELM. (Bottom left) The fovea is involved with focal ERM attachment. Foveal concavity is preserved. There is small cystic edema and a major disruption of the IS/OS junction and ELM. (Bottom right) The fovea is involved with the focally attached ERM. There is preserved foveal concavity. CME is present and there is a minor disruption of ELM and IS/OS junction.
• CENTRAL SUBFIELD THICKNESS
OCT machines interpret scan data to calculate central subfield thickness (CST), defined as the average retinal thickness in the area enclosed in a 1000 μm diameter circle centered at the center of fovea.11 The CST at first and last SD-OCT examination was recorded for all eyes that were scanned with the same SD-OCT machine in both time points and for which the interval between initial and last SD-OCT was more than 3 months. A 10% and 20% change in CST was calculated for correlation with visual acuity.11
• GENERATION OF EPIRETINAL MEMBRANE THICKNESS MAP
ERM thickness maps were developed in 34 randomly selected eyes at their last examination with SD-OCT. The entire cohort of eyes was not used for ERM thickness map generation because of the exhaustive nature of the manual segmentation process. The Doheny Image Reading Center has developed OCTOR, a software tool that facilitates viewing and manual grading of OCT scans. OCTOR has been described and validated in previous reports.13–15 A new version of OCTOR, called 3D-OC-TOR, is updated for handling large SD-OCT data sets.15 Each macular cube protocol of Cirrus HD-OCT consists of 128 B-scans spaced 47 μm apart within a 6 × 6-mm area centered on the fovea. The Spectralis HRA+OCT imaging protocol used in the Doheny Ophthalmic Imaging Unit consists of 37 horizontal B-scans also within a 6 × 6-mm scanning area. Based on specifications provided by previous studies evaluating the effect of interpolation and required numbers of scans for accurate thickness map generation, 3D-OCTOR was used to draw the inner and outer boundaries of the ERM on every fourth B-scan of Cirrus HD-OCT volume cube15 and all 37 B-scans of Spectralis HRA+OCT cube to compute thickness values at all segmented locations. The measurements at all unsampled locations, between the raster scans, were interpolated based on a linear approximation (using nearest neighbor sampling between A-scans, followed by bilinear sampling between B-scans) to yield a thickness map as previously described. For manual segmentation, the ERM was defined as the first hyperreflective line internal to the ILM. Segmentation was performed by 2 independent graders (H.N., F.M.H.), and discrepancies were resolved by open adjudication to yield a single final segmentation for each case. In eyes with apparent tight adherence of the ERM to the inner retinal surface without areas of clear separation of the ERM, the ILM was included as the outer ERM surface. Macular Early Treatment Diabetic Retinopathy Study (ETDRS) grid subfields were used to facilitate analysis and comparison of the thickness and surface areas of ERM between cases. The central circle with a diameter of 1000 μm centered on foveal center was defined as the foveal area. The middle circle with a diameter of 3000 μm was defined as foveal plus parafoveal area, and the areas encompassed in the larger circle with a diameter of 6000 μm was defined as the entire macular area.
• STATISTICAL ANALYSIS
Visual acuity measurements with Snellen charts were converted to logarithm of minimal angle of resolution units for correlating with other parameters, including ERM duration, uveitis duration, uveitis activity, ERM attachment type to the inner retina, involvement of the fovea by the ERM, presence of CME, outer retinal disturbances in the fovea as revealed and graded with SD-OCT, and central macular thickness. A life table analysis was performed to calculate the cumulative proportion of the eyes with visual acuity dropping to 20/50 and worse and 20/200 and worse.20 The incidence of vision loss to 20/50 and worse and 20/200 and worse also was calculated.20 Additionally, patients were stratified further based on visual acuity cutoffs of 20/40 and 20/200,17 and Wilcoxon signed-rank tests were run to compare baseline and final visual acuity in groups. To correlate clinical features and SD-OCT findings with simultaneous visit visual acuity, generalized estimating equations were performed that adjusted for the correlation between eyes within the subjects. For analysis that included only 1 eye per subject, t-tests were used. ERM thickness, SD-OCT features, and vision were correlated using Spearman and Pearson correlation coefficients. SAS software version 9.1 (SAS Institute, Cary, North Carolina, USA) was used for all analysis. The accepted level of significance was P < .05.
RESULTS
Eighty eyes of 54 consecutive patients with uveitis with an SD-OCT–supported diagnosis of ERM were included. Average patient age ± standard deviation at the time of data collection was 60.5 ± 13.7 years (range, 20 to 87 years); 35 patients (64.8%) were male. In 26 patients, both eyes had documented ERM and were included in the study. Anatomic classification of the uveitis in involved eyes revealed posterior uveitis (35 eyes; 43.7%), anterior uveitis (15 eyes; 18.7%), intermediate uveitis (15 eyes; 18.7%), panuveitis (10 eyes; 12.5%), and sclerouveitis (5 eyes; 6.2%). The most prevalent final diagnosis was idiopathic uveitis (31 eyes; 31.2%), followed by birdshot choroiditis (11 eyes; 13.7%), pars planitis (8 eyes; 10%), sarcoidosis-associated posterior uveitis (8 eyes; 10%), HLA-B27–associated uveitis (7 eyes; 8.7%), and multifocal choroiditis and panuveitis (6 eyes; 7.5%). Less frequent clinical diagnoses included tuberculous uveitis, Vogt-Koyanagi-Harada syndrome, uveitis associated with rheumatologic disorders, Behçet disease, presumed ocular histoplasmosis syndrome, and endophthalmitis occurring after cataract extraction. Median follow-up time after diagnosis of ERM was 24 months (mean ± standard deviation, 32 ± 38.7 months; range, 0 to 228 months). The median logarithm of minimal angle of resolution visual acuity improved slightly from 0.24 (mean ± standard deviation, 0.33 ± 0.32; range, 0 to 1.3) at the time of ERM diagnosis to 0.18 (mean ± standard deviation, 0.27 ± 0.29; range, 0 to 1.3) at the last follow-up (P = .04). When patients were stratified based on duration of follow-up (Table 1), visual acuity improvement in patients with more than 12 months of follow-up was significant (P = .03, Wilcoxon signed-rank test). In contrast, visual acuity did not change significantly in patients with follow-up of 12 months or less. To evaluate the contribution of active intraocular inflammation to visual acuity change over time, the eyes with active inflammation at the baseline or final visits, or both, were excluded, and visual acuity change in the group with more than 12 months of follow-up was still significant (P = .04). Twenty-seven eyes had visual acuity of 20/50 or worse at baseline, and 4 more eyes lost vision to this level during follow-up. Figure 2, Top, reveals a cumulative hazard analysis (Kaplan–Meier curve) for eyes losing vision to 20/50 or less. The incidence of losing vision to 20/50 and worse was 0.03 eyes per each year of follow-up. Eight eyes had 20/200 vision at baseline and 1 eye lost vision to this level during follow-up (Figure 2, Bottom). The incidence of losing vision to 20/200 and worse was 0.005 eyes per each year of follow-up.
TABLE 1.
The Frequency of Eyes with Uveitis and Epiretinal Membrane in Various Visual Acuity Groups at Initial and Final Visit
| BCVA of 20/40 or Better | BCVA between 20/40 and 20/200 | BCVA of 20/200 or Worse | |
|---|---|---|---|
| At time of clinical diagnosis of ERM | 53 (66.25%) | 19 (23.75%) | 8 (10%) |
| 0 to 6 mos of follow-up | 13 (65%) | 6 (30%) | 1 (5%) |
| 7 to 12 mos of follow-up | 3 (60%) | 0 | 2 (40%) |
| >12 mos of follow-up | 37 (67.3%) | 13 (23.6%) | 5 (9.1%) |
| At time of last follow-up | 59 (73.75%) | 15 (18.75%) | 6 (7.5%) |
| 0 to 6 mos of follow-up | 14 (70%) | 5 (25%) | 1 (5%) |
| 7 to 12 mos of follow-up | 3 (60%) | 0 | 2 (40%) |
| >12 mos of follow-up | 42 (76.4%) | 10 (18.2%) | 3 (5.5%) |
BCVA = best-corrected visual acuity; ERM = epiretinal membrane; mos = months. Data are presented as number of eyes (%).
FIGURE 2.

Kaplan-Meier curves for best-corrected visual acuity (BCVA) in eyes with uveitis and spectral-domain optical coherence tomography– documented epiretinal membrane. (Top) Cumulative proportion of eyes with BCVA of 20/50 and worse. (Bottom) Cumulative proportion of eyes with BCVA of 20/200 and worse.
Median duration of uveitis before clinical diagnosis of ERM was 44 moths (mean ± standard deviation, 62 ± 78 months; range, 2 to 351 months). Uveitis duration was less than 6 months in 5 eyes, 7 to 12 months in 10 eyes, and more than 12 months in 65 eyes. Longer duration of uveitis correlated with lower visual acuity (P < .05). Intraocular inflammation was inactive at baseline and at the last visit in 64 eyes (80%). Intraocular inflammation was active in both the initial and last visits in 5 eyes (6.2%). In 6 eyes (7.5%) that had active intraocular inflammation at the time of diagnosis of ERM, inflammation was controlled at the last visit. In contrast, 5 eyes (6.2%) had inactive inflammation at the first visit, but showed active uveitis at the last visit. Inflammation activity did not correlate with initial and final visual acuity or with the change in the vision. The level of inflammation did not correlate with the presence of structural alterations in the fovea, including CME (P = .41).
Treatment methods at the time of the last visit included topical corticosteroids in 36 eyes (45%), systemic corticosteroids in 25 patients (46%), systemic immunomodulatory agents in 14 patients (26%), and biologic agents in 4 patients (7%). Visual acuity at last visit did not correlate with medical treatment method used for inflammation control (P > .05). Sixteen eyes underwent cataract extraction and intraocular lens implantation during the follow-up period. All 16 eyes were in the subset of patients with more than 12 months of follow-up. Visual acuity improved in eyes with cataract extraction from 0.36 ± 0.25 to 0.19 ± 0.20 (P = .02); However, visual acuity in eyes without surgical intervention did not change significantly during the follow-up period (P = .21).
• QUALITATIVE SPECTRAL-DOMAIN OPTICAL COHERENCE TOMOGRAPHY FEATURES OF EPIRETINAL MEMBRANES
Univariate analysis for the association between SD-OCT findings and final visual acuity, as represented in Table 2, showed that focal ERM attachment to the retina, foveal center involvement with ERM, presence of CME, and disruption of IS/OS junction line and ELM were correlated significantly with poor visual acuity. However, multivariate analysis using backward stepwise selection considering all variables revealed: (1) foveal center involvement (P < .001, type 3 Wald chi-square value), (2) focal attachment of the ERM to the inner retina (P = .003, type 3 Wald chi-square value), and (3) disruption of IS/OS junction line (P = .006, type 3 Wald chi-square value) as independent predictors of poor vision.
TABLE 2.
Spectral-Domain Optical Coherence Tomography Characteristics of the Epiretinal Membranes in Patients with Uveitis in Correlation with Visual Acuity
| No. of Eyes | logMAR VA (mean ± SE) | P Value | Spearman Correlation Coefficient | |
|---|---|---|---|---|
| Pattern of attachment of ERM to inner retina | ||||
| Focal attachment | 24 | 0.45 ± 0.10 | Focal vs broad, < .05 | −0.0270 |
| Broad attachment | 38 | 0.15 ± 0.05 | Focal vs both, < .05 | P = .02 |
| Both types of attachment | 14 | 0.17 ± 0.07 | Broad vs both, > .05 | |
| Foveal center involvement with ERM | ||||
| No | 41 | 0.14 ± 0.05 | .002 | 0.503 |
| Yes | 39 | 0.35 ± 0.07 | P < .001 | |
| IS/OS junction at fovea | ||||
| Intact | 64 | 0.18 ± 0.004 | Intact vs significant, < .05 | 0.418 |
| Minor disruptions (< 200 μm) | 8 | 0.21 ± 0.08 | Minor vs significant, < .05 | P < .001 |
| Significant disruptions (< 200 μm) | 8 | 0.91 ± 0.21 | Intact vs minor, > .05 | |
| ELM at fovea | ||||
| Intact | 66 | 0.17 ± 0.04 | Intact vs significant, < .05 | 0.495 |
| Minor disruptions (< 200 μm) | 3 | 0.55 ± 0.32 | Minor vs significant, < .05 | P < .001 |
| Significant disruptions (> 200 μm) | 11 | 0.7 ± 0.16 | Intact vs minor, > .05 | |
| Cystoid macular edema | ||||
| No | 69 | 0.18 ± 0.04 | .003 | 0.364 |
| Yes | 11 | 0.78 ± 0.2 | P = .001 | |
| Foveal contour | ||||
| Normal foveal concavity | 51 | 0.18 ± 0.04 | .002 | 0.53 |
| Decreased or lost concavity | 29 | 0.41 ± 0.08 | P < .001 | |
ELM = external limiting membrane; ERM = epiretinal membrane; IS/OS = inner segment/outer segment; logMAR = logarithm of the minimal angle of resolution; SE = standard error; VA = visual acuity.
Both focal attachment of the ERM to the inner retina and loss of the foveal concavity correlated significantly with the presence of CME (P = .008 and P = .005, respectively; Table 3). Focal attachment of ERM also correlated with loss of normal foveal anatomic features on OCT (P = .03, chi-square test).
TABLE 3.
Epiretinal Membrane Attachment Pattern and Preservation or Loss of Foveal Concavity as Determined with Spectral-Domain Optical Coherence Tomography in Correlation with Cystoid Macular Edema in Patients with Uveitis
| CME
|
P Value | ||
|---|---|---|---|
| Yes | No | ||
| Pattern of attachment of ERM to inner retina | |||
| Focal attachment (n = 24) | 6 (25%) | 18 (75%) | .008 |
| Broad attachment (n = 38) | 4 (10.5%) | 34 (89.5%) | |
| Both focal and broad attachment (n = 14) | 0 | 14 (100%) | |
| Fovea concavity | |||
| Lost foveal concavity (n = 10) | 4 (40%) | 6 (60%) | .005 |
| Preserved foveal concavity (n = 66) | 6 (9%) | 60 (91%) | |
CME = cystoid macular edema; ERM = epiretinal membrane.
• CENTRAL SUBFIELD THICKNESS
Mean CST was 313 μm at the time of first SD-OCT examination and 292 μm at the time of last SD-OCT examination (P = .06). Our observation of a 10% increase in CST (in 9 eyes) and a 20% increase in CST (in 5 eyes) at the last visit compared with the baseline did not correlate with the change in visual acuity (P = .56 and P = 0.66, respectively, Wilcoxon rank-sum test).
• EPIRETINAL MEMBRANE THICKNESS MAP
ERM thickness maps were generated for 34 randomly selected eyes, and morphometric characteristics were analyzed. Mean ERM thickness in the central ETDRS grid subfield was 6.1 ± 6 μm. When patients were divided into 2 groups based on final visual acuity (20/40 and better vs worse than 20/40), patients with visual acuity of 20/40 and better had significantly thinner membranes (P = .04). Mean ERM thickness in the various ETDRS grid subfields is presented in Table 4. Mean ERM thickness at the fovea was correlated significantly with visual acuity (P = .01, test for trend). Longer duration of ERM was correlated significantly with a higher ERM thickness in all ETDRS subfields (Pearson correlation coefficient, 0.4; P < .05). ERMs covering larger areas of the macula also were correlated with thicker ERMs (Spearman correlation, 0.71; P < .001). Mean and maximum ERM thicknesses at the fovea were significantly less than mean and maximum ERM thickness in the parafoveal ring and outer macular ring (Table 5).
TABLE 4.
Epiretinal Membrane Thickness in Early Treatment of Diabetic Retinopathy Study Subfields in Visual Acuity Groups
| BCVA of 20/40 or Better (n = 59) | BCVA between 20/40 and 20/200 (n = 15) | BCVA 20/200 or Worse (n = 6) | P Value (Test for Trend) | |
|---|---|---|---|---|
| Mean ERM thickness at the fovea (μm) | 4.6 ± 0.6 | 7.7 ± 3.4 | 11.5 ± 3 | .02 |
| Mean ERM thickness fovea + parafovea (μm) | 8.2 ± 0.5 | 8.41 ± 2.4 | 15.80 ± 4.2 | .17 |
| Mean ERM thickness entire macula (μm) | 9.3 ± 0.5 | 8.9 ± 2 | 15.4 ± 3.3 | .20 |
BCVA = best-corrected visual acuity; ERM = epiretinal membrane.
Data are presented as mean ± standard deviation unless otherwise indicated.
TABLE 5.
Average and Maximum Epiretinal Membrane Thickness in the Fovea, Parafovea, and Entire Fovea as Determined by the 3D-OCTOR Approach
| Foveal Area | Parafovea | Outer Macular Ring | P Values (Paired t Test) | |
|---|---|---|---|---|
| Mean ERM thickness (μm) | 5.85 ± 5.05 | 9.64 ± 4.13 | 10.63 ± 3.43 | Outer macula ring vs fovea, P < .001 Parafovea vs fovea, P < .001 Outer macula ring vs parafovea, P = .13 |
| Maximum ERM thickness (μm) | 19.56 ± 28.70 | 29.07 ± 19.77 | 31.71 ± 12.92 | Outer macula ring vs fovea, P = .04 Parafovea vs fovea, P = .003 Outer macula ring vs parafovea, P = .48 |
ERM = epiretinal membrane.
Data are presented as mean ± standard deviation unless otherwise indicated.
DISCUSSION
This study reveals clinically significant SD-OCT features of ERMs and the underlying retina in eyes of patients with uveitis. The presence of ERM in the fovea, focal attachment of ERM to the inner retina, and disruption of IS/OS junction are 3 independent factors associated with poor vision. The visual impact of ERMs involving the fovea is not surprising, because one would anticipate that the structural alterations produced by such membranes could lead to functional impairment.
One ERM feature that is readily discernible with SD-OCT is the configuration of the membrane attachment to the retina. In 50% of the uveitic eyes with ERM in our cohort, a focal pattern of attachment to the underlying retina was observed. The focal pattern demonstrated a more undulated or corrugated contour to the underlying retina. ERMs with broad attachment, in contrast, exhibited less retinal surface distortion and fewer visual consequences. These observations are consistent with previous reports pertaining to idiopathic ERM.21 Focal attachment of ERM was an independent factor associated with a less favorable visual acuity in patients with uveitis. The presence of myofibroblasts, fibroblasts, lymphocytes, and occasional macrophages in the ERMs22,23 as well as associated inflammatory cytokines23 can lead to contraction of the ERMs, in turn leading to retinal undulation. Mori and associates also showed that approximately half of the patients with nonidiopathic ERM also have a focal attachment pattern to the retina.19 The prognostic importance of focal attachment of nonuveitic ERM to the retina has been addressed before,8 but the present study shows that focal ERM is associated with lower visual acuity in patients with uveitis as well (P = .003).
The anatomic status of the photoreceptors may be evaluated by assessment of the integrity of IS/OS junction band and the ELM. Disturbance of these lines is associated with poor visual acuity after surgical removal of ERM.8,24,25 Although such outer retinal damage in idiopathic ERM may reflect only the effects of physical forces applied by the contracting inner retinal ERM to the outer retina,26 the intraocular inflammatory milieu in patients with uveitis also may contribute to photoreceptor layer disruption.27 Damage to the IS/OS junction was seen in 20% of the eyes in the present study, and these eyes had significantly poorer vision (P = .006).
The focal attachment pattern also was associated with the presence of CME (P = .008) in our series. ERM is reported in up to 70% of uveitic eyes complicated by CME,28 and its presence often is associated with a poor response to medical treatment and a poor chance for visual improvement.28,29 Although the tangential forces of a focally adherent ERM30 and intraocular inflammation both may contribute to the development of CME, the level of intraocular inflammation was not correlated with the presence of CME in this study. However, the number of eyes with active intraocular inflammation in this series was small.
In the current series of eyes with uveitis and ERM, the incidence of visual loss was low, and median logMAR visual acuity improved over a median follow-up of 24 months. Although the wide range of follow-up makes interpretation of this observation difficult,20 life table analysis for the proportion of eyes losing vision to 20/50 and less and to 20/200 and less demonstrates a fairly stable vision and low rate of visual loss in the long term (Figure 2). Appropriate management of intraocular inflammation and comorbidities such as cataract would prevent visual loss in a considerable number of patients with uveitis, even in the presence of ERM. Correction of media opacities such as cataract was the main factor in visual acuity improvement in our series. Although the inflammation activity and medical treatment methods were not different in patients with less than 12 months of follow-up and more than 12 months of follow-up, 16 eyes in the group with longer follow-up underwent cataract extraction and intra-ocular lens implantation. Visual acuity improved significantly in this subset of eyes compared with those with less than 12 months of follow-up who did not undergo cataract extraction (P = .05). Before a clinical decision is made regarding the extent of the contribution of the ERM to visual loss in eyes with uveitis, all other comorbidities, including media opacity, should be addressed, and surgical removal of ERM may be indicated in focally attached ERMs if they involve the fovea and are associated with photoreceptor disruption and resulting visual loss.
Currently, no commercial SD-OCT manufacturer provides a facility for generation of ERM thickness maps. Even if such automated thickness maps were provided, they likely would be prone to error and artifact.12 In the current study, ERM boundaries were segmented manually using 3D-OCTOR to produce the thickness maps for the ERMs. The results demonstrate that ERM thickness in the foveal area correlates significantly with vision. In patients with visual acuity of 20/40 and better, the average ERM thickness at the fovea was 4.6 ± 0.6 μm, whereas in patients with vision of 20/200 or worse, foveal ERM thickness was 11.6 ± 3 μm (P = .02; Table 4). In contrast, ERM thickness in the parafoveal and outer macula did not correlate with visual acuity. Thus, the foveal ERM thickness may be a useful parameter in future visual correlative studies involving uveitic ERM patients.
ERM thickness in the fovea was less than ERM thickness in the parafoveal and peripheral macula, as determined by ETDRS subfields (Table 5). Also, all 34 eyes for which we mapped ERM thickness showed the presence of ERM in the parafoveal and peripheral macula, but only 25 eyes (74%) had foveal center involvement. Based on these observations, it is plausible that uveitic ERM may begin developing from the peripheral macular areas and spread toward the fovea. Defining the uveitic ERM progression pattern may affect uveitis management strategies. Accordingly, meticulous scrutiny for detection of uveitic ERM in earlier phases in the peripheral macula and more aggressive control of inflammation that may prevent or reduce the progression to foveal involvement may be a clinically relevant treatment paradigm. The correlation of CST on final visual acuity remains controversial.7,8,18,31,32 This inconsistency may stem from significant errors and artifacts in inner retinal boundary detection in the presence of inner retinal abnormalities.12 Although a 20% change in CST correlated well with a clinically important improvement in vision in patients with uveitis and macular edema,11 the current data do not support a similar correlation in the presence of ERM. This further downgrades the clinical use of CST as a reliable monitoring tool in the presence of ERM. Thus, automatically generated central macular thickness does not seem to be a reliable predictor of visual acuity in the presence of uveitic ERM.
In cases with broad ERM attachment to the inner retina, ILM was included in the measurement of the ERM thickness. Therefore, the pseudothickness in broadly attached ERM may overestimate the actual thickness of the ERM in these cases. Most of the patients in current series were in an inactive phase of uveitis; consequently, the role of intraocular inflammation on visual acuity in uveitic ERM could not be evaluated.
In summary, the present study showed that in eyes with uveitis and ERM, visual acuity generally is preserved if comorbidities such as cataract are addressed and intraocular inflammation is controlled. A focal attachment pattern of the ERM to retina, foveal involvement by the ERM, and disruption of the IS/OS junction at the fovea, as determined by SD-OCT, are 3 major independent factors associated with poor visual acuity in uveitic patients with ERM. Central subfield thickness does not correlate with visual acuity in eyes with uveitis and ERM; this could be the result of a higher frequency of errors in automated calculation of CST in the presence of ERM. ERM thickness is higher in eyes with longer duration of uveitis and correlates with lower vision.
Biography

Hossein Nazari, MD, graduated from Zanjan University of Medical Science, Iran, in 1998. He completed his ophthalmology residency with honors at Tabriz University of Medical Sciences, followed by a vitreoretinal fellowship at Rassoul Akram Hospital, Tehran University of Medical Sciences. After graduation, he joined the Department of Ophthalmology at RassoulAkram Hospital, Tehran University of Medical Sciences, as assistant professor. He is currently doing a fellowship in ocular immunology and uveitis in Los Angeles at Doheny Eye Institute, University of Southern California. His major research interest is immune mechanisms in infectious uveitis.
Footnotes
All authors have completed and submitted the icmje form for disclosure of potential conflicts of Interest and the following were reported. Dr Sadda receives research support from Carl Zeiss Meditec, Optos, and Optovue; shares in royalties from intellectual property licensed to Topcon Medical Systems from the Doheny Eye Institute; serves as a consultant for Heidelberg Engineering and Optos; and is supported by Research to Prevent Blindness Physician Scientist Award. Publication of this article was supported in part by Vision Core Grant EY03040 from the National Institutes of Health, Bethesda, Maryland. Involved in Design of study (N.A.R., H.N.); Conduct of study (N.A.R., H.N., S.S., F.M.H.); Collection (N.A.R., H.N.) and management, analysis, and interpretation (N.A.R., H.N., L.D.) of the data; and Preparation, review, and approval of the manuscript (N.A.R., H.N., L.D., S.S.). The study protocol encompassing retrospective data review from the charts with waiver for informed consent was approved by Institutional Review Board of the University of Southern California, Los Angeles, California. The study was in compliance with Health Insurance Portability and Accountability Act regulations.
References
- 1.Kempen JH, Altaweel MM, Holbrook JT, Jabs DA, Sugar EA Multicenter Uveitis Steroid Treatment Trial Research Group. The multicenter uveitis steroid treatment trial: rationale, design, and baseline characteristics. Am J Ophthalmol. 2010;149(4):550–561. doi: 10.1016/j.ajo.2009.11.019. [DOI] [PMC free article] [PubMed] [Google Scholar]
- 2.Ng CH, Cheung N, Wang JJ, et al. Prevalence and risk factors for epiretinal membranes in a multi-ethnic United States population. Ophthalmology. 2011;118(4):694–699. doi: 10.1016/j.ophtha.2010.08.009. [DOI] [PMC free article] [PubMed] [Google Scholar]
- 3.Gomes NL, Corcostegui I, Fine HF, Chang S. Subfoveal pigment changes in patients with longstanding epiretinal membranes. Am J Ophthalmol. 2009;147(5):865–868. doi: 10.1016/j.ajo.2008.12.021. [DOI] [PubMed] [Google Scholar]
- 4.Do DV, Cho M, Nguyen QD, et al. The impact of optical coherence tomography on surgical decision making in epiretinal membrane and vitreomacular traction. Trans Am Ophthalmol Soc. 2006;104:161–166. [PMC free article] [PubMed] [Google Scholar]
- 5.Legarreta JE, Gregori G, Knighton RW, Punjabi OS, Lalwani GA, Puliafito CA. Three dimensional spectral-domain optical coherence tomography images of the retina in the presence of epiretinal membranes. Am J Ophthalmol. 2008;145(6):1023–1030. doi: 10.1016/j.ajo.2008.01.014. [DOI] [PubMed] [Google Scholar]
- 6.Arichika S, Hangai M, Yoshimura N. Correlation between thickening of the inner and outer retina and visual acuity in patients with epiretinal membrane. Retina. 2010;30(3):503–508. doi: 10.1097/IAE.0b013e3181bd2d65. [DOI] [PubMed] [Google Scholar]
- 7.Oster SF, Mojana F, Brar M, Yuson RM, Cheng L, Freeman WR. Disruption of the photoreceptor inner segment/outer segment layer on spectral domain-optical coherence tomography is a predictor of poor visual acuity in patients with epiretinal membranes. Retina. 2010;30(5):713–718. doi: 10.1097/IAE.0b013e3181c596e3. [DOI] [PubMed] [Google Scholar]
- 8.Falkner-Radler CI, Glittenberg C, Hagen S, Benesch T, Binder S. Spectral-domain optical coherence tomography for monitoring epiretinal membrane surgery. Ophthalmology. 2010;117(4):798–805. doi: 10.1016/j.ophtha.2009.08.034. [DOI] [PubMed] [Google Scholar]
- 9.Nigam N, Bartsch DU, Cheng L, et al. Spectral domain optical coherence tomography for imaging ERM, retinal edema, and vitreomacular interface. Retina. 2010;30(2):246–253. doi: 10.1097/IAE.0b013e3181baf6dc. [DOI] [PubMed] [Google Scholar]
- 10.Keane PA, Liakopoulos S, Jivrajka RV, et al. Evaluation of optical coherence tomography retinal thickness parameters for use in clinical trials for neovascular age-related macular degeneration. Invest Ophthalmol Vis Sci. 2009;50(7):3378–3385. doi: 10.1167/iovs.08-2728. [DOI] [PubMed] [Google Scholar]
- 11.Sugar EA, Jabs DA, Altaweel MM, et al. Identifying a clinically meaningful threshold for change in uveitic macular edema evaluated by optical coherence tomography. Am J Ophthalmol. 2011;152(6):1044–1052.e5. doi: 10.1016/j.ajo.2011.05.028. [DOI] [PMC free article] [PubMed] [Google Scholar]
- 12.Giani A, Cigada M, Choudhry N, et al. Reproducibility of retinal thickness measurements on normal and pathologic eyes by different optical coherence tomography instruments. Am J Ophthalmol. 2010;150(6):815–824. doi: 10.1016/j.ajo.2010.06.025. [DOI] [PubMed] [Google Scholar]
- 13.Sadda SR, Joeres S, Wu Z, et al. Error correction and quantitative subanalysis of optical coherence tomography data using computer-assisted grading. Invest Ophthalmol Vis Sci. 2007;48(2):839–848. doi: 10.1167/iovs.06-0554. [DOI] [PubMed] [Google Scholar]
- 14.Joeres S, Tsong JW, Updike PG, et al. Reproducibility of quantitative optical coherence tomography subanalysis in neovascular age-related macular degeneration. Invest Ophthalmol Vis Sci. 2007;48(9):4300–4307. doi: 10.1167/iovs.07-0179. [DOI] [PubMed] [Google Scholar]
- 15.Sadda SR, Keane PA, Ouyang Y, Updike JF, Walsh AC. Impact of scanning density on measurements from spectral domain optical coherence tomography. Invest Ophthalmol Vis Sci. 2010;51(2):1071–1078. doi: 10.1167/iovs.09-4325. [DOI] [PMC free article] [PubMed] [Google Scholar]
- 16.Heussen FM, Ouyang Y, McDonnell EC, et al. Comparison of manually corrected retinal thickness measurements from multiple spectral-domain optical coherence tomography instruments. Br J Ophthalmol. 2012;96(3):380–385. doi: 10.1136/bjo.2010.201111. [DOI] [PubMed] [Google Scholar]
- 17.Jabs DA, Nussenblatt RB, Rosenbaum JT Standardization of Uveitis Nomenclature (SUN) Working Group. Standardization of uveitis nomenclature for reporting clinical data. Results of the First International Workshop. Am J Ophthalmol. 2005;140(3):509–516. doi: 10.1016/j.ajo.2005.03.057. [DOI] [PMC free article] [PubMed] [Google Scholar]
- 18.Wilkins JR, Puliafito CA, Hee MR, et al. Characteristics of epiretinal membranes using optical coherence tomography. Ophthalmology. 1996;103(12):2142–2151. doi: 10.1016/s0161-6420(96)30377-1. [DOI] [PubMed] [Google Scholar]
- 19.Mori K, Gehlbach PL, Sano A, Deguchi T, Yoneya S. Comparison of epiretinal membranes of differing pathogenesis using optical coherence tomography. Retina. 2004;24(1):57–62. doi: 10.1097/00006982-200402000-00009. [DOI] [PubMed] [Google Scholar]
- 20.Jabs DA. Improving the reporting of clinical case series. Am J Ophthalmol. 2005;139(5):900–905. doi: 10.1016/j.ajo.2004.12.009. [DOI] [PMC free article] [PubMed] [Google Scholar]
- 21.Gupta P, Sadun AA, Sebag J. Multifocal retinal contraction in macular pucker analyzed by combined optical coherence tomography/scanning laser ophthalmoscopy. Retina. 2008;28(3):447–452. doi: 10.1097/IAE.0b013e318160a754. [DOI] [PubMed] [Google Scholar]
- 22.Karavellas MP, Azen SP, MacDonald JC, et al. Immune recovery vitritis and uveitis in AIDS: clinical predictors, sequelae, and treatment outcomes. Retina. 2001;21(1):1–9. doi: 10.1097/00006982-200102000-00001. [DOI] [PubMed] [Google Scholar]
- 23.Hiscott P, Hagan S, Heathcote L, et al. Pathobiology of epiretinal and subretinal membranes: possible roles for the matricellular proteins thrombospondin 1 and osteonectin (SPARC) Eye (Lond) 2002;16(4):393–403. doi: 10.1038/sj.eye.6700196. [DOI] [PubMed] [Google Scholar]
- 24.Hiscott PS, Unger WG, Grierson I, McLeod D. The role of inflammation in the development of epiretinal membranes. Curr Eye Res. 1988;7(9):877–892. doi: 10.3109/02713688808997245. [DOI] [PubMed] [Google Scholar]
- 25.Inoue M, Morita S, Watanabe Y, et al. Inner segment/outer segment junction assessed by spectral-domain optical coherence tomography in patients with idiopathic epiretinal membrane. Am J Ophthalmol. 2010;150(6):834–839. doi: 10.1016/j.ajo.2010.06.006. [DOI] [PubMed] [Google Scholar]
- 26.Suh MH, Seo JM, Park KH, Yu HG. Associations between macular findings by optical coherence tomography and visual outcomes after epiretinal membrane removal. Am J Ophthalmol. 2009;147(3):473–480.e3. doi: 10.1016/j.ajo.2008.09.020. [DOI] [PubMed] [Google Scholar]
- 27.Unoki N, Nishijima K, Kita M, Hayashi R, Yoshimura N. Structural changes of fovea during remission of Behçet’s disease as imaged by spectral domain optical coherence tomography. Eye (Lond) 2010;24(6):969–975. doi: 10.1038/eye.2009.231. [DOI] [PubMed] [Google Scholar]
- 28.Roesel M, Heimes B, Heinz C, Henschel A, Spital G, Heiligenhaus A. Comparison of retinal thickness and fundus-related microperimetry with visual acuity in uveitic macular oedema. Acta Ophthalmol. 2011;89(6):533–537. doi: 10.1111/j.1755-3768.2009.01750.x. [DOI] [PubMed] [Google Scholar]
- 29.Markomichelakis NN, Halkiadakis I, Pantelia E, et al. Course of macular edema in uveitis under medical treatment. Ocul Immunol Inflamm. 2007;15(2):71–79. doi: 10.1080/09273940701244509. [DOI] [PubMed] [Google Scholar]
- 30.Brar M, Yuson R, Kozak I, et al. Correlation between morphologic features on spectral-domain optical coherence tomography and angiographic leakage patterns in macular edema. Retina. 2010;30(3):383–389. doi: 10.1097/IAE.0b013e3181cd4803. [DOI] [PMC free article] [PubMed] [Google Scholar]
- 31.Massin P, Allouch C, Haouchine B, et al. Optical coherence tomography of idiopathic macular epiretinal membranes before and after surgery. Am J Ophthalmol. 2000;130(6):732–739. doi: 10.1016/s0002-9394(00)00574-2. [DOI] [PubMed] [Google Scholar]
- 32.Suzuki T, Terasaki H, Niwa T, Mori M, Kondo M, Miyake Y. Optical coherence tomography and focal macular electroretinogram in eyes with epiretinal membrane and macular pseudohole. Am J Ophthalmol. 2003;136(1):62–67. doi: 10.1016/s0002-9394(03)00149-1. [DOI] [PubMed] [Google Scholar]