

Abstract
Lay Abstract
A stronger preference for high rates of stimulation when tested after feeding at four months of age has been reported in Neonatal Intensive Care Unit (NICU) graduates who later were diagnosed with autism relative to those who were not. This visual preference is typical of newborns, is likely mediated by arousal systems in the brainstem, and should no longer be present by four months. The fact that it was so persistent in babies who later developed autism suggested they may have had atypical brainstem development or functioning. There exists a group of newborns who initially fail Auditory Brainstem Response screens (ABRs; a measure of the integrity of their brainstem auditory pathways) but eventually recover by hospital discharge suggesting they have atypical brainstem development. We therefore examined the extent to which this problem with ABR functioning along with four-month-olds’ preference for high rates of stimulation predicts the later occurrence of autism in toddlers and preschoolers. We found that preference for higher rates of stimulation at four months was highly associated with later measures of autism severity and with language development problems but only in those who had initially abnormal ABRs. It was concluded that the joint occurrence of initially abnormal neonatal ABRs and preference for more stimulation at four months, both indices of early brainstem dysfunction, may be a marker for the development of autism.
Scientific Abstract
The authors evaluated the contribution of initially abnormal neonatal Auditory Brainstem Responses (ABRs) and four month Arousal Modulated Attention visual preference to later Autism Spectrum Disorder (ASD) behaviors in Neonatal Intensive Care Unit (NICU) graduates. A longitudinal study design was used to compare NICU graduates with normal ABRs (n=28) to those with initially abnormal ABRs (n=46) that later resolved. At four months post-term-age, visual preference (measured after feeding) for random check patterns flashing at 1, 3, or 8 Hz, and gestational age (GA) served as additional predictors. Outcome measures were PDD Behavior Inventory (PDDBI) scores at 3.4 (SD=1.2) years, and DQs obtained around the same age with the Griffiths Mental Development Scales (GMDS). Preferences for higher rates of stimulation at four months were highly correlated with PDDBI scores (all p values <.01), and the GMDS Hearing and Speech DQ but only in those with initially abnormal ABRs. Effects were strongest for a PDDBI social competence measure most associated with a diagnosis of autism. For those with abnormal ABRs, increases in preference for higher rates of stimulation as infants were linked to non-linear increases in severity of ASD at three years and to an ASD diagnosis. Abnormal ABRs were associated with later reports of repetitive and ritualistic behaviors irrespective of four month preference for stimulation. The joint occurrence of initially abnormal neonatal ABRs and preference for more stimulation at four months, both indices of early brainstem dysfunction, may be a marker for the development of autism in this cohort.
Keywords: Auditory Brainstem Response, Infancy, Attention, Arousal, Repetitive and Ritualistic Behaviors, Autism Spectrum Disorder
Introduction
Identification of early signs of Autism Spectrum Disorder (ASD) is of utmost importance. There is increasing evidence that early behavioral intervention can be effective for a significant number of children (Howard, Sparkman, Cohen, Green, & Stanislaw, 2005; Virues-Ortega, 2010), a factor that becomes even more important with recent reports of a higher prevalence of children being diagnosed with ASD (Wingate et al., 2012). Biomarkers that are of etiological relevance to ASD, and of import in prediction such as the FMR1 mutation (Tassone, Pan, Amiri, Taylor, & Hagerman, 2008), account for only a small proportion of cases. Early recognition typically relies on behavioral signs, such as failure to respond to name. These behavioral signs usually are recognized retrospectively between 18 to 24 months of age; however, recognition depends on the observation skills and experience of the caregiver (Ozonoff et al., 2009). Studying younger siblings of children with ASD, who are at much higher risk for ASD, has provided researchers the opportunity to investigate behavioral signs earlier in infancy (Zwaigenbaum et al., 2007). As such, a recent prospective study reported behavioral signs of ASD by one year of age but not earlier (Ozonoff et al., 2010). Researchers have proposed that failure to detect behavioral signs before one year may be due to their emergence secondary to earlier deficits in processes underlying their development. Zwaigenbaum et al. (2005), for example, reported that younger siblings showing decrements in their ability to disengage from a visual stimulus between 6- and 12-months of age are more likely to develop ASD. Similar findings were reported by Elsabbagh et al. (2009). Further support for this early processing deficit model comes from longitudinal studies of resting state EEG (Bosl, Tierney, Tager-Flusberg, & Nelson, 2011) and event-related potentials in response to dynamic eye gaze shifts (Elsabbagh et al., 2012) in at-risk infant siblings. Both studies revealed significant differences in brain function in infants as young as 6 months of age that were strongly associated with later development of ASD.
A higher prevalence of ASD also has been associated with obstetric and neonatal factors requiring Neonatal Intensive Care (NICU) admission. There are a myriad of such medical risk factors (Kolevzon, Gross, & Reichenberg, 2007) from preterm birth and obstetric complications (e.g., bleeding, infection) to birth complications (e.g., hypoxia) to postnatal complications (e.g., IVH). Schendel and Bhasin (2008) found a 2-fold increased risk for ASD due to lower birth weight (BW) and gestational age (GA), even after controlling for other poor developmental outcomes. However, these high-medical-risk children have tended to be excluded from infant sibling studies (e.g., Ben-Yizhak et al., 2011), despite their higher risk for autism, likely due, in part, to the additional confounds from complications of pregnancy, delivery, and/or hospitalization after birth.
Karmel et al (2010) identified early behavioral abnormalities more prevalent in NICU graduates later diagnosed with ASD compared to NICU matched controls. Two involved the visual system: 1) asymmetric visual tracking at one month PTA and 2) greater preference for higher rates of visual stimulation (i.e., looking longer to 8 Hz vs. 3 or 1 Hz) when less aroused at four months PTA in their Arousal Modulated Attention (AMA) procedure (Gardner, Karmel, & Magnano, 1992; Gardner & Karmel, 1995; Karmel & Gardner, 1996).
Typically, healthy term and preterm newborn and one-month-old infants show greater attention to more stimulating events when less aroused (after feeding) and to less stimulating events when more aroused (before feeding or with additional stimulation) in the AMA procedure, a homeostatic effect presumably mediated at the brainstem level. This ability to modulate internal and external sources of stimulation is disrupted by CNS pathology and, importantly, predicts later outcome (Gardner, Karmel, & Flory, 2003). By four months, higher sub-cortical and mid-brain levels of control develop that inhibit this homeostatic effect (Gardner & Karmel, 1995).
The persistent preference for higher rates at four months in those who developed ASD is interesting, in part because of its face validity; it mimics behaviors seen in ASD such as fascination with flashing lights (Rincover, Newsom, Lovaas, & Koegel, 1977). Etiologically, the ASD group’s visual preference is unique in that it differed from that seen in neonates having severe CNS pathology or in neonates prenatally exposed to cocaine, both of whom show deficits in modulation but in opposite directions. Studies indicate the greater the CNS pathology, the greater the preference for lower rates of stimulation across all arousal conditions, even when less aroused (Gardner et al., 1992). Prenatal cocaine exposure leads to strong preference for higher rather than lower rates of stimulation in all conditions, even when more aroused (Karmel & Gardner, 1996). By four months, both the CNS and cocaine effects abate.
Since neonatal AMA responding likely is mediated by brainstem function (Gardner & Karmel, 1995), continued persistent preference for higher rates at four months in the group that developed ASD suggests either atypical development in the brainstem or atypical connectivity between the brainstem and upstream circuits that developmentally modulate its function. Anatomical abnormalities in the brainstem in ASD have been reported although it is unclear to what extent these observations play a role in etiology (Coleman & Gilberg, 2012). Even more interesting are the findings of atypical gray and white matter connectivity in autism (Cauda et al., 2011; Wolff et al., 2012) as well as atypical development in networks (DiMartino et al., 2011; Wegiel et al., 2010; Fatemi et al., 2012) that connect to both brainstem and higher order structures. A number of studies implicate multiple sub-cortical systems in ASD including brainstem structures involved with arousal, visual, and auditory systems (Hashimoto et al., 1991; Jou, Minshew, Melhem, Keshavan, & Hardan, 2009; Kulesza, et al., 2011), cerebellum (Fatemi et al., 2012; Wegiel et al., 2010), striatum (DiMartino et al., 2011) and amygdala (Amaral, Bauman, & Schumann, 2003; Baron-Cohen et al., 2000), among others. Since multiple brainstem-level structures and pathways are implicated in ASD, examining a number of early measures of functional as well as structural integrity of the brainstem and brainstem pathways likely is important for early prediction. Such findings suggest the need for identification of early signs of ASD and potentially for having greater understanding of its pathogenesis.
One such measure is the Auditory Brainstem Response (ABR), evaluated routinely in the larger NICU cohort, not just to assess hearing but also to track delays and recovery in neural transmission speeds as an indicator of early brainstem dysfunction. For example, Karmel, Gardner, Zappulla, Magnano, & Brown (1988) found that delayed ABR component latencies occurred in 82% of cases with abnormal cranial ultrasounds and were not a function of chronic peripheral auditory problems. With respect to autism, delayed ABR latencies have been reported in young children suspected of having ASD, also despite normal hearing (Roth, Muchnik, Shabtai, Hildesheimer, & Henkin, 2012). Interestingly, decreased transmission speed in early components of the ABR waveform (i.e., increased inter-peak latencies in wave I–III) was observed in a large sample of people with ASD as well as in their unaffected first-degree relatives compared to controls (Maziade et al., 2000). In general, it is likely that almost 60% of persons with ASD might have delayed ABR latencies (Rosenhall, Nordin, Brantberg, & Gillberg, 2003). Recently, Kulesza, Lukose, & Stevens (2011) provided morphological evidence supporting the ABR studies, in their finding of atypical development in the superior olive in brainstems from 9/9 individuals with ASD (not present in 4/4 controls), clearly indicating abnormalities in a structure that is an important part of the auditory pathway. These authors suggested ABR testing in infancy might have diagnostic significance for predicting ASD.
Interestingly, a significant number of NICU infants with no signs of abnormality on cranial ultrasound, exhibit abnormal ABRs (typically delayed wave latencies but occasionally unusually fast latencies) that resolve by hospital discharge, but still differed from infants with normal ABRs. Gardner et al (1990) noted that such infants showed high incidences rates of visual attention problems as neonates, preferring lower rates of stimulation in the AMA task, much like more severely brain damaged infants. Recently, Geva et al. (2011) reported that infants born pre-term who had initially abnormal ABRs that later resolved showed atypical visual social engagement at four months PTA.
Since (1) ASD is more likely in children considered at high-medical-risk due to obstetric or neonatal complications, many having initially abnormal ABRs that almost always resolve by NICU discharge or shortly thereafter (Karmel et al., 1988; Stein, Ozdamar, Kraus, & Paton, 1983; Suzuki & Suzumura, 2004), (2) visual attending problems are characteristic of this group with this visual attending differing in those with initially abnormal ABRs (Gardner et al., 1990; Geva et al., 2011), and (3) evidence implicates atypical brainstem function and development in ASD, including structures important to the arousal, visual and auditory systems, we investigated the effects of initially abnormal ABRs and AMA performance on later expression of ASD in NICU graduates. We hypothesized that the combination of these measures will more likely serve as a marker of ASD related behaviors than either by itself since their combination is more likely to assess the widespread problems with brainstem-level structure and function reported in ASD.
METHODS
Participants
Children in this study are a subset of our longitudinal study of children at-risk for developmental problems due to preterm birth and medical factors requiring assignment to the NICU. Selection criteria were:
ABR evaluation in the NICU;
Completion of the AMA procedure at 4 months PTA;
Parent completion of the PDD Behavior Inventory (PDDBI), an ASD rating instrument (Cohen & Sudhalter, 2005; Cohen et al., 2010);
Absence of major developmental problems such as Down Syndrome or Cerebral Palsy;
Absence of significant brain damage documented by cranial ultrasound such as IVH (Papile Grade >I), ventriculomegaly (>5 mm), periventricular leukomalacia, or seizures requiring treatment documented by EEG.
Seventy-four children met these criteria. Mean (SD) GA was 34.7 (3.59) weeks; 65% were born <37 weeks; 32% <33 weeks. Mean (SD) BW was 2347 (867.9) g. Mean (SD) age of children at the time the PDDBI was completed was 3.5 (1.2) years. A subset (n=14) had a diagnosis on the autism spectrum. Six of these children had been evaluated prior to 2008 in our clinic. Starting in 2008, to obtain a more widespread sample, parents of all high-medical-risk NICU graduates were asked to complete the PDDBI at 28 and 51 month follow-up appointments. The other eight children (10% of the 2008+ cohort) were diagnosed with ASD by our clinic (n=5), by a developmental pediatrician (n=1), or by parent interview with the ADI-R (n=2) (Lord, Rutter, & Le, 1994). None of the remaining 60 children were identified or considered suspect as being on the autism spectrum during behavior testing at their 24 or 36 month follow-up assessments, were not reported by their mothers as showing signs of ASD, and were not receiving special services because of ASD or suspected ASD. Two had siblings with ASD.
Research protocols were approved by the IRBs of both institutions and written informed consents were obtained.
Measures
Auditory Brainstem Response (ABR)
ABRs were administered primarily as an indicator of the functional integrity of neural conduction in the brainstem and not as a measure of hearing, per se. Testing typically occurred at the bedside shortly after birth, but not sooner than 24 hrs or not before 31–32 weeks post-conception if born very preterm (average of 10.7 (SD=15.1) days after birth). Ipsilateral left ear vertex-to-mastoid recordings were made using 100 μsec rectangular rarefaction click stimuli 80 dB above adult normal hearing level (nHL) presented at a rate of 12.9/s. Our standard average ABR waveform consisted of 3072 (3 sets of 1024) artifact-free trials. Two additional sets of 2048 (2 sets of 1024) trials were recorded at 75 and 70 dB nHL to increase the reliability of determining the peaks at 80 dB. Stimulus delivery and response averaging were done using Intelligent Hearing System Brainstem Smart EP System (1997). A calibrated miniature SONY Walkman earphone was mounted with cotton backing in a rubber holder (standard nursery nipple) and taped over the ear using 3M Micropore paper tape to create an acoustic chamber (for a detailed description of the earphone and testing procedure, see Karmel et al. (1988). Unwanted stimulus intensity variation within a trial was avoided since the earphone remained at a constant distance and assured appropriate delivery of the auditory stimulus to the neonate even if the head moved. These methods produce waveforms in both preterm and term newborn infants that provide the most reliable identification of the three major ABR component latencies (Waves I, III, and V, clinically accepted) to specify brainstem pathology (Karmel et al., 1988).
Age-dependent norm-referenced percentiles for transmission speeds of component latencies for Waves I, III, and V, and latency intervals for Wave I–III, III–V, and I–V for the target 80 dB condition were derived; values <10th or >90th percentile for age at test, or not reliably identified were considered indicators of neurofunctional abnormality (Karmel et al., 1988). Where possible, to track recovery, infants with abnormal ABRs were followed on the NICU until hospital discharge. All but one normalized by discharge; that one at one month PTA.
Forty-six infants had initially abnormal ABRs (Abnormal ABR group). Forty-one had delayed latencies or prolonged Wave III–V intervals. Five had Wave III latencies significally shorter than expected (<10th percentile). Short latency infants were more likely to have intrauterine growth restriction suggested to accelerate neurological maturation. Omitting the short latency cases, normal and abnormal ABR groups did not differ in Wave I latency. Latencies for Wave III (t(63)=−4.14, p<.000), Wave V (t(63)=−9.89, p<.000), and the Wave III–V interval (t(63) = −4.62, p<.000) were longer in the Abnormal ABR group, as might be expected. Fourteen in the Abnormal ABR group and one in the Normal ABR group had very mild CNS injury detected on cranial ultrasound not considered of clinical significance such as: subependymal hemorrhage, IVH (Papile Grade I); prominent choroids; or tiny choroid cysts.
Table 1 shows birth and demographic characteristics of the two ABR Groups. Post-conceptional age (PCA) at test did not differ. The abnormal ABR group was born earlier and weighed less. They spent more time in the hospital secondary to complications associated with preterm birth and/or more serious medical status. Abnormal ABR cases born after 36 weeks did not differ from term neonates with normal ABRs on these characteristics (p’s >0.05).
Table 1.
Demographic characteristics (mean and range) of the ABR Groups
| Birth and Demographic Characteristics | Normal (N=28) | Abnormal (N=46) |
|---|---|---|
|
| ||
| Infant | ||
|
| ||
| Birth Weight (g) | 2616.0 (1474 – 4508) | 2183.8 (569 – 4082) |
|
| ||
| GA (weeks) | 36.0 (30 – 41) | 34.0 (24 – 40) |
|
| ||
| Percent < 37 weeks | 54 | 72 |
| Percent < 33 weeks | 7 | 33 |
|
| ||
| Percent Males | 46 | 61 |
|
| ||
| Head Circumference (cm) | 32.4 (28 – 43) | 30.7 (19.50 – 36) |
|
| ||
| Length (cm) | 46.1 (41 – 54.6) | 43.6 (28.2 – 53.5) |
|
| ||
| Apgar 1 min | 7.9 (1 – 9) | 7.2 (1 – 9) |
|
| ||
| Apgar 5 min | 8.6 (4 – 9) | 8.2 (3 – 9) |
|
| ||
| Days in Hospital | 9.6 (3 – 41) | 21.0 (2 – 101) |
|
| ||
| PCA at ABR Test (weeks) | 36.5 (32.3 – 43.4) | 35.8 (32.0 – 42.6) |
|
| ||
| Mother | ||
|
| ||
| Age at Delivery (years) | 34.2 (22.6 – 45.7) | 32.92 (16.6 – 45.4) |
|
| ||
| Education (years) | 15.9 (12 – 20) | 14.7 (6 – 22) |
Italicized: p<.05; bold font: p<.01
Arousal Modulated Attention (AMA)
The AMA procedure measures regulation of visual attention to variations in stimulation when infants are tested at higher and lower levels of exogenous (extra stimulation before each trial) or endogenous (before or after feeding) arousal. A visual stimulus preference is determined when the infant looks longer to one stimulus than another. AMA was administered in the week prior to hospital discharge, at one month, and at four months PTA.
The visual preference apparatus contains a back panel having two openings for stimulus presentation (15.2 cm2 each, with inner edges 30.4 cm apart), and a centrally located peephole. Visual stimuli at four months were identical pairs of patterns (1/2 in. random checks) square-wave modulated on and off at rates of 1, 3, or 8 Hz. To equate for total stimulus luminance across frequencies, stimuli having a 50% duty cycle were used that resulted in equal on/off stimulus durations.
During each trial, an observer looked through the peephole and recorded duration of fixation to each stimulus of a pair. This is a standard procedure with interobserver reliability very high across multiple studies. Infants were presented with all possible pairs of stimuli with right-left positions reversed for a total of six, 15-s trials in each of the three arousal conditions (trial repeated automatically if criterion of 5 s looking at one or both stimuli not met). Sequences were randomized across conditions and infants. Average looking time in seconds and the average proportion of looking to each of the 1, 3 and 8 Hz stimuli per trial was computed across trials. The linear slope of the function across the three frequencies for each participant (AMA slopes) served as a measure of preference across the different frequencies (Gardner et al., 1992; Gardner & Karmel, 1995). The more positive the AMA slope, the greater the preference for the 8 Hz stimulus and the more negative the AMA slope, the greater the preference for the 1 Hz stimulus. The individual AMA slope values, obtained at four months PTA (mean (SD)) under the low arousal condition (after feeding), were used as a predictor variable for this report.
PDD Behavior Inventory (PDDBI)
The PDDBI was completed by the child’s mother. Children’s mean (SD) age was 3.5 (1.2) years. The PDDBI is a valid and reliable assessment tool that generates age-normed T-scores normally distributed within the reference sample (Cohen & Sudhalter, 2005). The PDDBI assesses the repetitive, ritualistic, and pragmatic behavior problems characteristic of autism as well as social communication competence. Data indicate that, in young children, the PDDBI domains and composite scores that assess social communication competence have much better discrimination value than do the repetitive, ritualistic and pragmatic behavior domains and composites (Cohen et al., 2010) which have good sensitivity but poor specificity at this age. For our analyses, we evaluated the composite scores that tap each of these areas because all are deemed essential for autism diagnosis.
Expressive Social Communication Abilities composite. Measures non-vocal social abilities and expressive language competence. Higher T-scores indicate greater competence. Sensitivity = 88%; specificity = 93% (cut-off ≤ 67).
Social Discrepancy. Measures the difference between non-vocal social communication skills scores and non-vocal social interaction problems scores. In children with autism the Social Discrepancy score is near zero. As the score becomes positive in sign, abilities outweigh deficits. Sensitivity = 98%; specificity = 93% (cut-off ≤ +25).
Semantic/Pragmatic Language Discrepancy. Measures the difference between expressive language skills scores and echoic or repetitive language scores. Interpretation is similar to the Social Discrepancy measure. Sensitivity = 98%; specificity = 79% (cut-off ≤ +13).
Repetitive, Ritualistic, and Pragmatic Problems composite. Measures sensory seeking behaviors, ritualistic behaviors, social interaction problems and repetitive language. Higher T-scores indicate greater severity. Sensitivity = 91%; specificity = 49% (cut-off >= 40).
Autism composite. Measures overall severity of autism behaviors. Higher T-scores indicate more severe problems. This composite is comprised of the Social Discrepancy and Semantic/Pragmatic Language Discrepancy scores along with the domains that assess sensory seeking and ritualistic behaviors. Sensitivity = 100%; specificity = 79% (cut-off ≥ 32).
Griffiths Mental Development Scales (GMDS) (Griffiths, 1984)
This test was administered at 28, 34, and 42 months. GMDS and PDDBI test ages were matched as closely as possible. The GMDS assesses six aspects of cognitive functioning in young children including Locomotor Skills, Personal-Social Skills, Hearing and Speech, Eye-Hand Coordination, Performance and Practical Reasoning. Each skill area yields a DQ (MA/CA). For the present study only the Hearing and Speech (Speech) and Performance DQs were examined since children with ASD have lower language than performance scores on most intelligence tests, and this is also true for the GMDS (Sandberg, Nyden, Gillberg, & Hjelmquist, 1993). Information was available on 64 children. Five children did not cooperate, four were lost to follow-up, and one was too young. Scores for three children were estimated using multiple regression on our larger database (n=280) based on later testing with the Differential Abilities Scale (multiple R for Speech DQ was 0.71, p<.000 and for Performance DQ was 0.59, p<.000).
Design and Data Analyses
Independent variables were ABR group and 4-month AMA slopes. GA served as a control and a proxy for preterm birth. Hierarchical multiple regression was used for the analyses except where indicated. Order of entry was determined by development with GA first, ABR group second and 4-month AMA slopes third. Statistica software was used for these analyses (StatSoft, 2011).
RESULTS
Association between Abnormal ABR and ASD Diagnosis
Ninety-three percent of ASD cases were in the Abnormal ABR group versus 56% of non-ASD cases (Fisher’s exact p=.012 (2-tail); odds ratio (OR) =10.2; 95% CI 1.3–83.5). Twenty-eight percent of those in the Abnormal ABR group had ASD compared with 4% (1 case) in the Normal ABR group. Diagnosis was blind to ABR results. Thus, being in the Abnormal ABR increased the risk of later ASD.
Associations among ABR Groups, PDDBI Scores, GMDS Quotients, and AMA Slopes
Table 2 shows the hierarchical analyses for the PDDBI scores and the GMDS Performance and Hearing and Speech DQs. For the PDDBI, GA was significantly associated only with the Repetitive, Ritualistic, and Pragmatic Problems composite (p<.02), the Autism composite (p<.02) and the Social Discrepancy (p<.01) scores in step one (lower GA associated with more severe problems). However, the influence of GA no longer appeared or was greatly reduced by step two. As shown in Table 2, beta weights decreased for GA at each step and remained significant (p<.05) only for the Social Discrepancy score.
Table 2.
Hierarchical regression analyses predicting PDDBI and GMDS from GA (Step 1), ABR Group (Step 2), AMA Slope scores at four months (Step 3).† Columns show adjusted R2, beta weights for GA, ABR, and AMA Slope, and overall model p values
| PDDBI (n=74) | Adj. R2 | GA β Step 1 |
ABR β Step 2 |
AMA Slope β Step 3 |
p |
|---|---|---|---|---|---|
|
| |||||
| Autism Composite | |||||
| Step 1 | 0.07 | −0.29 | --------- | --------- | .011 |
| Step 2 | 0.19 | −0.19 | 0.37 | --------- | .000 |
| Step 3 | 0.25 | −0.18 | 0.35 | 0.27 | .000 |
|
| |||||
| Social Discrepancy | |||||
| Step 1 | 0.09 | 0.32 | --------- | --------- | .006 |
| Step 2 | 0.21 | 0.21 | −0.38 | --------- | .000 |
| Step 3 | 0.36 | 0.20 | −0.35 | −0.40 | .000 |
|
| |||||
| Semantic-Pragmatic Language Discrepancy | |||||
| Step 1 | 0.03 | 0.20 | --------- | --------- | .090 |
| Step 2 | 0.12 | 0.12 | −0.30 | --------- | .009 |
| Step 3 | 0.18 | 0.10 | −0.28 | −0.29 | .001 |
|
| |||||
| Expressive Social Communication Abilities Composite | |||||
| Step 1 | 0.02 | 0.18 | --------- | --------- | .135 |
| Step 2 | 0.07 | 0.11 | −0.25 | --------- | .034 |
| Step 3 | 0.22 | 0.09 | −0.22 | −0.40 | .000 |
|
| |||||
| Repetitive, Ritualistic, and Pragmatic Problems Composite | |||||
| Step 1 | 0.06 | −0.28 | --------- | --------- | .017 |
| Step 2 | 0.14 | −0.20 | 0.30 | --------- | .002 |
| Step 3 | 0.13 | −0.19 | 0.29 | .11 | .004 |
|
| |||||
| GMDS (n=67) | Adj. R2 | GA β Step 1 |
ABR β Step 2 |
AMA Slope β Step 3 |
p |
|
| |||||
| Hearing and Speech | |||||
|
| |||||
| Step 1 | 0.06 | 0.28 | --------- | --------- | .021 |
|
| |||||
| Step 2 | 0.13 | 0.19 | −0.28 | --------- | .005 |
|
| |||||
| Step 3 | 0.19 | 0.15 | −0.30 | −0.28 | .001 |
|
| |||||
| Performance | |||||
| Step 1 | 0.02 | 0.19 | --------- | --------- | .134 |
| Step 2 | 0.02 | 0.15 | −0.12 | --------- | .215 |
| Step 3 | 0.02 | 0.13 | −0.13 | −0.13 | .242 |
Italicized: p<.05; bold font: p<.01
The Repetitive, Ritualistic, and Pragmatic Problems composite score was influenced only by ABR group (p<.01; accounting for about 11% of the variance) with the abnormal ABR group reported to have more problems. The mean (SE) T-score for the Repetitive, Ritualistic, and Pragmatic Problems composite was 39.2 (2.1) for the Normal ABR group and 50.0 (2.3) for the Abnormal ABR group.
Both ABR group and AMA slopes significantly influenced outcome for the scores that assessed some aspect of social communication competence. The largest effect was for the Social Discrepancy score (adjusted R2=.36, p<.000), a measure of relative non-vocal social competence, followed by the Autism composite (adjusted R2=.25, p<.000) and Expressive Social Communication Abilities composite (adjusted R2=.22, p<.000). Beta weights indicated that the Autism composite was higher and the Social Discrepancy, Semantic/Pragmatic Language Discrepancy, and Expressive Social Communication Abilities composite scores were lower in the Abnormal ABR group. As four-month AMA slopes increased, the Autism composite increased and the Social Discrepancy, Semantic/Pragmatic Language Discrepancy, and Expressive Social Communication Abilities composite scores decreased. The predictor variables, combined, accounted for 18% to 36% of the variance.
The GMDS provided similar results for the Hearing and Speech DQ (adjusted R2=.19, p<.001), but not the Performance DQ (adjusted R2=.02), suggesting that these effects were restricted to measures of communication and not to visuo-spatial ability. Beta weights indicated that the Hearing and Speech DQ was lower in the Abnormal ABR group and as the AMA slopes increased, Hearing and Speech DQ decreased. GA did not affect the Hearing and Speech DQ. ABR group accounted for 7% of the variance in the Hearing and Speech DQ while 4-month AMA Slopes accounted for 6% of the variance. None of the predictors affected Performance DQ.
Figure 1 shows the relation between 4-month AMA Slopes, the Autism composite and the Social Discrepancy scores for each group (results were similar for the other PDDBI scores that assess some aspect of social communication). Open circles denote non-ASD cases and closed circles ASD cases. Fitted curves are based on a locally weighted scatter plot smoothing function (LOWESS) with a stiffness of 0.9. LOWESS curves for the Abnormal ABR group show a sharp discontinuity near an AMA Slope of 0.1, a “catastrophic” effect, while curves for the Normal ABR group are flat.
Figure 1.
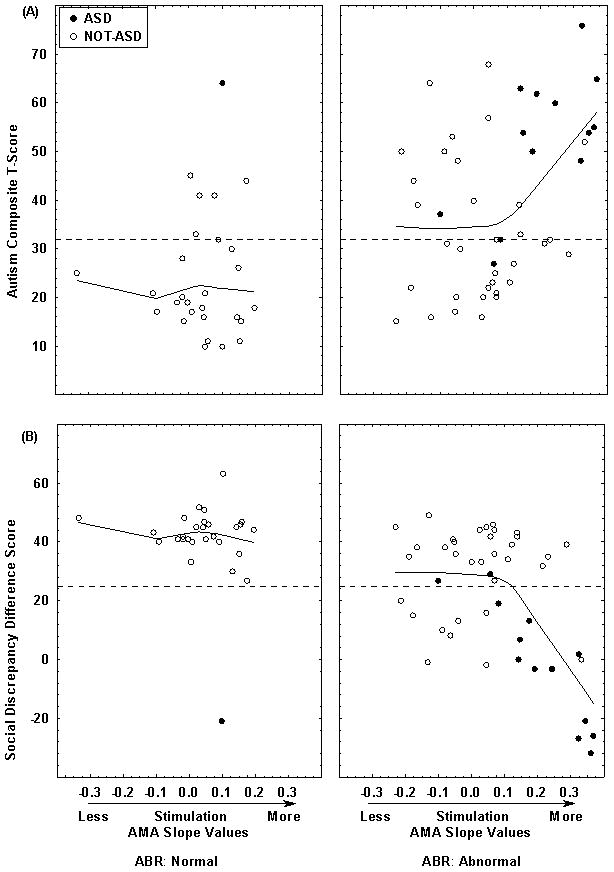
Shown are the PDDBI Autism Composite T-score (A) and Social Discrepancy difference score (B) versus individual AMA slope values at four months of age and ABR group. Filled circles are ASD cases and open circles are Not-ASD cases. Dotted lines along the ordinates indicate the cut-off scores that best discriminate ASD from non-ASD cases. Fitted curves are based on a LOWESS function with a stiffness of 0.9. Curves for the Abnormal ABR group show a discontinuity near an AMA Slope of 0.1.
Due to this non-linearity, we examined the relation between AMA slopes and PDDBI scores for the Abnormal ABR group with Piecewise Linear Regression (StatSoft, 2011), adopting a cut-off AMA slope of <=0.1. Models took the form:
where Y is the dependent variable, b0 is the intercept, b1 is the coefficient for AMA Slopes <=0.1 and b2 is the coefficient for AMA slopes >0.1. The b1 coefficients were not significant (all ps>0.4) indicating that the slopes of the functions for AMA slopes <=0.1 did not significantly differ from zero. However, T-scores for the b2 coefficients were significantly different from zero for the Autism composite, Expressive Social Communication Abilities composite, Social Discrepancy, and Semantic/Pragmatic Language Discrepancy scores at 3.75 (p<.001); −4.89 (p<.000); −5.32 (p<.000); and −3.87 (p<.000), respectively, indicating that past an AMA slope of 0.1, severity of behavior problems linearly increased as preference for higher rates of stimulation increased. R2 values ranged from 0.25 (Autism composite) to 0.40 (Social Discrepancy score).
Figure 2 shows the same effects for the GMDS Hearing and Speech and Performance DQs. As with the PDDBI, there was a discontinuity in the Hearing and Speech DQ for the Abnormal ABR group at an AMA slope of 0.1. Piecewise Linear Regression resulted in a non-significant b1 coefficient but a highly significant b2 coefficient (t=−4.13, p<.000). These results indicate that our findings were not unique to parental report but were also evident in direct assessment of communicative functioning.
Figure 2.
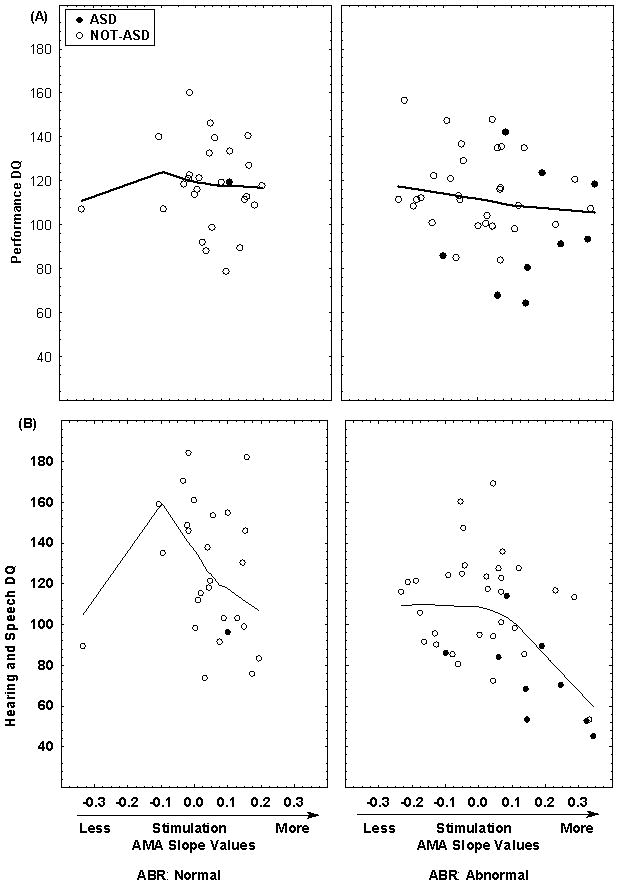
Shown are the Griffiths Performance (A) and Hearing and Speech (B) DQs versus the individual AMA slope values at four months of age and ABR group. Filled circles are ASD cases and open circles are Not-ASD cases. Fitted curves are based on a LOWESS function with a stiffness of 0.9. For Hearing and Speech, there is a sharp discontinuity near an AMA Slope of 0.1 for the Abnormal ABR group.
The above analyses were repeated excluding the five infants with short latency ABRs. The conclusions were unchanged, indicating that both ABR group and AMA slopes significantly influenced outcome.
Receiver-operating-characteristic (ROC) analysis for prediction of ASD in the Abnormal ABR group
Since 13 of 14 cases with ASD were in the Abnormal ABR group, ROC analysis was performed only on this sample using AMA slopes as a predictor and presence vs. absence of ASD diagnosis as the outcome. The area under the curve was 0.85 (95% CI: 0.71 – 0.98). Sensitivity was 77% and specificity was 88% using a cut-off AMA slope of 0.14, which maximized the difference between hit and false positive rates. Positive and negative predictive validities were 71% and 91%, respectively. The 0.1 AMA slope seen for the continuous measures yielded a sensitivity of 77% and specificity of 76%. Thus knowledge of AMA slope improved predictability of ASD well beyond the 28% level based on a priori knowledge of initial ABR results alone.
DISCUSSION
The current data indicate that the joint occurrence of very early problems in brainstem function and arousal regulation of attention is strongly associated with later diagnosis and severity of ASD; specifically to social and linguistic competence and not to visuo-spatial ability. These data extend earlier reports of the association of ASD with very early deficits in visual system function, namely in visual tracking by one month PTA and in arousal regulation of visual attention by four months PTA (Karmel et al., 2010). They demonstrate that these children likely experienced disorganization in brainstem-level function. This was not due to typically identified severe brain injury such as hydrocephalus or major intraventricular hemorrhage. The abnormal ABRs mainly occurred in infants in whom the evidence for structural insult was negative or very mild. Moreover, our findings related to later ASD are consistent with a recent report that preterm infants at four months PTA were quicker to gaze avert in a social interaction if their initial neonatal ABRs had been delayed, similar to that found for ASD here (Geva et al., 2011). Our data further extend our earlier findings by providing evidence that these effects were quantitatively linked. In infants with abnormal ABRs, the stronger the preference for more stimulation, the greater the severity of later-diagnosed ASD, providing evidence for abnormalities in subcortical function, both electrophysiological and behavioral. The quantitative nature of these effects lend support to the idea that a developmental series of cascading events resulting in catastrophic outcome on later development can be initiated early where the system becomes identified as dysfunctional but only when it reaches a threshold for disorganization, as manifested by arousal-related preference above a certain level for higher amounts of stimulation in the Abnormal ABR group. These findings are consistent with our hypothesis that multiple markers of disorganization in brainstem-level structures will be more likely to detect ASD given the extant evidence for atypical development of these structures.
Developmental immaturity at birth, per se, was not the determining factor as the influence of GA on outcome was greatly reduced once ABR results were taken into account; full-term infants were part of the Abnormal ABR group, and age at ABR test did not differ between groups. In neonates, atypical ABRs are highly associated with CNS insults typically identified with cranial ultrasonography (OR=11.2) (Karmel et al., 1988). However, while almost all ASD cases (13/14) were in the abnormal ABR group, they had no or only mild evidence of structural insult, and also had atypical AMA performance, the joint occurrence of which likely reflects evidence in ASD for abnormal brain development of attention, arousal, and reward systems (Coleman & Gilberg, 2012; Hashimoto et al., 1991).
Although alternative indicators of the brainstem-related problems in the Abnormal ABR group were not detectable by ultrasound, a number of studies have reported anatomical data consistent with atypical brainstem structure development in ASD (Bailey et al., 1998; Jou, Minshew, Melhem, Keshavan, & Hardan, 2009; Bauman & Kemper, 1985). As noted previously, Kulesza, et al. (2011) reported atypical development of the superior olive in all nine ASD autopsy cases. They speculated that the abnormalities they found are of prenatal origin and recommended ABR testing in neonates as a way of identifying children at risk for autism. It is of interest that all of the birth weights in their first table (eight cases) were low (mean = 1539 g; range 1375–1740 g), implying preterm birth. Our data suggest that while atypical ABRs alone increase the predictability of ASD, other putative measures of atypical brainstem development and their later effects on behavior, such as Arousal Modulated Attention, are necessary.
Delayed ABR latencies have been reported for some, but not all persons with ASD. Indeed, all but one of our cases with initially abnormal ABRs normalized before hospital discharge, and that case normalized by one month PTA. Considering that abnormal ABRs mostly are associated with abnormal structural findings, we speculate it is possible that initially early abnormal ABRs, even if resolved, indicate abnormal brainstem development to varying degrees leading to dysfunction in this brainstem pathway and its projections to other areas, and heterogeneous trajectories in outcomes with age. In our sample, ABR abnormalities were uniquely associated with later reports of the occurrence of repetitive and ritualistic behaviors suggesting that atypical brainstem development may in part be responsible for this aspect of autism spectrum disorder. It is of interest that in rats, lesions of the olivocochlear bundle are associated with increased motor activity and motor stereotypies (Hsieh et al., 1998).
The fact that both initially abnormal ABR findings and atypical visual preference were important for predicting later social and language competence as well as an autism diagnosis suggests more widespread CNS dysfunction emanating from the brainstem to mid- and higher-level structures, consistent with imaging studies (Schumann et al., 2010). It is possible that brainstem mechanisms may underlie later development through pathways thought to be involved in arousal and attention (e.g., reticular formation). Poor developmental outcome may be mediated by deviant arousal mechanisms arising from inadequate modulation of brainstem function, which in turn would produce deficits in developmental shifts in behavior after the neonatal period to higher levels that then underlie a sequence of events resulting in atypical outcome (Gardner, Karmel, & Flory, 2003) such as seen in autism (Karmel et al., 2010). Geva and Feldman (2008) also have proposed such a behavioral sequence in their “vertically integrative model” for the development of self-regulation and social development in infants, which is consistent with our data.
We hypothesize that this early brainstem dysfunction could disrupt both the posterior and anterior attention systems (Posner and Rothbart, 1994) that have been speculated to play a role in subsequent joint attention deficits in autism (Mundy, Sullivan, & Mastergeorge, 2009). The posterior attention system facilitates disengagement from a stimulus, likely by inhibiting subcortical controls (Mundy, Sullivan, & Mastergeorge, 2009), and may not be effectively suppressing residual subcortically-driven attention to higher rates of stimulation when less aroused in these children, i.e., they still are functioning, in some respects, at a lower brainstem level and not as much to differential effects of arousal and stimulation that should have developed by this time. Persistent attention to high rate visual stimuli also could indicate that their arousal preference “set point” is shifted such that a higher overall amount of stimulation is needed to reach an optimal level and/or that such stimuli have relatively increased reward value due to feedback from attaining their optimal level of stimulation.
In summary, our observations suggest that the combination of initially abnormal ABRs and increased fixation on higher rates of stimulation at four months of age in NICU graduates may be an endophenotype or marker of later ASD diagnosis. The sensitivity and specificity results were encouraging, especially since the ABR and AMA procedures are relatively inexpensive to implement, and can be performed fairly quickly (about 15 minutes each). We do not know, however, whether this combination of effects is specific to the NICU sample, to ASD, or to both. Further, our sample is relatively small, limiting generalization.
The development of biomarkers is a complex scientific and ethical challenge in a disorder as heterogeneous as autism. The interested reader is referred to Walsh, Elsabbagh, Bolton, & Singh (2011) for a detailed discussion of this issue. One of the important factors these authors raise is that the predictive validity of any experimentally-derived biomarker requires confirmation in large, unselected community-based population samples. Confirming our findings will require such replication in a larger prospective study, as well as any possible association with other groups of children who later display attention and arousal deficits, such as those with attention deficit hyperactivity disorder. As shown in Figures 1 and 2, there is a subgroup of children who were not diagnosed with ASD but who had abnormal ABRs, did not have atypical AMA slopes, and scored worse on the PDDBI and GMDS. We speculate that these may be the children who may be more likely to develop attention deficit disorder.
Acknowledgments
The authors are grateful to the parents and children who participated in this project.
This research was supported by funds from NYS Legislative Grant (Cohen), and NICHD grant #PO1-HD047281-04 (Gardner).
Footnotes
Conflict of Interest Disclosure
The PDDBI generates a royalty for Dr. Cohen. Drs. Gardner, Karmel, Phan, Kittler, Gomez, Gonzalez, Lennon, Parab and Barone report no financial interests or potential conflicts of interest.
Contributor Information
Ira L. Cohen, Department of Psychology, New York State Institute for Basic Research in Developmental Disabilities, 1050 Forest Hill Rd., Staten Island, NY 10314
Judith M. Gardner, Department of Infant Development, New York State Institute for Basic Research in Developmental Disabilities, 1050 Forest Hill Rd., Staten Island, NY 10314
Bernard Z. Karmel, Department of Infant Development, New York State Institute for Basic Research in Developmental Disabilities, 1050 Forest Hill Rd., Staten Island, NY 10314
Ha T.T. Phan, Department of Infant Development, New York State Institute for Basic Research in Developmental Disabilities, 1050 Forest Hill Rd., Staten Island, NY 10314
Phyllis Kittler, Department of Infant Development, New York State Institute for Basic Research in Developmental Disabilities, 1050 Forest Hill Rd., Staten Island, NY 10314.
Tina Rovito Gomez, Department of Psychology, New York State Institute for Basic Research in Developmental Disabilities, 1050 Forest Hill Rd., Staten Island, NY 10314.
Maripaz G. Gonzalez, Department of Psychology, New York State Institute for Basic Research in Developmental Disabilities, 1050 Forest Hill Rd., Staten Island, NY 10314
Elizabeth M. Lennon, Department of Infant Development, New York State Institute for Basic Research in Developmental Disabilities, 1050 Forest Hill Rd., Staten Island, NY 10314
Santosh Parab, Department of Neonatology, 355 Bard Ave., Richmond University Medical Center, Staten Island, NY 10310.
Anthony Barone, Department of Neonatology, 355 Bard Ave., Richmond University Medical Center, Staten Island, NY 10310.
References
- Amaral DG, Bauman MD, Schumann CM. The amygdala and autism: implications from non-human primate studies. Genes, Brain and Behavior. 2003;2:295–302. doi: 10.1034/j.1601-183x.2003.00043.x. [DOI] [PubMed] [Google Scholar]
- Baron-Cohen S, Ring HA, Bullmore ET, Wheelwright S, Ashwin C, Williams SC. The amygdala theory of autism. Neuroscience & Biobehavioral Reviews. 2000;24:355–364. doi: 10.1016/s0149-7634(00)00011-7. [DOI] [PubMed] [Google Scholar]
- Bailey A, Luthert P, Dean A, Harding B, Janota I, Montgomery M, et al. A clinicopathological study of autism. Brain. 1998;121 ( Pt 5):889–905. doi: 10.1093/brain/121.5.889. [DOI] [PubMed] [Google Scholar]
- Bauman M, Kemper TL. Histoanatomic observations of the brain in early infantile autism. Neurology. 1985;35:866–874. doi: 10.1212/wnl.35.6.866. [DOI] [PubMed] [Google Scholar]
- Ben-Yizhak N, Yirmiya N, Seidman I, Alon R, Lord C, Sigman M. Pragmatic language and school related linguistic abilities in siblings of children with autism. Journal of Autism and Developmental Disorders. 2011;41:750–760. doi: 10.1007/s10803-010-1096-6. [DOI] [PMC free article] [PubMed] [Google Scholar]
- Bosl W, Tierney A, Tager-Flusberg H, Nelson C. EEG complexity as a biomarker for autism spectrum disorder risk. BMC Medicine. 2011;9:18. doi: 10.1186/1741-7015-9-18. [DOI] [PMC free article] [PubMed] [Google Scholar]
- Cauda F, Geda E, Sacco K, D’Agata F, Duca S, Geminiani G, et al. Grey matter abnormality in autism spectrum disorder: an activation likelihood estimation meta-analysis study. Journal of Neurology, Neurosurgery, and Psychiatry. 2011;82:1304–1313. doi: 10.1136/jnnp.2010.239111. [DOI] [PubMed] [Google Scholar]
- Cohen IL, Gomez TR, Gonzalez MG, Lennon EM, Karmel BZ, Gardner JM. Parent PDD behavior inventory profiles of young children classified according to autism diagnostic observation schedule-generic and autism diagnostic interview-revised criteria. Journal of Autism and Developmental Disorders. 2010;40:246–254. doi: 10.1007/s10803-009-0863-8. [DOI] [PubMed] [Google Scholar]
- Cohen IL, Sudhalter V. PDD Behavior Inventory Professional Manual. Lutz, FL: Psychological Assessment Resources, Inc; 2005. [Google Scholar]
- Coleman M, Gilberg C. The Autisms. New York: Oxford University Press; 2012. [Google Scholar]
- DiMartino A, Kelly C, Grzadzinski R, Zuo XN, Mennes M, Mairena MA, et al. Aberrant striatal functional connectivity in children with autism. Biological Psychiatry. 2011;69:847–856. doi: 10.1016/j.biopsych.2010.10.029. [DOI] [PMC free article] [PubMed] [Google Scholar]
- Elsabbagh M, Volein A, Holmboe K, Tucker L, Csibra G, Baron-Cohen S, et al. Visual orienting in the early broader autism phenotype: disengagement and facilitation. Journal of Child Psychology and Psychiatry. 2009;50:637–642. doi: 10.1111/j.1469-7610.2008.02051.x. [DOI] [PMC free article] [PubMed] [Google Scholar]
- Elsabbagh M, Mercure E, Hudry K, Chandler S, Pasco G, Charman T, et al. Infant neural sensitivity to dynamic eye gaze is associated with later emerging autism. Current Biology. 2012;22:338–342. doi: 10.1016/j.cub.2011.12.056. [DOI] [PMC free article] [PubMed] [Google Scholar]
- Fatemi SH, Aldinger KA, Ashwood P, Bauman ML, Blaha CD, Blatt GJ, et al. Consensus paper: pathological role of the cerebellum in autism. Cerebellum. 2012 Feb 28; doi: 10.1007/s12311-012-0355-9. Epub ahead of print. [DOI] [PMC free article] [PubMed] [Google Scholar]
- Gardner JM, Karmel BZ. Development of arousal-modulated visual preferences in early infancy. Developmental Psychology. 1995;31:473–482. [Google Scholar]
- Gardner JM, Karmel BZ, Flory MJ. Arousal modulation of neonatal visual attention: Implications for development. In: Saroci S Jr, Murata-Soraci K, editors. Perspectives on fundamental processes in intellectual functioning, vol. 2. Visual information processing and individual differences. Westport, CT: Praeger; 2003. pp. 125–153. [Google Scholar]
- Gardner JM, Karmel BZ, Magnano CL. Arousal/visual preference interactions in high-risk neonates. Developmental Psychology. 1992;25:821–830. [Google Scholar]
- Gardner JM, Karmel BZ, Magnano CL, Norton KI, Brown EG. Neurobehavioral indicators of early brain insult in high risk neonates. Developmental Psychology. 1990;26:563–575. [Google Scholar]
- Geva R, Feldman R. A neurobiological model for the effects of early brainstem functioning on the development of behavior and emotion regulation in infants: implications for prenatal and perinatal risk. Journal of Child Psychology and Psychiatry. 2008;49:1031–1041. doi: 10.1111/j.1469-7610.2008.01918.x. [DOI] [PubMed] [Google Scholar]
- Geva R, Sopher K, Kurtzman L, Galili G, Feldman R, Kuint J. Neonatal brainstem dysfunction risks infant social engagement. Social Cognitive and Affective Neuroscence. 2011 Dec 5; doi: 10.1093/scan/nsr082. Epub ahead of print. [DOI] [PMC free article] [PubMed] [Google Scholar]
- Griffiths R. The Abilities of Young Children: A Comprehensive System of Mental Measurement for the First Eight Years of Life. Bucks, UK: A.R.I.C.D. The Test Agency Limited; 1984. Revised ed. [Google Scholar]
- Hashimoto T, Tayama M, Miyazaki M, Murakawa K, Sakurama N, Yoshimoto T, et al. Reduced midbrain and pons size in children with autism. Tokushima Journal of Experimental Medicine. 1991;38:15–18. [PubMed] [Google Scholar]
- Howard JS, Sparkman CR, Cohen HG, Green G, Stanislaw H. A comparison of intensive behavior analytic and eclectic treatments for young children with autism. Research in Developmental Disabilities. 2005;26:359–383. doi: 10.1016/j.ridd.2004.09.005. [DOI] [PubMed] [Google Scholar]
- Hsieh YL, Chen TJ, Lin CH, Chen SS. Effect of olivocochlear bundle lesion on locomotor activity in rats. Physiology and Behavior. 1998;64:179–84. doi: 10.1016/s0031-9384(98)00035-3. [DOI] [PubMed] [Google Scholar]
- Jou RJ, Minshew NJ, Melhem NM, Keshavan MS, Hardan AY. Brainstem volumetric alterations in children with autism. Psychological Medicine. 2009;39:1347–1354. doi: 10.1017/S0033291708004376. [DOI] [PMC free article] [PubMed] [Google Scholar]
- Karmel BZ, Gardner JM. Prenatal cocaine exposure effects on arousal-modulated attention during the neonatal period. Developmental Psychobiology. 1996;29:463–480. doi: 10.1002/(SICI)1098-2302(199607)29:5<463::AID-DEV5>3.0.CO;2-M. [DOI] [PubMed] [Google Scholar]
- Karmel BZ, Gardner JM, Meade LS, Cohen IL, London E, Flory MJ, et al. Early medical and behavioral characteristics of NICU infants later classified with ASD. Pediatrics. 2010;126:457–467. doi: 10.1542/peds.2009-2680. [DOI] [PMC free article] [PubMed] [Google Scholar]
- Karmel BZ, Gardner JM, Zappulla RA, Magnano CL, Brown EG. Brain-stem auditory evoked responses as indicators of early brain insult. Electroencephalography and Clinical Neurophysiology. 1988;71:429–442. doi: 10.1016/0168-5597(88)90047-0. [DOI] [PubMed] [Google Scholar]
- Kolevzon A, Gross R, Reichenberg A. Prenatal and perinatal risk factors for autism: a review and integration of findings. Archives of Pediatric and Adolescent Medicine. 2007;161:326–333. doi: 10.1001/archpedi.161.4.326. [DOI] [PubMed] [Google Scholar]
- Kulesza RJ, Jr, Lukose R, Stevens LV. Malformation of the human superior olive in autistic spectrum disorders. Brain Research. 2011;1367:360–371. doi: 10.1016/j.brainres.2010.10.015. [DOI] [PubMed] [Google Scholar]
- Lord C, Rutter M, Le CA. Autism Diagnostic Interview-Revised: a revised version of a diagnostic interview for caregivers of individuals with possible pervasive developmental disorders. Journal of Autism and Developmental Disorders. 1994;24:659–685. doi: 10.1007/BF02172145. [DOI] [PubMed] [Google Scholar]
- Maziade M, Merette C, Cayer M, Roy MA, Szatmari P, Cote R, et al. Prolongation of brainstem auditory-evoked responses in autistic probands and their unaffected relatives. Archives of General Psychiatry. 2000;57:1077–1083. doi: 10.1001/archpsyc.57.11.1077. [DOI] [PubMed] [Google Scholar]
- Mundy P, Sullivan L, Mastergeorge AM. A parallel and distributed-processing model of joint attention, social cognition and autism. Autism Research. 2009;2:2–21. doi: 10.1002/aur.61. [DOI] [PMC free article] [PubMed] [Google Scholar]
- Ozonoff S, Iosif AM, Baguio F, Cook IC, Hill MM, Hutman T, et al. A prospective study of the emergence of early behavioral signs of autism. Journal of the American Academy of Child and Adolescent Psychiatry. 2010;49:256–266. [PMC free article] [PubMed] [Google Scholar]
- Ozonoff S, Young GS, Steinfeld MB, Hill MM, Cook I, Hutman T, et al. How early do parent concerns predict later autism diagnosis? Journal of Developmental and Behavioral Pediatrics. 2009;30:367–375. doi: 10.1097/dbp.0b013e3181ba0fcf. [DOI] [PMC free article] [PubMed] [Google Scholar]
- Posner MI, Rothbart MK. Attention regulation: from mechanism to culture. In: Bertelson P, Eelon P, d’Ydewalle G, editors. International Perspectives on Psychological Science: Leading Themes. Sussex, UK: LEA; 1994. pp. 41–55. [Google Scholar]
- Rincover A, Newsom CD, Lovaas OI, Koegel RL. Some motivational properties of sensory stimulation in psychotic children. Journal of Experimental Child Psychology. 1977;24:312–323. doi: 10.1016/0022-0965(77)90009-1. [DOI] [PubMed] [Google Scholar]
- Rosenhall U, Nordin V, Brantberg K, Gillberg C. Autism and auditory brain stem responses. Ear and Hearing. 2003;24:206–214. doi: 10.1097/01.AUD.0000069326.11466.7E. [DOI] [PubMed] [Google Scholar]
- Roth DA, Muchnik C, Shabtai E, Hildesheimer M, Henkin Y. Evidence for atypical auditory brainstem responses in young children with suspected autism spectrum disorders. Developmental Medicine and Child Neurology. 2012;54:23–29. doi: 10.1111/j.1469-8749.2011.04149.x. [DOI] [PubMed] [Google Scholar]
- Sandberg AD, Nyden A, Gillberg C, Hjelmquist E. The cognitive profile in infantile autism--a study of 70 children and adolescents using the Griffiths Mental Development Scale. British Journal of Psychology. 1993;84 ( Pt 3):365–373. doi: 10.1111/j.2044-8295.1993.tb02488.x. [DOI] [PubMed] [Google Scholar]
- Schendel D, Bhasin TK. Birth weight and gestational age characteristics of children with autism, including a comparison with other developmental disabilities. Pediatrics. 2008;121:1155–1164. doi: 10.1542/peds.2007-1049. [DOI] [PubMed] [Google Scholar]
- Schumann CM, Bloss CS, Barnes CC, Wideman GM, Carper RA, Akshoomoff N, et al. Longitudinal magnetic resonance imaging study of cortical development through early childhood in autism. Journal of Neuroscience. 2010;30:4419–4427. doi: 10.1523/JNEUROSCI.5714-09.2010. [DOI] [PMC free article] [PubMed] [Google Scholar]
- StatSoft I. STATISTICA (data analysis software system). (Version 10) StatSoft, Inc; 2011. [Google Scholar]
- Stein L, Ozdamar O, Kraus N, Paton J. Follow-up of infants screened by auditory brainstem response in the neonatal intensive care unit. Journal of Pediatrics. 1983;103:447–453. doi: 10.1016/s0022-3476(83)80426-0. [DOI] [PubMed] [Google Scholar]
- Suzuki N, Suzumura H. Relation between predischarge auditory brainstem responses and clinical factors in high-risk infants. Pediatrics International. 2004;46:255–263. doi: 10.1111/j.1442-200x.2004.01897.x. [DOI] [PubMed] [Google Scholar]
- Tassone F, Pan R, Amiri K, Taylor AK, Hagerman PJ. A rapid polymerase chain reaction-based screening method for identification of all expanded alleles of the fragile X (FMR1) gene in newborn and high-risk populations. Journal of Molecular Diagnostics. 2008;10:43–49. doi: 10.2353/jmoldx.2008.070073. [DOI] [PMC free article] [PubMed] [Google Scholar]
- Virues-Ortega J. Applied behavior analytic intervention for autism in early childhood: meta-analysis, meta-regression and dose-response meta-analysis of multiple outcomes. Clinical Psychology Review. 2010;30:387–399. doi: 10.1016/j.cpr.2010.01.008. [DOI] [PubMed] [Google Scholar]
- Walsh P, Elsabbagh M, Bolton P, Singh I. In search of biomarkers for autism: scientific, social and ethical challenges. Nature Reviews Neuroscience. 2011;12:603–612. doi: 10.1038/nrn3113. [DOI] [PubMed] [Google Scholar]
- Wegiel J, Kuchna I, Nowicki K, Imaki H, Wegiel J, Marchi E, et al. The neuropathology of autism: defects of neurogenesis and neuronal migration, and dysplastic changes. Acta Neuropathologica. 2010;119:755–770. doi: 10.1007/s00401-010-0655-4. [DOI] [PMC free article] [PubMed] [Google Scholar]
- Wingate M, Mulivihill B, Kirby RS, Pettygrove S, Cunniff C, Meaney F, Schulz E, Miller L, Robinson C, Quintana G, Kaiser MY, Lee LC, Landa R, Newschaffer C, Constantion J, Fitzgerald R, Zahorodny W, Daniels J, Giarelli E, Pinto-Martin J, Levy SE, Nicholas J, Charles J, Zimmerman J, Maenner MJ, Durkin M, Rice C, Baio J, Van Narrden BK, Phillips K, Doernberg N, Yeargin-Allsopp M. Prevalence of autism spectrum disorders - Autism and Developmental Disabilities Monitoring Network, 14 sites, United States, 2008. Morbidity and Mortality Weekly Report Surveillance Summaries. 2012;61:1–19. [PubMed] [Google Scholar]
- Wolff JJ, Gu H, Gerig G, Elison JT, Styner M, Gouttard S, et al. Differences in white matter fiber tract development present from 6 to 24 months in infants with autism. American Journal of Psychiatry. 2012;169:589–600. doi: 10.1176/appi.ajp.2011.11091447. [DOI] [PMC free article] [PubMed] [Google Scholar]
- Zwaigenbaum L, Bryson S, Rogers T, Roberts W, Brian J, Szatmari P. Behavioral manifestations of autism in the first year of life. International Journal of Developmental Neuroscience. 2005;23:143–152. doi: 10.1016/j.ijdevneu.2004.05.001. [DOI] [PubMed] [Google Scholar]
- Zwaigenbaum L, Thurm A, Stone W, Baranek G, Bryson S, Iverson J, et al. Studying the emergence of autism spectrum disorders in high-risk infants: methodological and practical issues. Journal of Autism and Developmental Disorders. 2007;37:466–480. doi: 10.1007/s10803-006-0179-x. [DOI] [PubMed] [Google Scholar]