Abstract
Mitochondrial dysfunction is both a contributing mechanism and complication of diabetes, and oxidative stress contributes to that dysfunction. Mitochondrial manganese-superoxide dismutase (MnSOD) is a metalloenzyme that provides antioxidant protection. We have previously shown in a mouse model of hereditary iron overload that cytosolic iron levels affected mitochondrial manganese availability, MnSOD activity, and insulin secretion. We therefore sought to determine the metallation status of MnSOD in wild-type mice and whether altering that status affected β-cell function. 129/SvEVTac mice given supplemental manganese exhibited a 73% increase in hepatic MnSOD activity and increased metallation of MnSOD. To determine whether manganese supplementation offered glucose homeostasis under a situation of β-cell stress, we challenged C57BL/6J mice, which are more susceptible to diet-induced diabetes, with a high-fat diet for 12 weeks. Manganese was supplemented or not for the final 8 weeks on that diet, after which we examined glucose tolerance and the function of isolated islets. Liver mitochondria from manganese-injected C57BL/6J mice had similar increases in MnSOD activity (81%) and metallation as were seen in 129/SvEVTac mice. The manganese-treated group fed high fat had improved glucose tolerance (24% decrease in fasting glucose and 41% decrease in area under the glucose curve), comparable with mice on normal chow and increased serum insulin levels. Isolated islets from the manganese-treated group exhibited improved insulin secretion, decreased lipid peroxidation, and improved mitochondrial function. In conclusion, MnSOD metallation and activity can be augmented with manganese supplementation in normal mice on normal chow, and manganese treatment can increase insulin secretion to improve glucose tolerance under conditions of dietary stress.
Excess food intake and obesity are the largest risk factors for diabetes. Although total caloric intake is assumed to account for most of that risk, specific micronutrients also play a role. Dietary iron is one such factor, both in the heritable disease of iron overload, hemochromatosis (1, 2), and in common forms of type 2 diabetes (3, 4). We previously reported that β-cell function is impaired in a mouse model of hemochromatosis as well as in mice fed excess dietary iron (5, 6). Although iron is a prooxidant and is generally believed to cause cell damage directly through free radical generation, our studies of β-cell function in the mouse model of hemochromatosis also revealed a novel mechanism (7). In particular, excess iron competes for the entry of other transition metals such as manganese (Mn) into mitochondria, impairing, for example, the full metallation and activity of Mn-dependent mitochondrial superoxide dismutase (MnSOD). The β-cell function in that model could be partially rescued by supplementation of Mn (7).
In the course of those studies, we noted also that the level of MnSOD in Mn-supplemented mice with hemochromatosis exceeded even that of wild-type mice. We therefore hypothesized that even in wild-type mice under normal husbandry conditions, MnSOD metallation might not be optimized. We report herein that this is the case and that supplementing Mn increases metallation and activity of mitochondrial MnSOD. This results in protection from declining β-cell function and deterioration of glucose homeostasis when the mice are stressed by high-fat feeding. The results illustrate that glucose homeostasis, β-cell function, and the risk for development of diabetes can be significantly impacted by micronutrient levels that in mice, and likely humans, are not necessarily optimized for these functions.
Materials and Methods
Experimental animals
All procedures were approved by the Institutional Animal Care and Use Committee of the University of Utah. Mice were housed 3-5 animals per cage in an animal room on a 12-hour light, 12-hour dark cycle. Food was in the form of standard pellets, and food and water were provided ad libitum. 129/SvEVTac and C57BL/6J strains (6–9 months old) were used for the normal chow (TD-8640; Harlan Teklad, Madison, Wisconsin) experiments (n = 3–18 mice/group). Mice received daily ip injections of MnCl2 solution (4 mg/kg body weight) or saline for 7 days. Male C57BL/6J mice (3-4 months, n = 3–11 mice/group) were put on either normal or high-fat diets (45 kcal% fat, D12451; Research Diets, New Brunswick, New Jersey) for 4 weeks, at which time ip injections of MnCl2 solution (12 mg/kg body weight) or saline were begun for 8 weeks (5 times per week) on the same diet. Body weights were recorded weekly.
Intraperitoneal glucose tolerance test and insulin assay
Experimental animals were fasted for 6 hours, and glucose (1 g/kg body weight) was administered ip. Blood glucose levels were determined before and 5, 15, 30, 60, 90, and 120 minutes after glucose administration with tail vein blood (3 μL) (Glucometer Elite; Bayer Corp, Tarrytown, New York). Serum insulin levels were measured in tail vein blood (50 μL) before and 30 minutes after the start of the ip glucose tolerance test. A sensitive rat insulin kit (Linco Research, St Charles, Missouri) was used for the insulin assay. Homeostasis model assessments were calculated as described (8). The homeostasis model of β-cell function (HOMA-B), the β-cell function index, was calculated using the formula: HOMA-B = [insulin (microunits per milliliter)20]/[glucose (millimoles per liter) − 3.5] and homeostasis model assessment insulin resistance index (HOMA-IR), the insulin resistance index, was calculated using the formula: HOMA-IR = [glucose (millimoles per liter)insulin (microunits per milliliter)/22.5]. Both HOMA-B and HOMA-IR were calculated using fasting values.
Mitochondria isolation
Fresh mouse livers or islets handpicked under a microscope (see Isolation of pancreatic islets and measurement of glucose-induced insulin secretion below) were minced and homogenized at 4°C in 230 mM sucrose, 10 mM HEPES, 0.5 mM EGTA, and 0.1% BSA (pH 7.4) (10 mL/g tissue). The homogenates were centrifuged at 1000 × g for 10 minutes at 4°C to remove pellet nuclear fractions, and then the supernatants were further centrifuged at 12 000 × g for 10 minutes to obtain a crude mitochondrial pellet. Liver mitochondria pellets were washed with 250 mM sucrose and 10 mM HEPES (without EGTA and BSA), recentrifuged, and resuspended. A discontinuous Histodenz gradient (16% on 28%; Sigma, St Louis, Missouri) was used for isolation of pure liver mitochondria. Integrity of liver mitochondrial preparations was verified by the presence of oxidative phosphorylation II complex (succinate-Q oxidoreductase) (Molecular Probes, Eugene, Oregon) or glyceraldehyde-3-phosphate dehydrogenase (Santa Cruz Biotechnology, Santa Cruz, California) in mitochondrial or cytosol fractions, respectively (data not shown). The crude mitochondrial pellet from islets was suspended in PBS and 0.1% Triton X-100 and then sonicated at setting 3 for 10 1-second bursts (Brinkmann Sonic Dismembrator 60; Fisher Scientific, Pittsburgh, Pennsylvania). After centrifugation at 12 000 × g for 15 minutes, the supernatant was used to measure the MnSOD activity.
Superoxide dismutase (SOD) activity assay
Cu/ZnSOD (cytosolic SOD) and MnSOD (mitochondrial SOD) activities were discriminated by measurements in respective fractions. Each fraction was measured by using a superoxide dismutase assay kit according to the manufacturer's protocol (Cayman Chemical, Ann Arbor, Michigan). One unit of SOD is defined as the amount of enzyme needed to exhibit 50% dismutation of the superoxide radical.
Analysis of metal concentrations
Equal amounts of pure mitochondria were acid digested with metal free 10% nitric acid for 1 hour at 95°C (Optima; PerkinElmer, Boston, Massachusetts). As controls, blanks of nitric acid with buffer were processed in parallel. After cooling to room temperature, the digests were centrifuged at 12 000 × g for 20 minutes. Metal contents in supernatant were measured using inductively coupled plasma optical emission spectroscopy (ICP-OES, Optima 3100XL; PerkinElmer).
Chromatographic fractionation of mitochondrial proteins
Equal amounts of pure mitochondrial protein were fractionated by size exclusion (HR10/30 Superdex-200; Amersham Biosciences, Pittsburgh, Pennsylvania) in 20 mM Tris (pH 8.5) and 100 mM NaCl. All fractions were analyzed by ICP-OES (PerkinElmer) for metal content, and 150 μL aliquots were concentrated by speed vacuum for determination of MnSOD protein by immunoblotting.
Western blotting
Mitochondrial protein extracts or FPLC-purified mitochondrial fractions were electrophoresed through 4%–15% polyacrylamide gel (Bio-Rad, Hercules, California) and transferred onto polyvinylidene fluoride membrane (Millipore, Billerica, Massachusetts). After blocking with 5% nonfat dried milk, the membrane was probed with anti-MnSOD antibody (1:2000) (Upstate, Lake Placid, New York) or anti-adenine nucleotide translocase antibody (1:1000) (Molecular Probes) for control. Horseradish peroxidase-labeled antibodies (Invitrogen, Carlsbad, California) were used for visualization by enhanced chemiluminescence (Thermo Fisher Scientific Inc, Waltham, Massachusetts).
Isolation of pancreatic islets and measurement of glucose-induced insulin secretion
Pancreata were digested by Liberase RI (Roche, Indianapolis, Indiana) and injected through the bile duct, followed by water bath incubation for 12 minutes at 37°C. After vigorous shaking, single islets were handpicked under a microscope and placed into 96-well plate. Islets were preincubated for recovery culture in 2.8 mM glucose, KREB buffer (116.2 mM NaCl, 4.8 mM KCl, 1.2 mM KH2PO4, 1.2 mM MgSO47H2O, 2.2 mM CaCl2), 25 mM HEPES, and 0.1% BSA for 1 hour at 37°C. Islets were then rinsed, incubated in different glucose concentrations (2.8 mM, 8 mM, 16 mM) in KREB buffer with 25 mM HEPES and 0.1% BSA for 1 hour at 37°C. At the end of the experiment, islets were tested for maximum insulin secretion using 30 mM KCl-mediated depolarization. Each supernatant was collected from the plate and insulin levels measured using a sensitive rat insulin kit (Linco Research). Islets were then collected for protein assay for normalization. Results are the means of 3 replicates.
Lipid peroxidation
Lipid peroxidation was measured by absorbance of thiobarbituric acid reactive substances (TBARS). Malondialdehyde, formed from the breakdown of polyunsaturated fatty acids, produces TBARS with thiobarbituric acid (OXItek TBARS assay kit; Zeptometrix, Buffalo, New York).
Analysis of mitochondrial oxygen consumption in pancreatic islets
Real-time bioenergetics of islets cells (10 cells/well) was assayed by XF24 extracellular flux analyzer according to the manufacturer's protocol (Seahorse Bioscience, North Billerica, Massachusetts).
Statistical procedures
Data were analyzed using Microsoft Excel and GraphPad Prism 5 version 5.04 (GraphPad Software, Inc, San Diego, California). All measurements in this study are represented as mean ± SEM. The student t test (2 tail) was used to compare difference between saline-IP vs Mn-IP groups. Bivariate ANOVA (2 way ANOVA) was used to compare differences among more than 2 groups. Results were considered significant for P < .05.
Results
Mn supplementation increases liver MnSOD activity in wild-type mice
We have previously shown that cytosolic iron levels affect mitochondrial Mn availability and MnSOD activity in a mouse model of the hereditary iron overload disorder, hemochromatosis (7). To determine whether MnSOD is optimally metallated and whether Mn treatment can affect MnSOD activity in wild-type mice, we injected mice ip daily for 7 days with either saline or MnCl2. We initially analyzed the background strain of mice, 129/SvEvTac, that had been used in the earlier hemochromatosis study. MnSOD activity in mitochondria purified from liver increased 73% in mice injected with 4 mg/kg Mn compared with control saline-injected mice (P < .05, Figure 1A). However, the total level of MnSOD protein did not change (Figure 1B). Injection of MnCl2 up to 40 mg/kg led to no significant further increase in MnSOD activity over that seen with 4 mg/kg, and the injection of 2 mg/kg caused no significant increase, although there was a trend to do so (data not shown).
Figure 1.
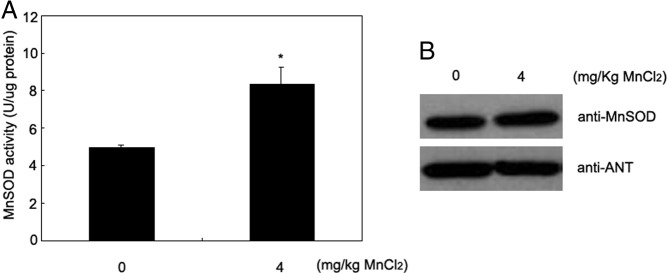
Manganese supplementation increases MnSOD activity in liver. A, Activity of mitochondrial MnSOD in liver was measured after ip injection of 4 mg/kg MnCl2 for 7 days in wild-type 129/SvEvTac mice on normal chow (n = 3 mice/group). B, Protein levels of MnSOD were measured by immunoblotting. Data were analyzed by the Student t test (2 tail). *P < .05. ANT, adenine nucleotide translocase.
Mn supplementation increases metallation of MnSOD protein
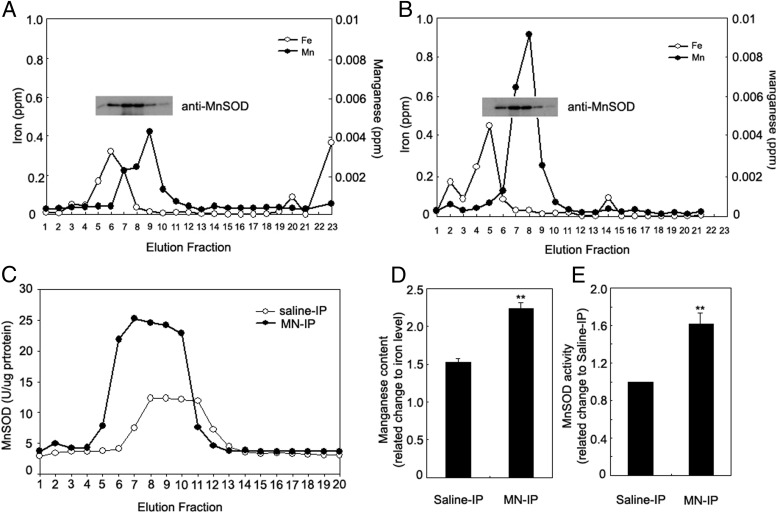
MnSOD requires metallation by Mn for activity. The increased MnSOD activity without increased apoprotein levels after Mn treatment led us to measure the degree of metallation of the protein. We injected wild-type mice (129/SvEvTac) with 4 mg/kg MnCl2 or saline ip daily for 7 days. Liver mitochondrial protein extracts were fractionated by size exclusion and fractions were analyzed for iron and Mn content by ICP-OES (PerkinElmer) and for MnSOD protein by immunoblotting, using liver mitochondria from saline-treated (Figure 2A) or Mn-treated (Figure 2B) mice. MnSOD activity was measured in the same fractions (Figure 2C). Mn content, measured by area under the curve and normalized with iron level, increased 47% (P < .01, Figure 2D) and MnSOD activity increased 60% (P < .01, Figure 2E) in Mn-treated mice compared with control mice.
Figure 2.
Metallation of MnSOD protein increases with Mn supplementation in mitochondria from livers of 129/SvEvTac mice. Equal amounts of crude mitochondrial protein extracts of liver from saline-injected (A) and 4 mg/kg Mn-injected mice (B) were fractionated by size exclusion column to isolate SOD protein. Manganese and iron content in each fraction was measured by ICP-OES (PerkinElmer). Immunoblotting was used to determine MnSOD protein content in each fraction. C, MnSOD activity was measured in each fraction from saline- or Mn-injected mouse liver mitochondria. D, Quantitative analysis of triplicate experiments of A and B. E, Quantitative analysis of triplicate experiments of C. Data were analyzed by the Student t test (2 tail), comparing the difference between saline-IP vs MN-IP groups. **P < .01.
No effect of Mn treatment on glucose tolerance in wild-type 129/SvEVTac mice on normal chow
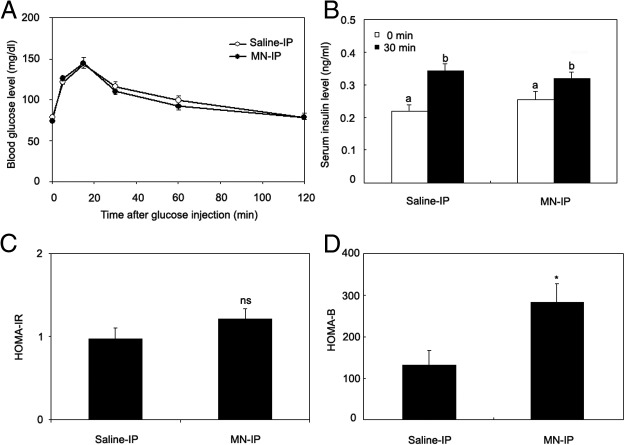
We injected wild-type (129/SvEvTac) mice with MnCl2 or saline for 7 days as in the study above and performed glucose tolerance testing after a 6-hour fast. No differences were seen between the saline-treated controls and the Mn-treated group in glucose tolerance (Figure 3A) or insulin levels before and 30 minutes after glucose challenge (Figure 3B). Insulin resistance assessed by the homeostasis model calculated from fasting glucose and insulin (HOMA-IR) also did not differ between the groups (Figure 3C). The HOMA-B, however, was increased in the Mn-treated group (2.3-fold increase, P < .05, Figure 3D).
Figure 3.
Manganese supplementation does not improve glucose tolerance but increases β-cell function in 129/SvEvTac mice on normal chow. Saline or Mn was administered to the mice for 7 days consecutively. A, Glucose (1 g/kg body weight) was injected ip and tail blood glucose levels were determined at the indicated times. B, Serum insulin levels were determined before and 30 minutes after glucose challenge. C, HOMA-IR. D, HOMA-B. A and B were analyzed by the bivariate ANOVA (2 way ANOVA). Different letters show statistical difference (P < .05). C and D were analyzed by the Student t test (2 tail), comparing difference between saline-IP vs MN-IP groups. * P < .01 (n = 15–18 mice/group).
Mn supplementation improves glucose tolerance and insulin secretion in C57BL/6J mice fed a high-fat diet
The aforementioned studies showing no change in glucose tolerance with the Mn treatment were performed using mice on normal chow and in a strain that is not highly prone to diabetes, namely circumstances wherein glucose tolerance is already near optimal in the controls. The improved HOMA-B with Mn treatment, however, suggested that if the studies were performed in a strain susceptible to diabetes and/or under dietary conditions dictating increased insulin demands, there might be a demonstrable effect of Mn on glucose homeostasis. We therefore fed the diabetes-prone C57BL/6J strain either normal chow or a high-fat diet. Of note, the high-fat diet contains 39% less Mn (80 mg/kg) compared with that of normal chow (130 mg/kg), suggesting any dietary Mn deficiency would be even more pronounced on the high-fat diet.
We first determined that Mn injections increased MnSOD activity in the C57BL/6J mice to a similar degree as was observed in the 129/SvEvTac mice (1.8-fold in both males and females, both P < .05, data not shown). Unlike the case for 129/SvEvTac mice, there was a trend toward an increase in MnSOD activity in mice injected with higher doses of MnCl2 compared with 4 mg/kg (11% further increase, P = NS, data not shown). We therefore chose a dose of 12 mg/kg for the subsequent studies in this strain. The mice were injected ip with 12 mg/kg MnCl2 or saline 5 d/wk for 8 weeks. The mice on high fat were on the diet for 4 weeks prior to initiating the Mn injections and remained on the diet for the subsequent 8 weeks of Mn treatment. We delayed initiating Mn supplementation because significant insulin resistance and increased insulin demand are not seen until after 4 weeks on high fat.
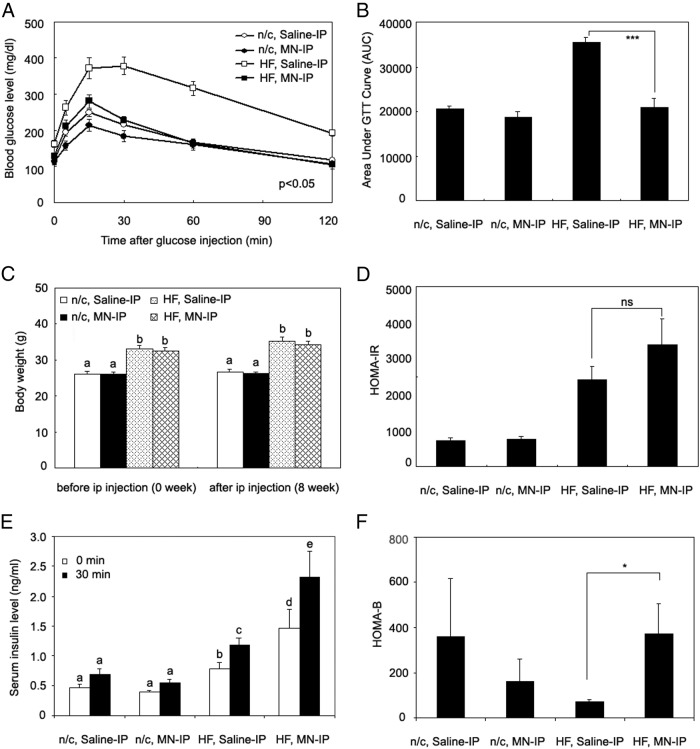
Results of glucose tolerance tests in these mice are shown in Figure 4A. In mice fed normal chow, there was a trend toward improved glucose tolerance in the Mn-treated mice, but the differences were not significant. In the high fat-fed group, however, Mn treatment resulted in highly significant improvements in both fasting and postchallenge glucose levels and overall area under the glucose curve compared with the saline-injected mice on high fat (Figure 4, A and B). Fasting blood glucose levels were 162 ± 7 mg/dL in high-fat diet controls versus 129 ± 10 mg/dL in the high-fat diet mice treated with Mn (P < .05, Figure 4A). Area under the glucose curve was reduced 41% in the Mn-treated group on a high-fat diet compared with the saline-treated group on a high-fat diet (P < .001, Figure 4B), and overall glucose tolerance was comparable with controls on normal chow. The changes were seen after 8 weeks of Mn treatment, although lesser effects on glucose tolerance were noted as early as 6 weeks (data not shown). The high-fat diet groups were heavier than the mice on normal chow (Figure 4C). Improved glucose tolerance in the Mn-treated group, however, was not due to differences in body weight (Figure 4C). We also noted no changes in body composition with Mn treatment, assessed by dual-energy x-ray absorptiometry scanning (data not shown). There were no differences in the food intake between the high-fat diet groups, as revealed by studies in metabolic chambers (HF, saline-IP group, 2.9 ± 0.14 g/24 h; HF, MN-IP group, 3.0 ± 0.12 g per 24 hours).
Figure 4.
Mn supplementation improves glucose tolerance and insulin secretion in a high-fat diet-induced diabetic model. High-fat or normal chow diets were given to age-matched C57BL/6J (3–4 months old) male mice for a month. Maintaining the same diet, saline or Mn was then administered ip for 8 weeks. A, Tail glucose levels were determined at the indicated times after the glucose challenge. B, Area under the glucose curve (AUC) of the glucose tolerance test was calculated. C, Body weights were determined of the mice on normal chow or the high-fat diet, saline or Mn treated. D, HOMA-IR. E, Serum insulin levels were determined before and 30 minutes after a glucose challenge. F, HOMA-B. A, C, and E were analyzed by the bivariate ANOVA (2 way ANOVA). Different letters show statistical differences (P < .05). B, D, and F were analyzed by the Student t test (2 tail), comparing the difference between saline-IP vs MN-IP groups. ***P < .001, *P < .05, 8–11 mice/group (n = 3–11 mice/group for insulin measurement). Values are represented as the mean ± SEM.
Additionally, leptin levels did not differ between saline- and Mn-treated groups, although leptin levels were higher in the high-fat diet groups (Supplemental Figure 1, published on The Endocrine Society's Journals Online web site at http://jcem.endojournals.org). HOMA-IR did not differ between the Mn- and saline-treated groups, on either diet (Figure 4D). There was no effect of Mn on insulin secretion or HOMA-B values in the mice on normal chow (Figure 4, E and F). In the high-fat diet group, however, plasma insulin levels 30 minutes after glucose challenge were 2-fold higher (P < .05, Figure 4E), and HOMA-B values were 4.5-fold higher (P < .05, Figure 4F) in the Mn-treated mice compared with saline-treated controls. C-peptide levels paralleled insulin levels (Supplemental Figure 2), suggesting that the increased insulin represents increased secretion than changes in clearance.
Mn supplementation increases insulin secretory capacity
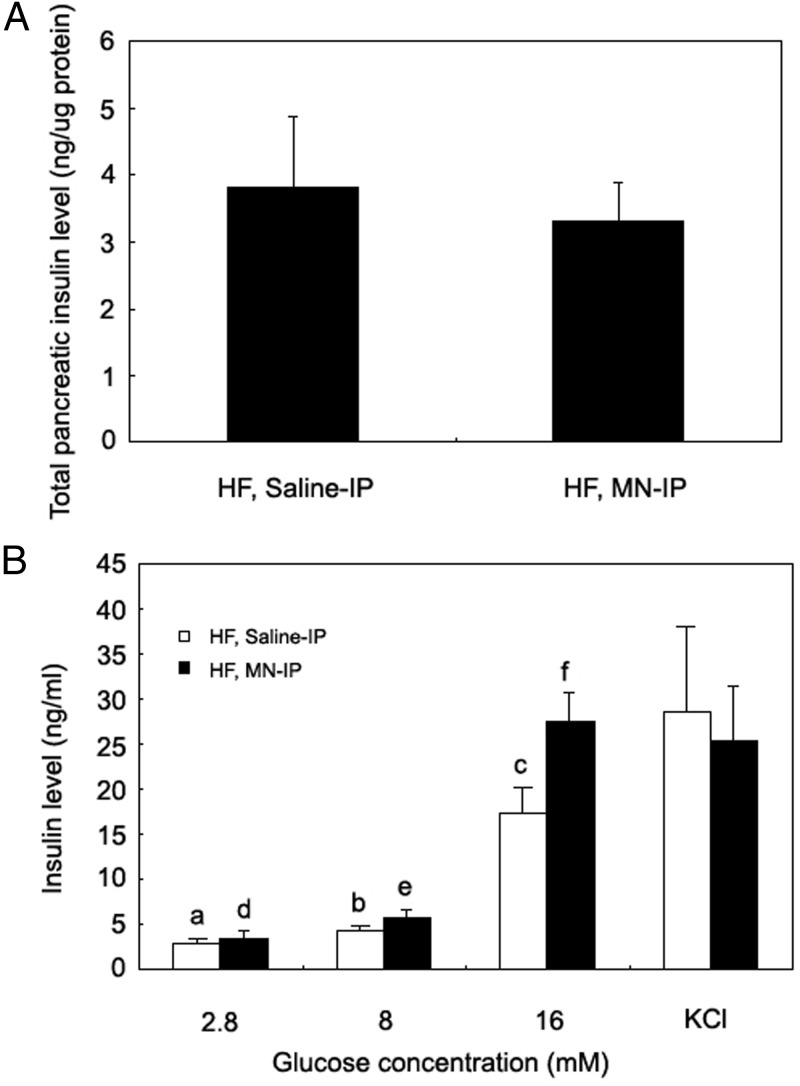
The studies described above show that Mn treatment of mice on a high-fat diet can improve glucose tolerance and insulin secretion. To determine the basis for the increased HOMA-B in the Mn-treated group, we measured total pancreatic insulin content, which did not differ between the Mn- or saline-treated mice on the high-fat diet (Figure 5A). We then studied isolated islets and determined insulin secretion after exposure to different concentrations of glucose (2.8, 8, and 16 mM) and a pharmacological secretagogue, KCl. At the highest glucose level (16 mM), islets from the Mn-treated, high-fat group secreted 59% more insulin than did the control group (P < .05, Figure 5B). Insulin secretion in response to KCl did not differ between the groups.
Figure 5.
Improved glucose tolerance with Mn supplementation is not due to increased insulin content in pancreas but increased glucose-stimulated insulin secretion. Whole pancreas tissue was homogenized and insulin levels measured, normalized to protein content (3 mice/group) (A). Isolated pancreatic islets were incubated with the indicated glucose concentrations for 1 hour and insulin content of the media measured (B). Panel A was analyzed by the Student t test (2 tail), comparing difference between saline-IP vs MN-IP groups. Panel B was analyzed by the bivariate ANOVA (2 way ANOVA). Differences in letters indicate statistically significant differences (P < .05) (n = 5 mice/group). Values are represented as the mean ± SEM.
Mn treatment increases hepatic Mn content and mitochondrial SOD activity in high-fat-fed mice
Due to the difficulty in obtaining sufficient purified mitochondria from islets, we used liver tissue of the high-fat-fed mice to examine metal levels in cytosolic and mitochondrial fractions. In the cytosolic fraction, Mn content increased 2.8-fold in Mn-treated mice on the high-fat diet (P < .001, Figure 6A). There were no significant changes in cytosolic copper, iron, or zinc, suggesting that Mn treatment did not have significant effects on total-body metal homeostasis. In the mitochondrial fractions, Mn content increased 1.7-fold (P < .05, Figure 6B) and MnSOD activity increased 2-fold (P < .05, Figure 6C) in Mn-treated mice on the high-fat diet compared with saline-treated controls, but cytosolic SOD (Cu/Zn SOD) activity did not change.
Figure 6.
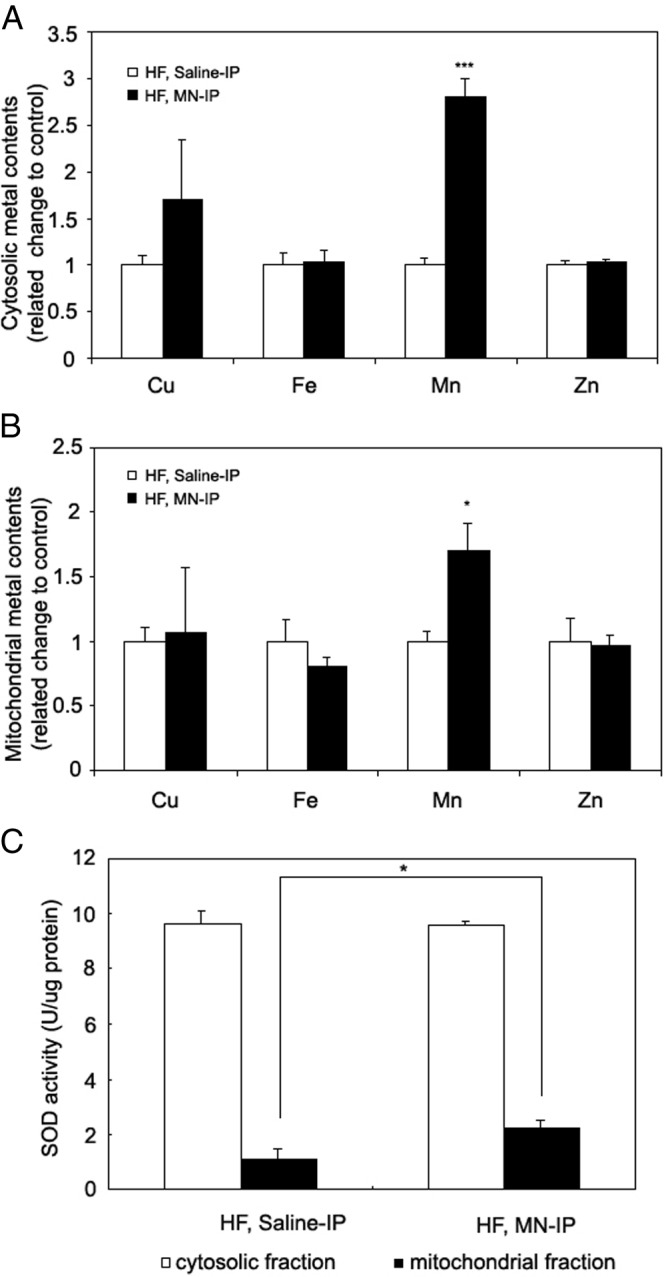
Increased Mn content and mitochondrial SOD activity in liver from Mn-treated mice. Liver cytosolic and mitochondrial preparations were isolated from saline- and Mn-treated mice on high-fat diets. Copper, iron, manganese, and zinc contents were measured in both cytosolic (A) and mitochondrial fractions (B). Manganese supplementation increases activity of mitochondrial MnSOD in Mn-treated mice compared with control mice without a change in cytosolic Cu/Zn SOD activity (C). Data were analyzed by the Student t test (2 tail), comparing the difference between saline-IP vs MN-IP groups. ***P < .001, *P < .05 (n = 4-5 mice/group). Values are represented as the mean ± SEM.
Mn treatment increases islet SOD activity and protects islets from high-fat diet-induced lipid peroxidation and loss of mitochondrial function
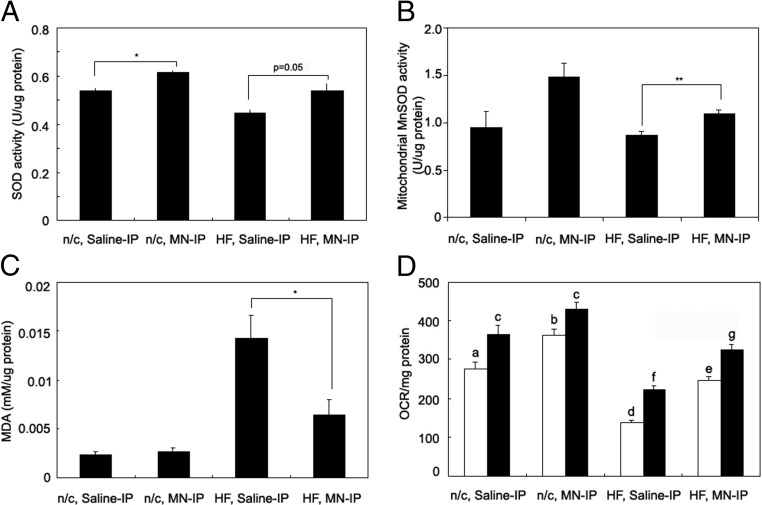
We next determined whether Mn was having similar effects on SOD in isolated pancreatic islets. We first measured total SOD activity in islet lysates. On normal chow, Mn-treated mice had higher SOD activity (14%, P < .05, Figure 7A) compared with saline-treated controls. Mn-treated mice on the high-fat diet trended toward an increase in SOD activity compared with control mice on high fat (21%, P = .05, Figure 7A). Because total SOD activity represents a combination of Cu/Zn-dependent cytosolic SOD, which would not be expected to change with Mn treatment, and mitochondrial MnSOD, we harvested islets from mice on normal chow or high-fat diets and assayed SOD in purified mitochondria (Figure 7B). Mitochondrial SOD, which exclusively represents MnSOD, trended toward an increase in the normal chow, Mn-treated groups (57%, P = .07) but increased significantly (26%, P = .01) in the high-fat group. Lipid peroxidation in islets was decreased 55% in the Mn-treated, high-fat diet group compared with the high-fat control group (P < .05, Figure 7C). Mn treatment resulted in significant increases in oxygen consumption rates of isolated islet, from mice on normal chow at low glucose (30%, P < .05, Figure 7D) but only a trend toward increase at high glucose (12%, Figure 7D). Compared with islets from the mice on normal chow, islets from the high-fat group had decreased oxygen consumption at both low and high glucose (P < .05, Figure 7C). For the mice on high-fat diets, Mn treatment also resulted in significant increases in oxygen consumption, both at low glucose (80%, P < .05, Figure 7D) and high glucose (46%, P < .05, Figure 7D), although Mn treatment did not fully restore oxygen consumption to the levels seen in the mice on normal chow.
Figure 7.
Mn supplementation increases SOD activity, reduces lipid peroxidation, and increases oxygen consumption rate in pancreatic islets. Pancreatic islets were isolated and SOD activity was measured in whole-islet extracts (A) and purified mitochondria (B). C, Lipid peroxidation levels were assessed in extracts of whole islets. D, Oxygen consumption rates were measured (n = 3/group). Data in panels A, C, and D were obtained from 3 mice/normal chow diet group and 5 mice/high-fat diet group. Data in panel B were from 10 mice per group but to facilitate mitochondrial isolation islets from 2–3 mice were pooled prior to isolation, with each pool being counted as 1 assay, hence 3-4 SOD assays per group. Mice in panel B were left on the high-fat diet for 5 weeks rather than the 8 weeks in the other panels. Panels A–C were analyzed by the Student t test (2 tail), comparing the difference between saline-IP vs MN-IP groups. ***P < .001; **P < .01; *P < .05. Panel D was analyzed by the bivariate ANOVA (2 way ANOVA). Values are represented as the mean ± SEM.
Discussion
Our results demonstrate that in wild-type mice on a normal laboratory diet, Mn levels are not sufficient to support maximal MnSOD activity (Figure 1A) and β-cell function (Figure 3D). Although this has little effect on glucose homeostasis in a nondiabetes prone strain of mice on normal chow (Figure 3A), the increased activity has significant effects on glucose homeostasis and β-cell function when insulin demands were increased in a diabetes-prone strain challenged with high-fat feeding (Figure 4). In Figure 4, Mn has no effect on total islet insulin or KCl-stimulated insulin secretion, suggesting that our results are not due to a Mn effect on insulin synthesis, packaging, or exocytosis. In addition, C-peptide levels increased in parallel with insulin after Mn treatment in the high-fat diet group, suggesting that Mn treatment had its effect on insulin secretion rather than insulin clearance. The fact that Mn affected only glucose-induced insulin secretion is consistent with an effect to enhance mitochondrial function (Figure 7) and therefore glucose metabolism.
MnSOD plays a critical role in protecting the mitochondria from free radicals normally generated during respiration by converting superoxide anions into hydrogen peroxide, which is detoxified into water by mitochondrial glutathione peroxidase (9). Mice homozygous for deletion of MnSOD (SOD2−/−) die shortly after birth due to dilated cardiomyopathy and lipid accumulation in liver and muscles (10). The heterozygous knockout mice (SOD2+/−) are viable and grossly normal despite a 50% reduction of MnSOD activity in all tissues. The mice do, however, exhibit alterations in mitochondrial function (11–13). Thus, the observed increases in mitochondrial MnSOD in both liver (Figure 6C) and islets and the 46%-80% increases in mitochondrial oxygen consumption with Mn treatment (Figure 7D), are likely to be significant in terms of improving both mitochondrial and overall islet function. Lu et al (14), for example, showed that a 1.4-fold decrease in oxygen consumption rate correlates with physiologically significant impairment of islet function. This conclusion is further supported by the decrease observed in markers of oxidant stress seen in the Mn-supplemented mice (Figure 7C). Additionally, of note, the diabetic phenotype of the MnSOD heterozygous knockout mice has not been reported (11–13), and our studies would suggest that there may be only a minimal or no phenotype in the absence of obesity of other dietary stressors that would increase insulin demand.
In our studies, we delivered Mn by injection. In pilot studies, targeting the same total daily dose in the drinking water did not result in changes in GTT, insulin levels, or MnSOD activity. Plausible explanations include that the slow, continuous delivery of lower concentrations of Mn may be more efficiently excreted or that a critical concentration is not reached wherein Mn-binding sites, on albumen, for example, are sufficiently saturated so as to allow free Mn to enter cells. We hypothesize that increasing Mn through dietary supplementation would likely require a longer period of time to achieve protective levels in cells than the 8 weeks of injection used in our studies.
Mitochondrial dysfunction has been implicated in a number of diseases including neurodegenerative diseases (15), cardiomyopathy (16), and diabetes (17–20). There is an extensive body of evidence that augmenting MnSOD activity to the degree achieved in this study would be beneficial in treating diabetes and its complications. Overexpression of MnSOD in mice protects islets from oxidative stress (21) and, in some models, cytokine-induced toxicity (22). Tissue-specific overexpression of MnSOD reduces diabetic complications such as cardiomyopathy (23) and nephropathy (24). In humans, the clearest evidence for the role of MnSOD in diabetes is provided by the effects of a polymorphism in the MnSOD sequence, Ala16Val, that impairs mitochondrial import of MnSOD and results in a 30%-40% decrease in MnSOD activity (25, 26). This polymorphism, and therefore this degree of decreased MnSOD activity, have been associated with increased risks for diabetic nephropathy, retinopathy, and type 2 diabetes itself (27–31). Interestingly, the magnitude of the effect of the MnSOD polymorphism is larger in subjects with hereditary hemochromatosis (32). This result is in accordance with our previous data in the mouse model of hemochromatosis, wherein high iron levels limit mitochondrial Mn transport and would therefore be expected to accentuate any underlying deficiency in MnSOD activity (7).
Metallation of MnSOD occurs in the mitochondria upon translocation of Mn and the SOD apoprotein from the cytosol, in which the protein is activated immediately after import (9, 33, 34). The identity of the Mn transporter into mitochondria is unknown, even in lower organisms. Our previous work in mice with hemochromatosis demonstrates interactions among Mn, iron, copper, and zinc levels in mitochondria, suggesting that the metals may be coregulated or cotransported. Deletion of Mrs3/4, the yeast homolog of the mammalian mitochondrial iron transporter mitoferrin, in an iron overload model causes an increase in the activity of the Mn-dependent SOD2, suggesting conserved mechanisms may be involved in balancing iron and Mn availability in the mitochondria (35).
Our observations point out the potential of Mn to be a limiting factor in antioxidant defenses. Variable levels of Mn and resulting suboptimal levels of MnSOD may therefore be an issue in experimental studies. Rodent chows vary from approximately 10 to 100 mg/kg in Mn content. Most culture media contain no Mn so that the metal is available only from serum, which contains approximately 10 nM (36) and will be present in variable amounts, depending on cell culture reagents and protocols. Mn requirements in mice have been studied by Hurley and Bell (37), who determined that diets with 45 mg/kg Mn are adequate for normal development. In humans, because of insufficient information on Mn requirements the Food and Nutrition Board of the Institute of Medicine has not set a recommended dietary allowance, instead setting an adequate intake level of 1.8-2.3 mg/d with the further recommendation not to exceed an intake level of 11 mg/d. The upper limit of intake was set because excessive ingestion or absorption such as occurs in miners or welders can lead to neurodegenerative diseases similar to Parkinson's (38, 39). Thus, optimal Mn intake levels are not known, and careful studies of the basic mechanisms involved in Mn balance, its interactions with other trace metals, and epidemiological studies are needed before safe manipulation of Mn levels and their effect on diabetes risk can be experimentally determined in humans.
Supplementary Material
Acknowledgments
This work was supported by the Research Service of the Veterans Administration, National Institutes of Health (Grants DK-081842, UL1-RR025764, and C06-RR11234), and the Robinson Family Foundation.
Disclosure Summary: The authors have nothing to disclose.
Footnotes
- HOMA-B
- homeostasis model of β-cell function
- HOMA-IR
- homeostasis model assessment insulin resistance index
- Mn
- manganese
- MnSOD
- Mn-dependent mitochondrial SOD
- SOD
- superoxide dismutase
- TBARS
- thiobarbituric acid reactive substances.
References
- 1. McClain DA, Abraham D, Rogers J, et al. High prevalence of abnormal glucose homeostasis secondary to decreased insulin secretion in individuals with hereditary haemochromatosis. Diabetologia. 2006;49(7):1661–1669 [DOI] [PubMed] [Google Scholar]
- 2. Hatunic M, Finucane FM, Brennan AM, Norris S, Pacini G, Nolan JJ. Effect of iron overload on glucose metabolism in patients with hereditary hemochromatosis. Metabolism. 2010;59(3):380–384 [DOI] [PubMed] [Google Scholar]
- 3. Facchini FS. Effect of phlebotomy on plasma glucose and insulin concentrations. Diabetes Care. 1998;21(12):2190. [PubMed] [Google Scholar]
- 4. Fernandez-Real JM, Penarroja G, Castro A, Garcia-Bragado F, Hernandez-Aguado I, Ricart W. Blood letting in high-ferritin type 2 diabetes: effects on insulin sensitivity and beta-cell function. Diabetes. 2002;51(4):1000–1004 [DOI] [PubMed] [Google Scholar]
- 5. Cooksey RC, Jouihan HA, Ajioka RS, et al. Oxidative stress, β-cell apoptosis, and decreased insulin secretory capacity in mouse models of hemochromatosis. Endocrinology. 2004;145(11):5305–5312 [DOI] [PubMed] [Google Scholar]
- 6. Cooksey RC, Jones D, Gabrielsen S, et al. Dietary iron restriction or iron chelation protects from diabetes and loss of β-cell function in the obese (ob/ob lep−/−) mouse. Am J Physiol Endocrinol Metab. 2010;298(6):E1236–E1243 [DOI] [PMC free article] [PubMed] [Google Scholar]
- 7. Jouihan HA, Cobine PA, Cooksey RC, et al. Iron-mediated inhibition of mitochondrial manganese uptake mediates mitochondrial dysfunction in a mouse model of hemochromatosis. Mol Med. 2008;14(3-4):98–108 [DOI] [PMC free article] [PubMed] [Google Scholar]
- 8. Matthews DR, Hosker JP, Rudenski AS, Naylor BA, Treacher DF, Turner RC. Homeostasis model assessment: insulin resistance and β-cell function from fasting plasma glucose and insulin concentrations in man. Diabetologia. 1985;28(7):412–419 [DOI] [PubMed] [Google Scholar]
- 9. Fridovich I. Superoxide radical and superoxide dismutases. Annu Rev Biochem. 1995;64:97–112 [DOI] [PubMed] [Google Scholar]
- 10. Li Y, Huang TT, Carlson EJ, et al. Dilated cardiomyopathy and neonatal lethality in mutant mice lacking manganese superoxide dismutase. Nat Genet. 1995;11(4):376–381 [DOI] [PubMed] [Google Scholar]
- 11. Van Remmen H, Salvador C, Yang H, Huang TT, Epstein CJ, Richardson A. Characterization of the antioxidant status of the heterozygous manganese superoxide dismutase knockout mouse. Arch Biochem Biophys. 1999;363(1):91–97 [DOI] [PubMed] [Google Scholar]
- 12. Kokoszka JE, Coskun P, Esposito LA, Wallace DC. Proc Natl Acad Sci USA Increased mitochondrial oxidative stress in the Sod2 (+/−) mouse results in the age-related decline of mitochondrial function culminating in increased apoptosis. 2001;98(5):2278–2283 [DOI] [PMC free article] [PubMed] [Google Scholar]
- 13. Williams MD, Van Remmen H, Conrad CC, Huang TT, Epstein CJ, Richardson A. Increased oxidative damage is correlated to altered mitochondrial function in heterozygous manganese superoxide dismutase knockout mice. J Biol Chem. 1998;273(43):28510–28515 [DOI] [PubMed] [Google Scholar]
- 14. Lu H, Koshkin V, Allister EM, Gyulkhandanyan AV, Wheeler MB. Molecular and metabolic evidence for mitochondrial defects associated with β-cell dysfunction in a mouse model of type 2 diabetes. Diabetes. 2010;59(2):448–459 [DOI] [PMC free article] [PubMed] [Google Scholar]
- 15. Orth M, Schapira AH. Mitochondria and degenerative disorders. Am J Med Genet. 2001;106(1):27–36 [DOI] [PubMed] [Google Scholar]
- 16. Marin-Garcia J, Goldenthal MJ. Mitochondria play a critical role in cardioprotection. J Card Fail. 2004;10(1):55–66 [DOI] [PubMed] [Google Scholar]
- 17. Kennedy ED, Maechler P, Wollheim CB. Effects of depletion of mitochondrial DNA in metabolism secretion coupling in INS-1 cells. Diabetes. 1998;47(3):374–380 [DOI] [PubMed] [Google Scholar]
- 18. Soejima A, Inoue K, Takai D, et al. Mitochondrial DNA is required for regulation of glucose-stimulated insulin secretion in a mouse pancreatic β cell line, MIN6. J Biol Chem. 1996;271(42):26194–26199 [DOI] [PubMed] [Google Scholar]
- 19. Lowell BB, Shulman GI. Mitochondrial dysfunction and type 2 diabetes. Science. 2005;307(5708):384–387 [DOI] [PubMed] [Google Scholar]
- 20. Maechler P, Wollheim CB. Mitochondrial function in normal and diabetic β-cells. Nature. 2001;414(6865):807–812 [DOI] [PubMed] [Google Scholar]
- 21. Chen H, Li X, Epstein PN. MnSOD and catalase transgenes demonstrate that protection of islets from oxidative stress does not alter cytokine toxicity. Diabetes. 2005;54(5):1437–1446 [DOI] [PubMed] [Google Scholar]
- 22. Hohmeier HE, Thigpen A, Tran VV, Davis R, Newgard CB. Stable expression of manganese superoxide dismutase (MnSOD) in insulinoma cells prevents IL-1β-induced cytotoxicity and reduces nitric oxide production. J Clin Invest. 1998;101(9):1811–1820 [DOI] [PMC free article] [PubMed] [Google Scholar]
- 23. Shen X, Zheng S, Metreveli NS, Epstein PN. Protection of cardiac mitochondria by overexpression of MnSOD reduces diabetic cardiomyopathy. Diabetes. 2006;55(3):798–805 [DOI] [PubMed] [Google Scholar]
- 24. Munusamy S, MacMillan-Crow LA. Mitochondrial superoxide plays a crucial role in the development of mitochondrial dysfunction during high glucose exposure in rat renal proximal tubular cells. Free Radic Biol Med. 2009;46(8):1149–1157 [DOI] [PubMed] [Google Scholar]
- 25. Shimoda-Matsubayashi S, Matsumine H, Kobayashi T, Nakagawa-Hattori Y, Shimizu Y, Mizuno Y. Structural dimorphism in the mitochondrial targeting sequence in the human manganese superoxide dismutase gene. A predictive evidence for conformational change to influence mitochondrial transport and a study of allelic association in Parkinson's disease. Biochem Biophys Res Commun. 1996;226(2):561–565 [DOI] [PubMed] [Google Scholar]
- 26. Sutton A, Imbert A, Igoudjil A, et al. The manganese superoxide dismutase Ala16Val dimorphism modulates both mitochondrial import and mRNA stability. Pharmacogenet Genomics. 2005;15(5):311–319 [DOI] [PubMed] [Google Scholar]
- 27. Mollsten A, Jorsal A, Lajer M, Vionnet N, Tarnow L. The V16A polymorphism in SOD2 is associated with increased risk of diabetic nephropathy and cardiovascular disease in type 1 diabetes. Diabetologia. 2009;52(12):2590–2593 [DOI] [PubMed] [Google Scholar]
- 28. Hovnik T, Dolzan V, Bratina NU, Podkraisek KT, Battelino T. Genetic polymorphisms in genes encoding antioxidant enzymes are associated with diabetic retinopathy in type 1 diabetes. Diabetes Care. 2009;32(12):2258–2262 [DOI] [PMC free article] [PubMed] [Google Scholar]
- 29. Kangas-Kontio T, Vavuli S, Kakko SJ, et al. Polymorphism of the manganese superoxide dismutase gene but not of vascular endothelial growth factor gene is a risk factor for diabetic retinopathy. Br J Ophthalmol. 2009;93(10):1401–1406 [DOI] [PubMed] [Google Scholar]
- 30. Liu L, Zheng T, Wang N, et al. The manganese superoxide dismutase Val16Ala polymorphism is associated with decreased risk of diabetic nephropathy in Chinese patients with type 2 diabetes. Mol Cell Biochem. 2009;322(1-2):87–91 [DOI] [PubMed] [Google Scholar]
- 31. Nakanishi S, Yamane K, Ohishi W, et al. Manganese superoxide dismutase Ala16Val polymorphism is associated with the development of type 2 diabetes in Japanese-Americans. Diabetes Res Clin Pract. 2008;81(3):381–385 [DOI] [PubMed] [Google Scholar]
- 32. Valenti L, Conte D, Piperno A, et al. The mitochondrial superoxide dismutase A16V polymorphism in the cardiomyopathy associated with hereditary haemochromatosis. J Med Genet. 2004;41(12):946–950 [DOI] [PMC free article] [PubMed] [Google Scholar]
- 33. Whittaker JW. The irony of manganese superoxide dismutase. Biochem Soc Trans. 2003;31(Pt6):1318–1321 [DOI] [PubMed] [Google Scholar]
- 34. Luk E, Yang M, Jensen LT, Bourbonnais Y, Culotta VC. Manganese activation of superoxide dismutase 2 in the mitochondria of Saccharomyces cerevisiae. J Biol Chem. 2005;280(24):22715–22720 [DOI] [PubMed] [Google Scholar]
- 35. Yang M, Cobine PA, Molik S, Naranuntarat A, Lill R, Winge DR, Culotta VC. The effects of mitochondrial iron homeostasis on cofactor specificity of superoxide dismutase 2. EMBO J. 2006;25(8):1775–1783 [DOI] [PMC free article] [PubMed] [Google Scholar]
- 36. Prohaska JR. Functions of trace elements in brain metabolism. Physiol Rev. 1987;67(3):858–901 [DOI] [PubMed] [Google Scholar]
- 37. Hurley LS, Bell LT. Genetic influence on response to dietary manganese deficiency in mice. J Nutr. 1974;104(1):133–137 [DOI] [PubMed] [Google Scholar]
- 38. Dobson AW, Erikson KM, Aschner M. Manganese neurotoxicity. Ann NY Acad Sci. 2004;1012:115–128 [DOI] [PubMed] [Google Scholar]
- 39. Guilarte TR. Manganese and Parkinson's disease: a critical review and new findings. Environ Health Perspect. 2010;118(8):1071–1080 [DOI] [PMC free article] [PubMed] [Google Scholar]
Associated Data
This section collects any data citations, data availability statements, or supplementary materials included in this article.


