Intravoxel incoherent motion can be applied for liver fibrosis detection with good image quality and acceptable reproducibility by using a respiratory-triggered bipolar diffusion-weighted sequence and has potential to enable users to distinguish between healthy subjects and patients with a fibrotic liver.
Abstract
Purpose:
To optimize intravoxel incoherent motion (IVIM) diffusion-weighted (DW) imaging by estimating the effects of diffusion gradient polarity and breathing acquisition scheme on image quality, signal-to-noise ratio (SNR), IVIM parameters, and parameter reproducibility, as well as to investigate the potential of IVIM in the detection of hepatic fibrosis.
Materials and Methods:
In this institutional review board–approved prospective study, 20 subjects (seven healthy volunteers, 13 patients with hepatitis C virus infection; 14 men, six women; mean age, 46 years) underwent IVIM DW imaging with four sequences: (a) respiratory-triggered (RT) bipolar (BP) sequence, (b) RT monopolar (MP) sequence, (c) free-breathing (FB) BP sequence, and (d) FB MP sequence. Image quality scores were assessed for all sequences. A biexponential analysis with the Bayesian method yielded true diffusion coefficient (D), pseudodiffusion coefficient (D*), and perfusion fraction (PF) in liver parenchyma. Mixed-model analysis of variance was used to compare image quality, SNR, IVIM parameters, and interexamination variability between the four sequences, as well as the ability to differentiate areas of liver fibrosis from normal liver tissue.
Results:
Image quality with RT sequences was superior to that with FB acquisitions (P = .02) and was not affected by gradient polarity. SNR did not vary significantly between sequences. IVIM parameter reproducibility was moderate to excellent for PF and D, while it was less reproducible for D*. PF and D were both significantly lower in patients with hepatitis C virus than in healthy volunteers with the RT BP sequence (PF = 13.5% ± 5.3 [standard deviation] vs 9.2% ± 2.5, P = .038; D = [1.16 ± 0.07] × 10−3 mm2/sec vs [1.03 ± 0.1] × 10−3 mm2/sec, P = .006).
Conclusion:
The RT BP DW imaging sequence had the best results in terms of image quality, reproducibility, and ability to discriminate between healthy and fibrotic liver with biexponential fitting.
© RSNA, 2012
Introduction
Intravoxel incoherent motion (IVIM) diffusion-weighted (DW) imaging models the diffusion-attenuated magnetic resonance (MR) imaging signal as a sum of static tissue molecular diffusion (D, true diffusion coefficient) and perfusion-related pseudodiffusion (perfusion fraction [PF], which reflects the fraction of flowing blood, and pseudodiffusion coefficient [D*], which reflects the velocity of capillary blood) (1). Thus, IVIM is a technique that can be used to investigate both diffusion and perfusion changes in tissues. In two pioneering studies, researchers have used IVIM to successfully detect liver cirrhosis. Luciani et al (2) used a respiratory-triggered (RT) acquisition with 10 b values and found that liver D* and apparent diffusion coefficient (ADC) were significantly decreased in patients with cirrhosis when compared with volunteers with a healthy liver. Subsequently, Patel et al (3) used nine b values to compare RT IVIM imaging with free-breathing (FB) IVIM imaging and found a significant decrease in liver D, PF, D*, and ADC in patients with cirrhosis when compared with subjects with a noncirrhotic liver. Despite these promising results, liver fibrosis quantification with IVIM still is hampered by low signal-to-noise ratio (SNR), high occurrence of artifacts, and complex modeling. The choice of FB versus RT is still debated for liver DW imaging in terms of image quality and parameter reproducibility (3,4). For example, Patel et al (3) found better reproducibility of IVIM parameters with RT DW imaging than with FB DW imaging, while Kwee et al (4) reported better ADC reproducibility with FB DW imaging than with RT DW imaging, albeit with a different technique (axial acquisition with coronal reformatting).
In most previous liver diffusion studies, researchers have used a twice-refocused bipolar (BP) diffusion preparation (5) that features intrinsic low eddy current artifacts. Because of the short T2 of the liver and the resulting low SNR, the diffusion-encoding gradients need to be played in the shortest possible echo time. The single refocusing pulse of the Stejskal-Tanner monopolar (MP) scheme enables better echo time minimization. However, unbalanced MP gradients are known to generate stronger eddy current–induced distortions at high b values, and these effects need to be investigated in the liver in view of recent advances in eddy current compensation.
The purpose of this study was to optimize IVIM DW imaging by estimating the effects of diffusion gradient polarity and breathing acquisition scheme on image quality, SNR, IVIM parameters, and IVIM parameter reproducibility, as well as to investigate the potential of IVIM in the detection of hepatic fibrosis.
Materials and Methods
Patients and Volunteers
This Health Insurance Portability and Accountability Act compliant single-center prospective study was funded by the National Institute of Diabetes and Digestive and Kidney Diseases and approved by the Mount Sinai School of Medicine institutional review board. Informed signed consent was obtained from all subjects. A prototype diffusion sequence (511C) developed by Siemens MRI Research Group (A.d.O., T. F.) was used to acquire data. We obtained this sequence through a master research agreement with Siemens. All data and protocol information were controlled by the study investigators who were not employees or consultants of Siemens (H.A.D., N.G., T.N., M.I.F., D.C., E.W., M.O., M.L.V., J.S.B., B.T.).
Seven healthy volunteers (mean age, 26 years; age range, 23–29 years; five men [mean age, 26 years; age range, 23–28 years], two women [mean age, 27.5 years; age range, 26–29 years]) and 13 patients with chronic hepatitis C virus (HCV) infection (mean age, 55 years; age range, 45–67 years; nine men [mean age, 56 years; age range, 45–67 years], four women [mean age, 53 years; age range, 52–55 years) were enrolled in the study from October 2010 to November 2011 at Mount Sinai School of Medicine. Because of volunteer recruitment response, subjects in the healthy group were significantly younger than subjects in the HCV group (P = .001). Sex distribution was not significantly different between the two groups. Inclusion criteria for healthy volunteers were as follows: no history of liver disease or alcohol abuse and normal liver function tests. Inclusion criteria for patients were as follows: treatment-naïve HCV infection, with concomitant liver biopsy performed within 3 months of MR imaging. All subjects were enrolled in the study. Among the study pool, 10 subjects (six healthy volunteers, four patients with HCV infection) returned for repeat MR imaging to assess interexamination reproducibility of the IVIM technique. The average delay between examinations was 13 days (range, 5–45 days).
IVIM DW Imaging
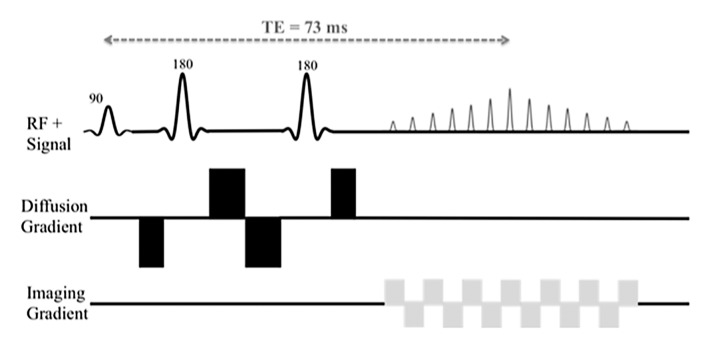
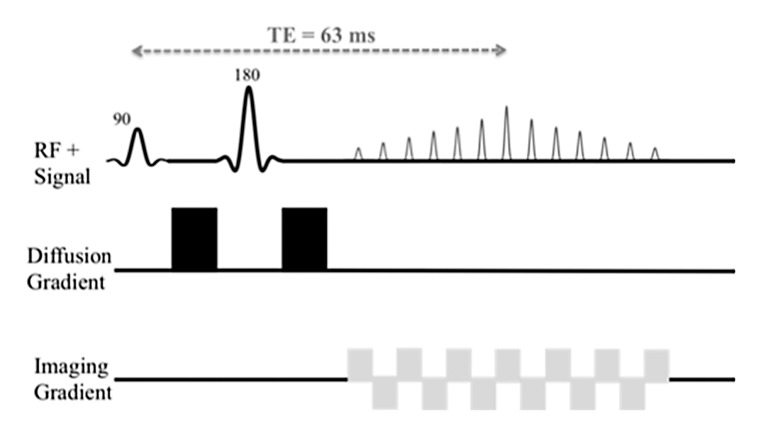
All data were acquired with a 1.5-T Magnetom Avanto imager (Siemens Healthcare, Erlangen, Germany) with a multichannel spine and body matrix coil and 45 mT/m maximum gradient strength. Sixteen b values (0, 15, 30, 45, 60, 75, 90, 105, 120, 135, 150, 175, 200, 400, 600, and 800 sec/mm2) were acquired with either MP or BP diffusion-encoding schemes (Fig 1), FB or RT acquisition, and a navigator (2D PACE; Siemens Healthcare) (6,7). Four DW sequences were performed (RT BP, RT MP, FB BP, and FB MP sequences), in which parameters were kept the same, except for gradient polarity and breathing acquisition scheme. The distribution of b values was chosen to cover both the initial pseudodiffusion decay (b < 200 sec/mm2) and the molecular diffusion decay (b ≥ 200 sec/mm2). We used a larger number of lower b values in our study in comparison with previous studies (2,3) to try to improve accuracy of PF and D* fitting. Each b value was sampled in three orthogonal diffusion directions (with the exception of a b value of 0 sec/mm2, which was sampled only once in the absence of diffusion gradients) and then combined to yield an approximation of the mean diffusivity by using a three-pass trace (8), assuming diffusion in the liver is not anisotropic (9). Mean acquisition was calculated twice. Coronal orientation was chosen to match the coronal perfusion-weighed imaging sequence performed in patients with HCV (not reported in this study). IVIM acquisition was performed prior to contrast material injection in patients with HCV. Seventeen sections were sampled in an interleaved fashion by using single-shot echo-planar imaging readout with spectral fat saturation (spectral selection attenuated inversion recovery, or SPAIR). We used parallel imaging with an acceleration factor of two (generalized autocalibrating partially parallel acquisition, with 24 reference lines), partial Fourier factor 6/8, and receiver bandwidth of 1202 Hz/pixel. The corresponding echo times were 73 msec (BP) and 63 msec (MP) for our specific protocol, and repetition time was one respiratory cycle (RT) or 3000 msec (FB). Matrix size was 160 × 128; field of view, 370 × 370 mm; and voxel size, 2.3 × 2.9 × 8 mm. Total acquisition time was 4 minutes 45 seconds (FB) or 7 minutes 55 seconds (RT). For RT acquisitions, a 5-mm-thick coronal navigator section was placed on the liver dome to synchronize the acquisition with patient respiration at end expiration, with an acceptance window of 2 mm. An image-based dynamic distortion correction algorithm was used for both the MP scheme and the BP scheme to correct for eddy current–induced artifacts, which occur at high b values. The algorithm, developed by the Siemens MR research group and similar to previously published algorithms (10), uses a nonaffine two-dimensional transformation and registers all images acquired with a b value larger than 50 sec/mm2 to corresponding undistorted reference images comprising negligible diffusion weighting.
Figure 1a:
Schematic sequence diagrams show diffusion preparation followed by single-shot echo-planar imaging readout. RF = radiofrequency, TE = echo time. (a) When using BP diffusion encoding, a minimum echo time of 73 msec is required. (b) When using MP diffusion encoding, an echo time as low as 63 msec can be reached. Echo time depends on the protocol (eg, on maximum b value and imaging parameters). A navigator can be added for the RT sequence.
Figure 1b:
Schematic sequence diagrams show diffusion preparation followed by single-shot echo-planar imaging readout. RF = radiofrequency, TE = echo time. (a) When using BP diffusion encoding, a minimum echo time of 73 msec is required. (b) When using MP diffusion encoding, an echo time as low as 63 msec can be reached. Echo time depends on the protocol (eg, on maximum b value and imaging parameters). A navigator can be added for the RT sequence.
Image Analysis
Qualitative analysis.—Two radiologists (B.T., N.G., 8 years and 1 year of experience, respectively, in body MR imaging) analyzed image quality (Matlab, R2011b; Mathworks, Natick, Mass) of a set of four representative b value images (b = 0, 200, 400, and 800 sec/mm2) for the four DW sequences. The observers were blinded to sequence type (MP vs BP, RT vs FB), and they analyzed the images in a random order. Quality scores were given on a three-point scale for liver edge delineation (1, poorly delineated; 2, moderately delineated; 3, well delineated), ghosting (1, major ghosting; 2, moderate ghosting; 3, minimal or no visible ghosting), and distortion (1, major distortion; 2, moderate distortion; 3, minimal or no visible distortion). The maximum score per sequence (including four b values) was 36. An example of a DW image acquired with a b value of 200 sec/mm2 is shown in Figure 2 for all four sequences.
Figure 2:

DW images acquired with the A, RT BP sequence; B, RT MP sequence; C, FB BP sequence; and D, FB MP sequence and a b value of 200 sec/mm2 in a 27-year-old healthy man. Blurring due to motion is visible at the liver dome on C and D (arrow).
Quantitative analysis.—Another observer (H.D., an MR physicist with 1 year of postdoctoral experience) performed quantitative analysis of IVIM images with locally developed software (Matlab graphical user interface). Ten freehand regions of interest (ROIs) measuring 8–10 cm2 were drawn by hand in the right hepatic lobe on five consecutive sections centered on the portal vein bifurcation to measure mean liver signal intensity (SI). The left lobe was not used because of cardiac motion artifacts, which potentially can alter diffusion measurement (11). Care was taken to avoid large vessels, blurred regions, and any focal lesions. The same ROI mask was propagated to all b values. The mean ROI SI was then fitted to the IVIM equation (1), which models the SI decay with increasing b values as a fast pseudodiffusion of constant D* for the extravascular water fraction PF and a slow molecular diffusion constant D for the nonflowing spins:
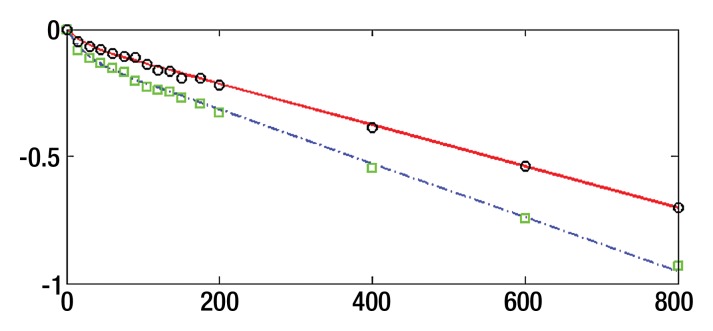
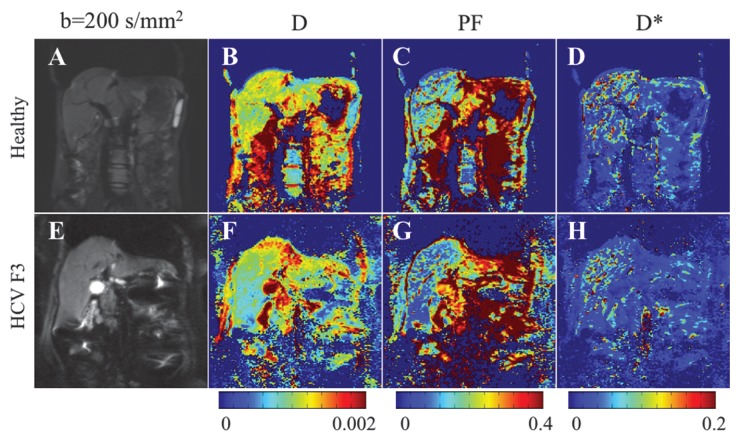
where SI0 is SI in the absence of diffusion weighting (b = 0 sec/mm2). While Luciani et al (2) used ROIs defined on parametric maps, we chose to use native images, similar to Patel et al (3), to ensure higher SNR by calculating average noise for many voxels (12). Moreover, the diffuse nature of liver fibrosis is compatible with a large ROI approach. Because the accuracy of IVIM parameters strongly depends on image quality and SNR, the analysis needs a robust fitting method. Bayesian methods have been shown to yield IVIM parameters with more stability and better accuracy than those obtained with least squares optimization, especially for D* (13,14). Rather than calculating and minimizing an error residual, the Bayesian method yields estimates of the uncertainty of each parameter in the model and uses prior distributions on PF, D*, and D to determine the joint posterior probability over all parameters, given a set of measured b value samples. Unlike the least-squares fitting algorithm, which measures goodness of fit with a global root mean square error, the Bayesian method provides a way to assess the probability density function (PDF) of each parameter separately, with a narrow PDF indicating a well-resolved parameter value. We used a Bayesian method, developed with the aforementioned Mathworks software, to estimate the IVIM parameters from the set of 16 sampled b values. Final parameter values were then obtained via integration over the PDF of each parameter to yield the mean PDF value. Prior distributions were noninformative (flat PDFs) for PF and SI0 and minimally informative for D and D*; this implies that the final parameter estimates are dominated by the data rather than by the prior distributions. An example of the parameter PDFs obtained with the Bayesian method is shown in Figure 3. As an illustration of the spatial distribution of IVIM parameters, parametric maps (Fig 4) were computed for PF, D, and D* for a healthy volunteer and a patient with HCV by applying the Bayesian fitting method at every pixel with the aforementioned Mathworks software.
Figure 3a:
Bayesian analysis of IVIM DW imaging performed with the RT BP sequence in a 26-year-old healthy woman and a 55-year-old woman with HCV infection and METAVIR stage F3 fibrosis. (a) Graph shows logarithmic SI decay with 16 b values in the healthy volunteer (□) and the patient with HCV (○). For display purposes, data were normalized to an intensity of b = 0 sec/mm2. Solid (patient) and dashed (volunteer) lines are biexponential model curves obtained by using Bayesian-estimated IVIM parameters. Calculated values were as follows: for D, 0.81 × 10⁻³ mm2/sec and 1.06 × 10⁻³ mm2/sec for the patient with HCV and the healthy volunteer, respectively; for PF, 5.1% and 9.8%, respectively; and for D*, 50.5 × 10⁻³ mm2/sec and 49.4 × 10⁻³ mm2/sec, respectively. (b–d) PDF (measured in arbitrary units, normalized for display purposes) derived from Bayesian analysis for PF (b), D (c), and D* (d) for the same two subjects (patient, solid line; volunteer, dashed line). PF and D have narrow and distinct PDFs, which enable good differentiation between the two subjects. D* has overlapping PDFs, which means higher uncertainty for this parameter, and no ability to aid in discrimination between the healthy volunteer and the patient with HCV.
Figure 4:
Parametric IVIM diffusion maps obtained with the RT BP sequence and a Bayesian fitting technique in the same subjects as in Figure 3. A, E, Coronal single-shot echo-planar image DW image (b = 200 sec/mm2). B, F, D map. C, G, PF map. D, H, D* map. Corresponding parameter values derived from ROI analysis are given in Figure 3. D and PF maps show lower values in the patient with HCV than in the healthy subject. There is no visible difference in D* maps.
Figure 3b:
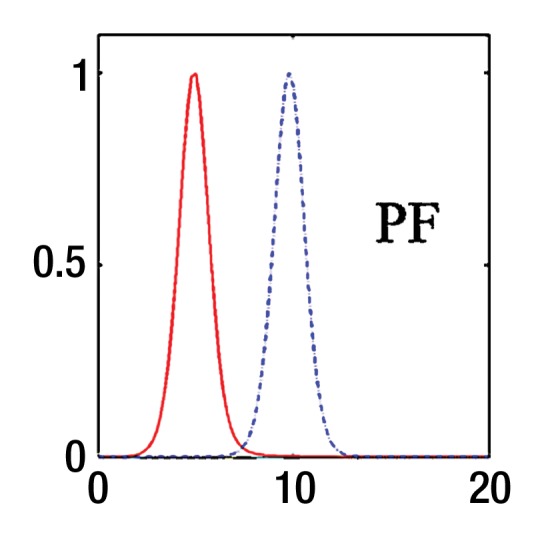
Bayesian analysis of IVIM DW imaging performed with the RT BP sequence in a 26-year-old healthy woman and a 55-year-old woman with HCV infection and METAVIR stage F3 fibrosis. (a) Graph shows logarithmic SI decay with 16 b values in the healthy volunteer (□) and the patient with HCV (○). For display purposes, data were normalized to an intensity of b = 0 sec/mm2. Solid (patient) and dashed (volunteer) lines are biexponential model curves obtained by using Bayesian-estimated IVIM parameters. Calculated values were as follows: for D, 0.81 × 10⁻³ mm2/sec and 1.06 × 10⁻³ mm2/sec for the patient with HCV and the healthy volunteer, respectively; for PF, 5.1% and 9.8%, respectively; and for D*, 50.5 × 10⁻³ mm2/sec and 49.4 × 10⁻³ mm2/sec, respectively. (b–d) PDF (measured in arbitrary units, normalized for display purposes) derived from Bayesian analysis for PF (b), D (c), and D* (d) for the same two subjects (patient, solid line; volunteer, dashed line). PF and D have narrow and distinct PDFs, which enable good differentiation between the two subjects. D* has overlapping PDFs, which means higher uncertainty for this parameter, and no ability to aid in discrimination between the healthy volunteer and the patient with HCV.
Figure 3c:
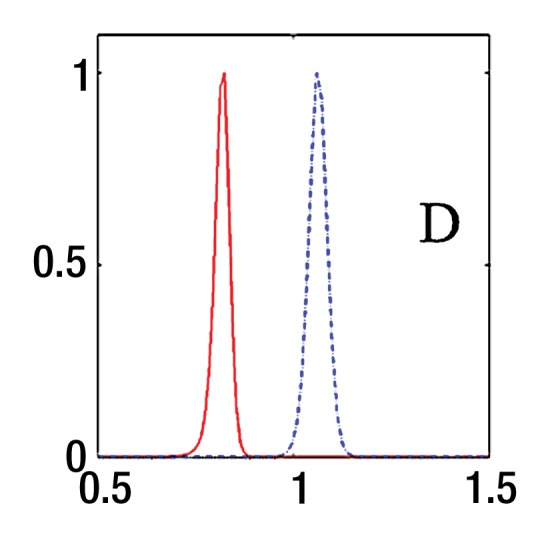
Bayesian analysis of IVIM DW imaging performed with the RT BP sequence in a 26-year-old healthy woman and a 55-year-old woman with HCV infection and METAVIR stage F3 fibrosis. (a) Graph shows logarithmic SI decay with 16 b values in the healthy volunteer (□) and the patient with HCV (○). For display purposes, data were normalized to an intensity of b = 0 sec/mm2. Solid (patient) and dashed (volunteer) lines are biexponential model curves obtained by using Bayesian-estimated IVIM parameters. Calculated values were as follows: for D, 0.81 × 10⁻³ mm2/sec and 1.06 × 10⁻³ mm2/sec for the patient with HCV and the healthy volunteer, respectively; for PF, 5.1% and 9.8%, respectively; and for D*, 50.5 × 10⁻³ mm2/sec and 49.4 × 10⁻³ mm2/sec, respectively. (b–d) PDF (measured in arbitrary units, normalized for display purposes) derived from Bayesian analysis for PF (b), D (c), and D* (d) for the same two subjects (patient, solid line; volunteer, dashed line). PF and D have narrow and distinct PDFs, which enable good differentiation between the two subjects. D* has overlapping PDFs, which means higher uncertainty for this parameter, and no ability to aid in discrimination between the healthy volunteer and the patient with HCV.
Figure 3d:
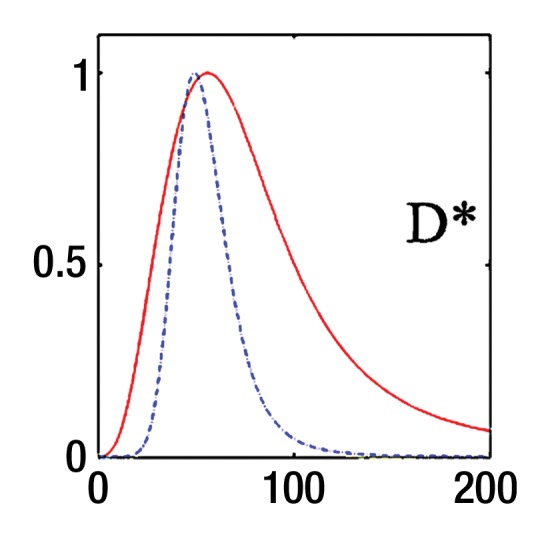
Bayesian analysis of IVIM DW imaging performed with the RT BP sequence in a 26-year-old healthy woman and a 55-year-old woman with HCV infection and METAVIR stage F3 fibrosis. (a) Graph shows logarithmic SI decay with 16 b values in the healthy volunteer (□) and the patient with HCV (○). For display purposes, data were normalized to an intensity of b = 0 sec/mm2. Solid (patient) and dashed (volunteer) lines are biexponential model curves obtained by using Bayesian-estimated IVIM parameters. Calculated values were as follows: for D, 0.81 × 10⁻³ mm2/sec and 1.06 × 10⁻³ mm2/sec for the patient with HCV and the healthy volunteer, respectively; for PF, 5.1% and 9.8%, respectively; and for D*, 50.5 × 10⁻³ mm2/sec and 49.4 × 10⁻³ mm2/sec, respectively. (b–d) PDF (measured in arbitrary units, normalized for display purposes) derived from Bayesian analysis for PF (b), D (c), and D* (d) for the same two subjects (patient, solid line; volunteer, dashed line). PF and D have narrow and distinct PDFs, which enable good differentiation between the two subjects. D* has overlapping PDFs, which means higher uncertainty for this parameter, and no ability to aid in discrimination between the healthy volunteer and the patient with HCV.
In addition, estimated SNR was calculated for four b values (0, 200, 400, and 800 mm2/sec) as mean SI of all ROIs divided by standard deviation of background noise (measured on a small ROI outside the signal region). In all subjects, the SNR at the highest b value (800 sec/mm2) was large enough to ensure proper depiction of the signal (≥15).
ADC, which is obtained by a monoexponential fit of SI, was ignored in this study. Indeed, in the ADC analysis, average contributions from two distinct phenomena—molecular diffusion (D) and pseudodiffusion (PF, D*)—are calculated, whereas we aim to separate these contributions.
Histopathologic Assessment of Liver Biopsy
All histologic specimens were evaluated by an experienced pathologist (M.I.F., 10 years of experience). Liver biopsy specimens were fixed and embedded in paraffin and stained with hematoxylin-eosin for routine morphologic analysis and quantification of steatosis, Perls Prussian blue for identification of hemosiderin deposition, reticulin for hepatocyte regeneration, and Masson trichrome for detection of fibrous tissue. The METAVIR semiquantitative scoring system (15) was used in the histopathologic determination of stage of fibrosis and grade of inflammation. Fibrosis was staged on a scale of 0–4, as follows: F0 indicated no fibrosis; F1, portal fibrosis without septa; F2, few septa; F3, numerous septa without cirrhosis; and F4, cirrhosis.
Statistical Analysis
Interexamination repeatability was assessed for each sequence in terms of the within-subject coefficient of variation and the intraclass correlation coefficient. In all other analyses, the data for each subject were represented for each combination of sequence and measure as an average over repeat examinations. Mixed-model analysis of variance was used to compare the sequences in terms of the mean of each measure while accounting for statistical dependencies among the four observations (one for each of four sequences: RT BP, RT MP, FB BP, and FB MP) for each subject. The error variance was allowed to differ across sequences to remove the assumption of variance homogeneity. Because of the relatively small number of patients with fibrosis (n = 13) and healthy control subjects (n = 7), exact Mann-Whitney tests were used to compare these subject groups in terms of the PF, D, and D* results derived for each sequence. Statistical significance was defined as P < .05. SAS software (version 9.3; SAS Institute, Cary, NC) was used for all computations.
Results
Image Quality and SNR
RT sequences (RT BP and RT MP) had the best overall image quality over FB sequences, reaching significance only for RT BP versus FB BP (Table 1). SNR was higher with MP sequences, but this difference was not significant. The SNR at a b value of 0 sec/mm2 was lower than at a b value of 200 sec/mm2, mostly because a single imaging pass was used to acquire the first b value, while all nonzero b values used three passes, resulting in higher SNR when combined with a trace technique (similar to an averaging factor of three).
Table 1.
Image Quality Scores and SNR for Four DW Sequences Assessed at Four b Values

Note.—Unless otherwise indicated, data are mean ± standard deviation.
Data are P values and were obtained with mixed-model analysis of variance.
Maximum score of 36 per sequence.
P value indicates a significant difference.
IVIM Parameters
D* and PF values were not significantly different between the four sequences (Table 2). However, D was significantly lower for RT MP when compared with RT BP (P = .01) and FB MP (P = .04).
Table 2.
IVIM Parameters Calculated for Four DW Sequences in 20 Subjects

Note.—Unless otherwise indicated, data are mean ± standard deviation.
Data are P values and were obtained with mixed-model analysis of variance.
P value indicates a significant difference.
Parameter Reproducibility
Reproducibility was good to excellent for D, moderate to good for PF, and poor to moderate for D* (Table 3). There was moderate to strong agreement between the two time points for PF and D for the RT BP and FB MP sequences (intraclass correlation coefficient > 0.6). We found that RT BP and FB MP sequences had the best parameter reproducibility.
Table 3.
Coefficient of Variation and Intraclass Correlation Coefficient of IVIM Parameters for Four DW Sequences in 10 Subjects
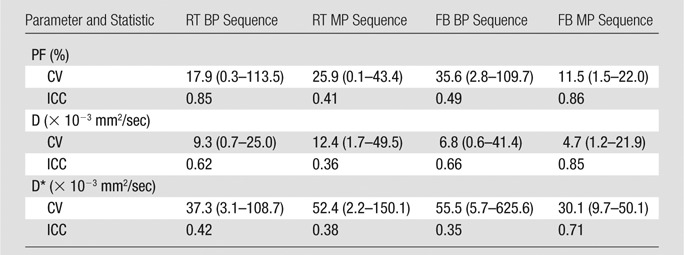
Note.—Data are means, and data in parentheses are the range. CV = coefficient of variation, ICC = intraclass correlation coefficient.
Preliminary Experience with IVIM DW Imaging in the Detection of Liver Fibrosis
The following fibrosis stages were observed in patients with HCV: F2 was seen in four patients, F3 was seen in six, and F4 was seen in three. D was significantly lower in patients with HCV than in healthy subjects (Table 4) for all sequences except the RT MP sequence. RT BP and RT MP sequences also had a significant decrease in PF in patients with HCV (P = .03 and P = .04), whereas the FB BP and FB MP sequences did not (P = .069 and P = .133, respectively). For all four sequences, D* did not vary significantly between patients with HCV and healthy volunteers, although it was higher in patients with HCV. Figure 4 shows parametric maps for a healthy volunteer and a patient with F3 HCV. Figure 5 shows the distribution of parameters in healthy volunteers, patients with F2 disease, and those with F3 to F4 disease that were obtained with the RT BP sequence.
Table 4.
IVIM Parameters in Healthy Volunteers and Patients with HCV

Note.—Unless otherwise indicated, data are mean ± standard deviation. Each P value is the exact two-sided significance level from a Mann-Whitney test to compare patients with fibrosis with healthy volunteers.
P value indicates a significant difference.
Figure 5a:
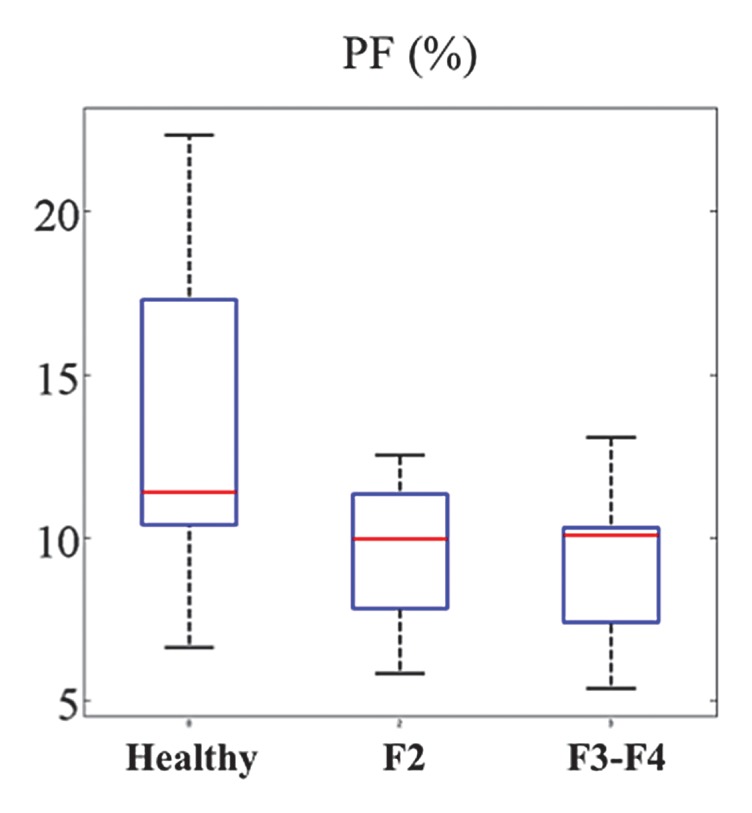
Box plot distribution of IVIM parameters for the RT DW sequence in 13 patients with HCV and seven healthy volunteers. (a) PF, (b) D, and (c) D*. While PF and D have decreased values for patients with HCV, the distributions for D* overlap between healthy volunteers and patients with HCV. Top and bottom of boxes represent 25% and 75% percentiles of data values, respectively, with the horizontal line in boxes representing the median. The whiskers extend to the most extreme data points. F2 = F2 fibrosis, F3-F4 = F3–F4 fibrosis.
Figure 5b:
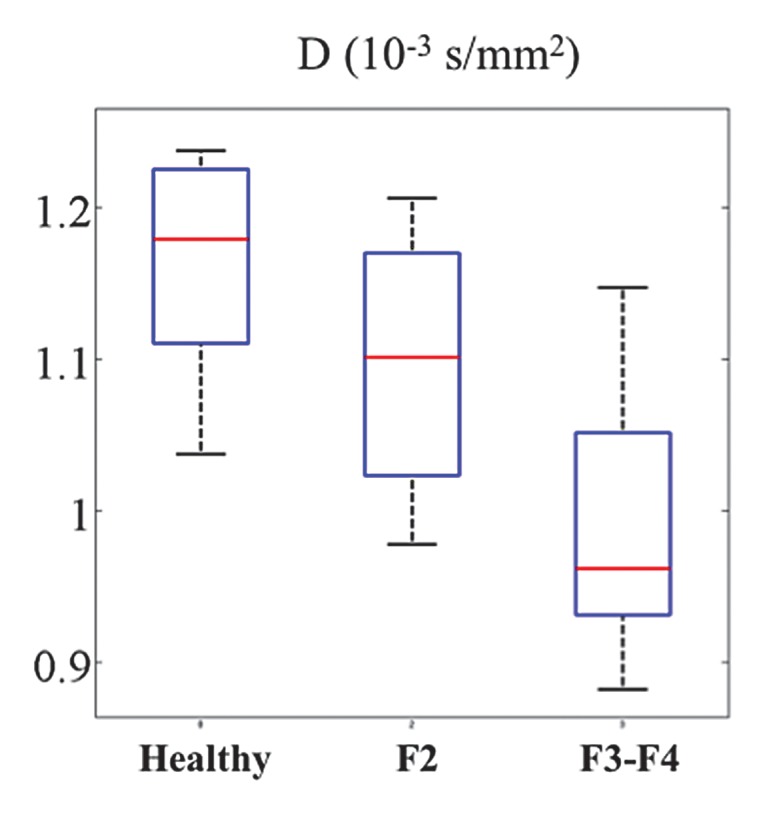
Box plot distribution of IVIM parameters for the RT DW sequence in 13 patients with HCV and seven healthy volunteers. (a) PF, (b) D, and (c) D*. While PF and D have decreased values for patients with HCV, the distributions for D* overlap between healthy volunteers and patients with HCV. Top and bottom of boxes represent 25% and 75% percentiles of data values, respectively, with the horizontal line in boxes representing the median. The whiskers extend to the most extreme data points. F2 = F2 fibrosis, F3-F4 = F3–F4 fibrosis.
Figure 5c:
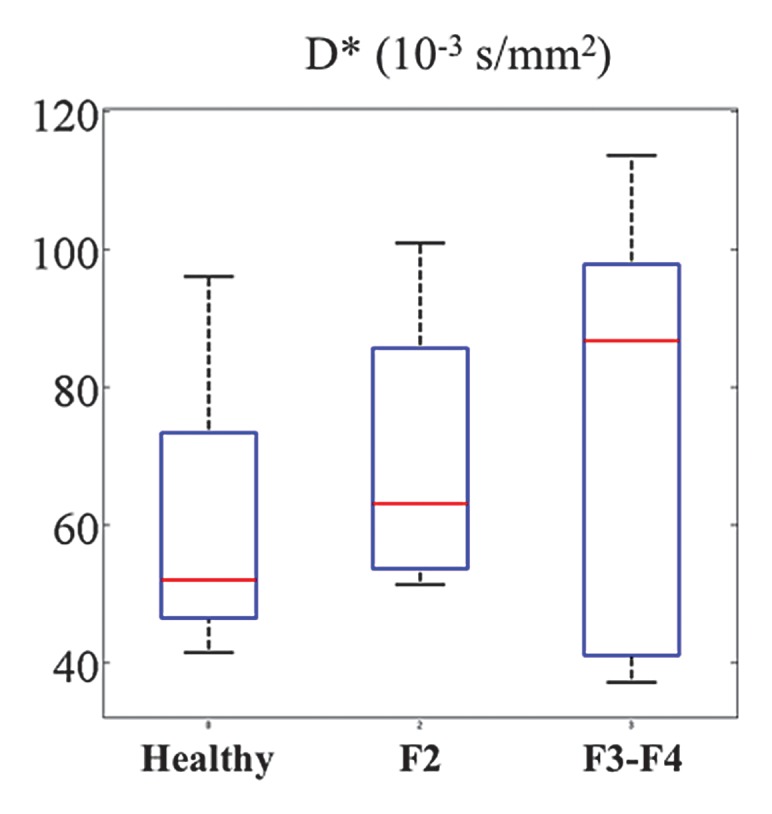
Box plot distribution of IVIM parameters for the RT DW sequence in 13 patients with HCV and seven healthy volunteers. (a) PF, (b) D, and (c) D*. While PF and D have decreased values for patients with HCV, the distributions for D* overlap between healthy volunteers and patients with HCV. Top and bottom of boxes represent 25% and 75% percentiles of data values, respectively, with the horizontal line in boxes representing the median. The whiskers extend to the most extreme data points. F2 = F2 fibrosis, F3-F4 = F3–F4 fibrosis.
Choice of the Best Sequence
The RT BP DW sequence had both good image quality (along with the RT MP sequence) and good parameter reproducibility (along with the FB MP sequence). However, the RT BP sequence was the only examination that enabled us to discriminate between healthy volunteers and patients with HCV by using both PF and D, and we elected to continue to use this sequence prospectively in this ongoing study.
Discussion
Previous studies have shown the potential of DW imaging to enable detection of liver fibrosis and cirrhosis by estimating liver ADC, which contains both diffusion and perfusion contributions. Most of these prior researchers have observed a decrease in ADC in patients with liver fibrosis and cirrhosis (16–19), although some have not (20,21). The ADC value is strongly dependent on the distribution of b values used to acquire images. For example, Girometti et al (19) showed that use of lower b values (≤400 sec/mm2) enables better fibrosis detection, an effect attributed to perfusion components at lower b values. The advantage of IVIM is the separation of D (a marker of tissue structure) from perfusion effects, including PF, which depicts vascular volume, and D*, which is an estimation of capillary blood flow velocity (1–3,22). While IVIM processing requires more complex modeling than does ADC measurement, a Bayesian-fitting approach is more stable against signal fluctuations than is a least-squares fitting approach and provides insight into the reliability of IVIM parameter determination by estimating the uncertainty of each parameter (13,14).
In this optimization study, we have compared four liver IVIM diffusion sequences by assessing the effects of gradient polarity and breathing pattern on image quality, SNR, IVIM parameters, and parameter reproducibility. We found RT BP sequence to have the best combination of image quality, reproducibility, and ability to discriminate between healthy volunteers and patients with fibrosis by using D and PF but not D*.
Image quality and SNR are important factors for DW imaging and IVIM. Blurred images may result in erroneous parameter estimation because of segmentation errors, for example, with adjacent vessels. In this regard, we found RT sequences to have higher quality than FB sequences, the latter being prone to motion-related blurring. Low SNR decreases the quality of IVIM fitting and increases the uncertainty of parameter determination (13). We found the BP sequences to yield good SNR, with no significant improvement when we used MP sequences.
D and D* values reported in our study are similar to D and D* values reported previously (2,3). However, PF values in our study were lower than those in two other studies: For the RT BP sequence, the PF value was 11% ± 4 in our study, whereas it was 28% ± 10 in the Patel et al study (3) and 30% ± 6 in the Luciani et al study (2). One possible reason for this might be a different ROI placement method or a different processing method; a freehand ROI in our study might include fewer vessel contributions and result in lower SI at a b value of 0 sec/mm2. The IVIM parameters for all 20 subjects did not vary significantly across sequences. The one exception was D, which had significantly lower values when the RT MP sequence was used. Although a dynamic distortion algorithm was used, the presence of residual artifacts could lead to the altered D values obtained by using MP gradients. A postprocessing approach might not be as robust as direct eddy current compensation offered by BP gradients (23). We were unable to see such differences in D with the FB MP sequence, and we assume that the motion blurring seen with FB sequences may conceal the effect of eddy currents in this case.
One of the potential applications of IVIM is liver fibrosis detection. Changes in PF and D in patients with liver cirrhosis have been reported by Patel et al (3) but have not been reported by Luciani et al (2). In our preliminary report, PF and D were decreased in patients with fibrosis. It is interesting to note that PF was significantly decreased in patients with HCV only for RT acquisitions and not for FB acquisitions. Indeed, the stronger blurring in FB acquisitions might result in unwanted vessel contribution to the parenchymal PF. D was significantly decreased in patients with HCV for all sequences except the RT MP sequence. As discussed previously, the measurement of D might be biased by eddy currents in the RT MP sequence. There was no significant difference in D* between healthy volunteers and patients with HCV, possibly as a result of the high uncertainty and poor reproducibility of D*.
Interexamination reproducibility is an important estimation of the reliability of IVIM as a quantitative biomarker for liver fibrosis, and its assessment is crucial for longitudinal studies and drug trials. In our study, both PF (coefficient of variation range, 11.5%–35.6%) and D (coefficient of variation < 10%, except for RT MP sequence) were found to have acceptable reproducibility, while D* (coefficient of variation range, 30.1%–55.5%) was poorly reproducible, in agreement with data reported by Patel et al (3). The poor reproducibility of D* is reflected by the higher uncertainty of this parameter, as shown by the wide PDF obtained with a Bayesian approach. The sequences with the best reproducibility were the RT BP and FB MP sequences. The fact that the RT BP sequence has better reproducibility than the FB BP sequence is in agreement with results reported by Patel et al (3). The higher reproducibility of the FB MP sequence versus the FB BP sequence may be due to the twice-refocused nature of the BP, an additional section-selective pulse being prone to motion-related errors. The higher reproducibility of the FB MP sequence versus the RT MP sequence, especially for D, may be due to motion averaging of the effects of eddy currents at a high b value.
Some limitations were encountered in this study. First, the number of cases was small, reflecting our initial experience and the need for initial sequence optimization. This is an ongoing study in which the aim is to assess the role of IVIM DW imaging in liver fibrosis detection, and we plan on performing a study with a larger sample size. Second, the set of b values was not optimized, as the number of b values in our study was relatively high compared with the number of b values in other IVIM studies (2,3). To achieve a shorter examination time without sacrificing the precision of the technique, this might be further optimized in a separate study as a function of the available SNR and IVIM parameter values in the liver (24,25).
In conclusion, we have shown that IVIM can be used for liver fibrosis detection with good image quality and acceptable reproducibility; however, the results varied among the four sequences tested, making the choice of acquisition scheme a crucial point. Our preliminary results suggest that an RT BP DW sequence has the potential to enable one to distinguish between patients with a normal liver and those with a fibrotic liver, with optimal image quality and good interexamination reproducibility. The accuracy of IVIM in the diagnosis of liver fibrosis will need to be further investigated in a larger study, alone or in comparison with other techniques, such as perfusion-weighted imaging and MR elastography.
Advances in Knowledge.
• Diffusion-weighted (DW) imaging with respiratory-triggered (RT) acquisition and bipolar (BP) diffusion gradients is the preferred method for optimized image quality and parameter reproducibility of liver intravoxel incoherent motion (IVIM) with multiple b value acquisition.
• In our preliminary report on IVIM in patients with chronic liver disease, we observed that true diffusion and perfusion fraction quantified by using DW imaging with RT acquisition and BP diffusion gradients were significantly lower (P = .006 and P = .038, respectively) in patients with liver fibrosis secondary to chronic hepatitis C virus infection than in healthy volunteers.
Implication for Patient Care.
• The optimal sequence for liver IVIM DW imaging uses BP diffusion gradients and RT acquisition, and this sequence has potential in the noninvasive detection of liver fibrosis.
Disclosures of Conflicts of Interest: H.A.D. No relevant conflicts of interest to disclose. N.G. No relevant conflicts of interest to disclose. T.N. No relevant conflicts of interest to disclose. M.I.F. No relevant conflicts of interest to disclose. D.C. No relevant conflicts of interest to disclose. E.W. No relevant conflicts of interest to disclose. M.O. No relevant conflicts of interest to disclose. A.d.O. Financial activities related to the present article: none to disclose. Financial activities not related to the present article: is employed by Siemens. Other relationships: none to disclose. T.F. Financial activities related to the present article: none to disclose. Financial activities not related to the present article: is employed by Siemens; has patents with Siemens; holds stock in Siemens; was compensated for travel expenses by Siemens. Other relationships: none to disclose. M.L.V. No relevant conflicts of interest to disclose. J.S.B. No relevant conflicts of interest to disclose. B.T. No relevant conflicts of interest to disclose.
Received March 23, 2012; revision requested May 21; revision received June 22; accepted August 15; final version accepted August 23.
Funding: This research was supported by the National Institutes of Health (grant 1R01DK087877).
Abbreviations:
- ADC
- apparent diffusion coefficient
- BP
- bipolar
- D
- true diffusion coefficient
- D*
- pseudodiffusion coefficient
- DW
- diffusion weighted
- FB
- free breathing
- HCV
- hepatitis C virus
- IVIM
- intravoxel incoherent motion
- MP
- monopolar
- probability density function
- PF
- perfusion fraction
- RT
- respiratory triggered
- SI
- signal intensity
- SNR
- signal-to-noise ratio
References
- 1.Le Bihan D, Breton E, Lallemand D, Aubin ML, Vignaud J, Laval-Jeantet M. Separation of diffusion and perfusion in intravoxel incoherent motion MR imaging. Radiology 1988;168(2):497–505 [DOI] [PubMed] [Google Scholar]
- 2.Luciani A, Vignaud A, Cavet M, et al. Liver cirrhosis: intravoxel incoherent motion MR imaging—pilot study. Radiology 2008; 249(3):891–899 [DOI] [PubMed] [Google Scholar]
- 3.Patel J, Sigmund EE, Rusinek H, Oei M, Babb JS, Taouli B. Diagnosis of cirrhosis with intravoxel incoherent motion diffusion MRI and dynamic contrast-enhanced MRI alone and in combination: preliminary experience. J Magn Reson Imaging 2010;31(3):589–600 [DOI] [PMC free article] [PubMed] [Google Scholar]
- 4.Kwee TC, Takahara T, Koh DM, Nievelstein RA, Luijten PR. Comparison and reproducibility of ADC measurements in breathhold, respiratory triggered, and free-breathing diffusion-weighted MR imaging of the liver. J Magn Reson Imaging 2008;28(5): 1141–1148 [DOI] [PubMed] [Google Scholar]
- 5.Reese TG, Heid O, Weisskoff RM, Wedeen VJ. Reduction of eddy-current-induced distortion in diffusion MRI using a twice-refocused spin echo. Magn Reson Med 2003;49(1):177–182 [DOI] [PubMed] [Google Scholar]
- 6.Kandpal H, Sharma R, Madhusudhan KS, Kapoor KS. Respiratory-triggered versus breath-hold diffusion-weighted MRI of liver lesions: comparison of image quality and apparent diffusion coefficient values. AJR Am J Roentgenol 2009;192(4):915–922 [DOI] [PubMed] [Google Scholar]
- 7.Taouli B, Sandberg A, Stemmer A, et al. Diffusion-weighted imaging of the liver: comparison of navigator triggered and breathhold acquisitions. J Magn Reson Imaging 2009;30(3):561–568 [DOI] [PubMed] [Google Scholar]
- 8.Le Bihan D, Mangin JF, Poupon C, et al. Diffusion tensor imaging: concepts and applications. J Magn Reson Imaging 2001; 13(4):534–546 [DOI] [PubMed] [Google Scholar]
- 9.Taouli B, Vilgrain V, Dumont E, Daire JL, Fan B, Menu Y. Evaluation of liver diffusion isotropy and characterization of focal hepatic lesions with two single-shot echo-planar MR imaging sequences: prospective study in 66 patients. Radiology 2003;226(1): 71–78 [DOI] [PubMed] [Google Scholar]
- 10.Rohde GK, Barnett AS, Basser PJ, Marenco S, Pierpaoli C. Comprehensive approach for correction of motion and distortion in diffusion-weighted MRI. Magn Reson Med 2004;51(1):103–114 [DOI] [PubMed] [Google Scholar]
- 11.Nasu K, Kuroki Y, Sekiguchi R, Kazama T, Nakajima H. Measurement of the apparent diffusion coefficient in the liver: is it a reliable index for hepatic disease diagnosis? Radiat Med 2006;24(6):438–444 [DOI] [PubMed] [Google Scholar]
- 12.Parker DL, Gullberg GT. Signal-to-noise efficiency in magnetic resonance imaging. Med Phys 1990;17(2):250–257 [DOI] [PubMed] [Google Scholar]
- 13.Neil JJ, Bretthorst GL. On the use of Bayesian probability theory for analysis of exponential decay data: an example taken from intravoxel incoherent motion experiments. Magn Reson Med 1993;29(5):642–647 [DOI] [PubMed] [Google Scholar]
- 14.Andreou A, Koh DM, Collins DJ, et al. Measurement reproducibility of perfusion fraction and pseudodiffusion coefficient derived by intravoxel incoherent motion diffusion-weighted MR imaging in normal liver and metastases. Eur Radiol 2012 Oct 6. [Epub ahead of print] [DOI] [PubMed] [Google Scholar]
- 15.Bedossa P, Poynard T. An algorithm for the grading of activity in chronic hepatitis C: the METAVIR Cooperative Study Group. Hepatology 1996;24(2):289–293 [DOI] [PubMed] [Google Scholar]
- 16.Lewin M, Poujol-Robert A, Boëlle PY, et al. Diffusion-weighted magnetic resonance imaging for the assessment of fibrosis in chronic hepatitis C. Hepatology 2007;46(3): 658–665 [DOI] [PubMed] [Google Scholar]
- 17.Taouli B, Chouli M, Martin AJ, Qayyum A, Coakley FV, Vilgrain V. Chronic hepatitis: role of diffusion-weighted imaging and diffusion tensor imaging for the diagnosis of liver fibrosis and inflammation. J Magn Reson Imaging 2008;28(1):89–95 [DOI] [PubMed] [Google Scholar]
- 18.Taouli B, Tolia AJ, Losada M, et al. Diffusion-weighted MRI for quantification of liver fibrosis: preliminary experience. AJR Am J Roentgenol 2007;189(4):799–806 [DOI] [PubMed] [Google Scholar]
- 19.Girometti R, Furlan A, Esposito G, et al. Relevance of b-values in evaluating liver fibrosis: a study in healthy and cirrhotic subjects using two single-shot spin-echo echo-planar diffusion-weighted sequences. J Magn Reson Imaging 2008;28(2):411–419 [DOI] [PubMed] [Google Scholar]
- 20.Boulanger Y, Amara M, Lepanto L, et al. Diffusion-weighted MR imaging of the liver of hepatitis C patients. NMR Biomed 2003;16(3):132–136 [DOI] [PubMed] [Google Scholar]
- 21.Sandrasegaran K, Akisik FM, Lin C, et al. Value of diffusion-weighted MRI for assessing liver fibrosis and cirrhosis. AJR Am J Roentgenol 2009;193(6):1556–1560 [DOI] [PubMed] [Google Scholar]
- 22.Koh DM, Collins DJ, Orton MR. Intravoxel incoherent motion in body diffusion-weighted MRI: reality and challenges. AJR Am J Roentgenol 2011;196(6):1351–1361 [DOI] [PubMed] [Google Scholar]
- 23.Le Bihan D, Poupon C, Amadon A, Lethimonnier F. Artifacts and pitfalls in diffusion MRI. J Magn Reson Imaging 2006;24(3):478–488 [DOI] [PubMed] [Google Scholar]
- 24.Lemke A, Stieltjes B, Schad LR, Laun FB. Toward an optimal distribution of b values for intravoxel incoherent motion imaging. Magn Reson Imaging 2011;29(6):766–776 [DOI] [PubMed] [Google Scholar]
- 25.Zhang JL, Sigmund EE, Rusinek H, et al. Optimization of b-value sampling for diffusion-weighted imaging of the kidney. Magn Reson Med 2012;67(1):89–97 [DOI] [PMC free article] [PubMed] [Google Scholar]


