Our preliminary results suggest that Voigt elasticity and viscosity measured between 95 Hz and 380 Hz by using shear wave dispersion ultrasound vibrometry (SDUV) are correlated and that the use of Voigt elasticity measurements from SDUV may not substantially improve performance in liver fibrosis staging compared with the time-to-peak method.
Abstract
Purpose:
To investigate the value of viscosity measured with ultrasonographic (US) elastography in liver fibrosis staging and to determine whether the use of a viscoelastic model to estimate liver elasticity can improve its accuracy in fibrosis staging.
Materials and Methods:
The study, which was performed from February 2010 to March 2011, was compliant with HIPAA and approved by the institutional review board. Written informed consent was obtained from each subject. Ten healthy volunteers (eight women and two men aged 27–55 years) and 35 patients with liver disease (17 women and 18 men aged 19–74 years) were studied by using US elasticity measurements of the liver (within 6 months of liver biopsy). US data were analyzed with the shear wave dispersion ultrasound vibrometry (SDUV) method, in which elasticity and viscosity are measured by evaluating dispersion of shear wave propagation speed, as well as with the time-to-peak (TTP) method, where tissue viscosity was neglected and only elasticity was estimated from the effective shear wave speed. The hepatic fibrosis stage was assessed histologically by using the METAVIR scoring system. The correlation of elasticity and viscosity was assessed with the Pearson correlation coefficient. The performances of SDUV and TTP were evaluated with receiver operating characteristic (ROC) curve analysis.
Results:
The authors found significant correlations between elasticity and viscosity measured with SDUV (r = 0.80) and elasticity measured with SDUV and TTP (r = 0.94). The area under the ROC curve for differentiating between grade F0–F1 fibrosis and grade F2–F4 fibrosis was 0.98 for elasticity measured with SDUV, 0.86 for viscosity measured with SDUV, and 0.95 for elasticity measured with TTP.
Conclusion:
The results suggest that elasticity and viscosity measured between 95 Hz and 380 Hz by using SDUV are correlated and that elasticity measurements from SDUV and TTP showed substantially similar performance in liver fibrosis staging, although elasticity calculated from SDUV provided a better area under the ROC curve.
© RSNA, 2012
Supplemental material: http://radiology.rsna.org/lookup/suppl/doi:10.1148/radiol.12120837/-/DC1
Introduction
Liver fibrosis and cirrhosis are a response to chronic liver injury from a variety of causes, including viral, autoimmune, drug-induced, cholestatic, and metabolic diseases (1). Liver cirrhosis may ultimately lead to hepatic failure and is associated with primary liver cancer, which increases the relative mortality rate (2). Cirrhosis affects hundreds of millions of patients worldwide, and its prevalence in the United States is estimated at 900 000—accounting for 30 000 deaths per year (1).
Quantifying the extent of liver fibrosis is important in the treatment of patients with chronic liver disease. Liver biopsy is considered the standard of reference for the diagnosis and staging of liver fibrosis (3). However, liver biopsy is an invasive technique that can cause discomfort to patients. Important complications occur in 1%–5% of patients, with a reported mortality rate between 1:1000 and 1:10 000 (4). Needle liver biopsy samples contain only about 1/50 000 of the liver and so are limited by sampling variability (1).
These limitations of liver biopsy have led to the development of noninvasive evaluations of liver fibrosis that are more suitable for screening, treatment monitoring, and follow-up. Measurements of liver elastic property by using magnetic resonance (MR) elastography (5,6), transient elastography (7,8), compression elastography (9), acoustic radiation force impulse imaging (10,11), and supersonic shear wave imaging (12,13) have shown very promising results for noninvasive fibrosis staging. With these methods, the liver is stressed mechanically and the resulting tissue displacement is measured and used to estimate liver elasticity, which has been found to correlate with fibrosis stage.
Relatively few studies have looked at viscosity, which is another fundamental tissue property (14,15). A recent study of excised mouse livers showed that liver steatosis correlates with shear wave dispersion (a property related to tissue viscosity) but not liver elasticity (16), which implies that viscosity may provide independent information about tissue state in addition to elasticity. An MR elastography study in 88 patients (14) showed that both elasticity and viscosity correlate with liver fibrosis stage; however, viscosity had less predictive value than elasticity. MR elastography measurements were performed at a single frequency of 65 Hz in the aforementioned study. Conversely, elasticity measurement methods based on ultrasound radiation force evaluate the liver over a wide and different frequency range (up to several hundred hertz). Therefore, conclusions obtained with MR elastographic studies about liver viscosity may not necessarily apply to ultrasound radiation force measurement methods and it may be worthwhile to explore whether liver viscosity measured with ultrasonography (US) has value in liver fibrosis staging.
In a typical ultrasound radiation force method, the radiation force of the ultrasound beam produces a shear wave within the studied tissue and the propagation speed of the shear wave is measured and used to calculate tissue viscoelasticity. Shear wave speed in tissues is frequency dependent, or “dispersive,” which is caused by tissue viscosity (17). However, most ultrasound radiation force methods neglect the dispersion effect and only calculate an effective elasticity from a mean shear wave speed averaged over the frequency bandwidth of the shear wave. As a result, viscosity information is lost and the resulting effective elasticity could be biased.
Our purpose was to investigate the value of viscosity measured with US elastography in liver fibrosis staging and to determine whether the use of a viscoelastic model to estimate liver elasticity can improve its accuracy in fibrosis staging.
Materials and Methods
A US scanner (iU22; Philips Healthcare, Andover, Mass) modified with a shear wave pulse sequence for this study was provided by Philips, which also funded this study. Two authors (S.C. and J.F.G.) have intellectual properties on the shear wave dispersion ultrasound vibrometry (SDUV) technology used in this study. The authors without a conflict of interest (M.R.C., B.G., J.T.L., S.O.S.) had control of inclusion of any data and information that might represent a conflict of interest for those authors who are employees of Philips Healthcare (H.X., Y.S., M.P., V.S., M.L., and S.M.). One author (M.R.C.) served as guarantor to oversee the integrity of the study. US data processing was done automatically without human interaction at Philips Healthcare with blinding to the results of biopsy. Histologic analysis was performed at the Mayo Clinic with blinding to the US results.
Subjects
The prospective study was approved by the institutional review board of the Mayo Clinic. Written consent was obtained from each participating subject. The study was compliant with the Health Insurance Portability and Accountability Act. Ten healthy volunteers (eight women and two men; age range, 27–55 years; body mass index, 20.4–24.4) and 35 patients (17 women and 18 men; age range, 19–74 years; body mass index, 17.8–29.3) with liver biopsies owing to liver disease were studied between February 2010 and March 2011. Twenty-three patients underwent ultrasound shear wave elastography in the biopsy room immediately before their liver biopsy. These patients were consecutively accrued; no patients were excluded. Twelve patients underwent ultrasound shear wave elastography within 6 months after liver biopsy. Our study coordinator contacted patients who had undergone liver biopsy within the past 6 months and who met our inclusion criteria, and those patients who agreed to participate were included (three patients studied in August 2010, four patients studied in November 2010, two patients studied in February 2011, and three patients studied in March 2011). All liver biopsies were clinically indicated and obtained as part of routine care. All healthy volunteers had normal blood test results (alanine transaminase, aspartate transaminase, alkaline phosphatase, hepatitis B surface antigen, and hepatitis C quantitation), no history of liver diseases, and no evidence of fatty liver at B-mode US.
Among the 35 patients who underwent biopsy, nine patients had chronic hepatitis C, six patients had nonalcoholic fatty liver disease, six patients had autoimmune hepatitis, four patients had reactive hepatitis, two patients had primary biliary cirrhosis, two patients had drug-induced liver injury, and one patient each had chronic hepatitis B, granulomatous hepatitis, cystic fibrosis, nonspecific hepatitis, cardiac disease with passive venous congestion of the liver, and hereditary hemochromatosis.
Inclusion criteria for patients were as follows: patient was scheduled for clinically indicated liver biopsy for fibrosis staging or had undergone liver biopsy within the past 6 months, age of 18–80 years, and body mass index less than 30. Inclusion criteria for healthy volunteers were as follows: age of 18–80 years, body mass index less than 30, no history of chronic liver disease and concomitant illness, and daily alcohol intake of one drink or less (one drink is 1.25 oz of 80-proof liquor, 12 oz of beer, or 5 oz of wine). Patients were excluded if they were from a vulnerable population (eg, prisoners) or lacked the capacity to consent. Healthy volunteers were excluded if unsatisfactory results were obtained at blood tests (eg, abnormal liver enzyme levels, positive anti–hepatitis C virus antibodies, or positive hepatitis B surface antigen) or if there was evidence of an abnormal liver at US.
US Measurements
A commercial US scanner (iU22, Philips Healthcare) was modified to produce shear waves and track them as previously described (17). Measurements of liver tissue elasticity were obtained by six sonographers (with 8, 11, 11, 15, 16, and 25 years of experience) in the right lobe of the liver by using a curvilinear transducer (C5–1, Philips Healthcare) through intercostal spaces with the subject lying supine with right arm abduction. The operator positioned the probe by using real-time B-mode imaging to locate a large liver area free of major vessels. The measurement location was selected with a cursor moved by a trackball. The subject was instructed to hold his or her breath while the operator hit a button that launched the US data acquisition sequence with 10 push cycles. Acquisition time was approximately 0.1 second. The machine paused for about 10 seconds after each acquisition to allow cooling of the probe and transmission circuit. Beam-summed radiofrequency data were captured during the tracking phase for off-line analysis. Twenty-seven measurements were obtained across the liver to obtain a more comprehensive evaluation. The sonographers were instructed to place the 27 measurements over a 3 × 3 grid (three depths and three lateral positions), with three repeated acquisitions at each grid location.
The push pulse used to produce shear waves had a frequency of 2.5 MHz, a length of several hundred microseconds, and an F-number of 2. Parameters for pulse-echo detection of shear wave propagation were as follows: five lateral positions spaced at 1.0-mm intervals at the focal depth (40 mm), pulse repetition frequency at each tracking location of 2 kHz, and tracking pulse center frequency of 2.5 MHz. Acoustic output was controlled to ensure that acoustic and thermal outputs complied with U.S. Food and Drug Administration safety regulations (18,19). A relatively low mechanical index of less than 1.3 was used to emulate what to expect in a clinical examination with a commercial US scanner.
Postprocessing
Main data postprocessing steps for SDUV were as follows: (a) Cross-correlation–based speckle tracking was used to estimate shear wave raw displacements; (b) conditioned displacements were obtained by mapping the displacement time curve to the uniform time grid and using bandpass filtering to remove background motion; (c) shear wave speed was estimated at frequencies of 95, 190, 285, and 380 Hz; and (d) elasticity and viscosity were calculated by using Voigt model fitting within a frequency range of 95–380 Hz. The Voigt model uses a viscous damper and an elastic spring connected in parallel to describe viscoelastic materials. It is not clear yet which rheologic model can best describe the response of soft tissues. The Voigt model is widely used in MR elastography, and a study of agar-gelatin phantoms and bovine muscle concluded that the Voigt model was better than the Maxwell model (20). Examples of Voigt fitting in two patients (Figs E1, E2 [online]) suggest that the Voigt model is sufficient for the frequency range used in SDUV. Effective elasticity was also calculated directly from data obtained in step b by using the time-to-peak (TTP) algorithm. In step c, shear wave speed cs was calculated by using a phase gradient method cs(ω) = ωΔr/Δφ, where ω is the shear wave frequency and Δr and Δφ are the distance and phase difference (Δφ = φ1 − φ2) measured between two detection points along the shear wave propagation path, respectively. This study used five detection locations for one SDUV acquisition, and a linear regression was used to find the value of Δr/Δφ more robustly. Ten push pulses repeated at a pulse repetition frequency of 95 Hz were used in one SDUV acquisition. Shear waves thus produced contained frequency components at 95 Hz and its higher harmonics (190, 285, and 380 Hz, etc). Phase gradient estimate of cs was repeated at 95, 190, 285, and 380 Hz on the same data set to obtain dispersion information.
Correlation coefficient maps derived from the speckle-tracking process in step a were used as a quality control of motion tracking. If the averaged correlation coefficient within the depth of interest (depths, 30–70 mm) was lower than a threshold (r = 0.7) for all five tracking locations of a single SDUV measurement, this measurement was assumed to have failed. Motion tracking with a correlation coefficient of less than 0.7 was considered invalid because jitter error at the 0.7 level was predicted according to Walker and Trahey (21) to be close to the amplitude of real shear wave expected in this study (jitter error increases when the correlation coefficient decreases). Consequently, the acquisition was excluded from reconstruction and statistical analysis. On average, the motion tracking success rate was found to be about 86% (mean) among all acquisitions. Because elasticity and/or viscosity obtained with good motion tracking data sets within each subject sometimes have substantial variations, we used additional quality control measures to reject outliers. TTP elasticity values different from the median TTP elasticity value in each subject by more than 75% were excluded, and the remaining TTP elasticity values were averaged to obtain a single value of effective elasticity for each subject. The same procedure was used to reject outliers for SDUV elasticity measurements. If an acquisition was considered an outlier from Voigt elasticity, it was also excluded from the final averaging process for Voigt viscosity. The mean rejection rate was 12% (range, 0%–32%) for TTP and 13% (range, 0%–50%) for SDUV.
Histologic Analysis
Specimens obtained from percutaneous liver biopsy were fixed in formalin, embedded in paraffin, and stained with hematoxylin-eosin and Masson trichrome. All biopsy specimens were analyzed independently by two hepatopathologists (S.O.S. and J.T.L., with 8 and 7 years of experience, respectively) who were blinded to the results of the US study. In case of discrepancies, consensus was obtained. Liver fibrosis was evaluated according to the METAVIR scoring system (22), as follows: F0 = no fibrosis, F1 = portal fibrosis without septa, F2 = portal fibrosis and few septa, F3 = numerous septa without cirrhosis, and F4 = cirrhosis.
Statistical Analysis
The Spearman rank correlation was used to assess the correlations between Voigt elasticity and viscosity obtained with SDUV and between Voigt elasticity obtained with SDUV and effective elasticity obtained with TTP. The Spearman rank correlation was also used to access the association between extent of fibrosis (quantified with the biopsy grade) and Voigt elasticity, Voigt viscosity, and effective elasticity (control subjects were assumed to have a fibrosis score of F0 in these tests). The performances of the various parameters in helping differentiate mild fibrosis (score, F0–F1) from clinically important fibrosis (score, F2–F4) were studied by using receiver operating characteristic (ROC) curves. The differentiation of these two groups is important clinically because, according to the American Association for the Study of Liver Diseases, patients with hepatitis C genotype 1 infection should be treated only when substantial fibrosis (score, ≥F2) is observed (14). The areas under the ROC curves were compared by using the nonparametric approach of DeLong et al (23). Multivariate logistic regression was used to test whether adding Voigt viscosity to elasticity would help fibrosis staging. Software (JMP, SAS Institute, Cary, NC; MedCalc, MedCalc Software, Mariakerke, Belgium) was used for statistical analysis. For all statistical tests, P < .05 was considered indicative of a statistically significant difference.
Results
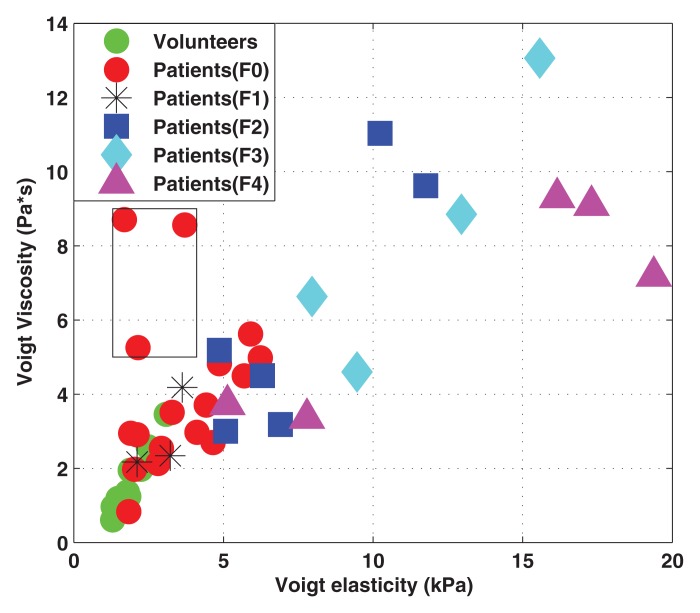
Seventeen of the 35 patients (49%) had a METAVIR score of F0, three (9%) had a score of F1, six (17%) had a score of F2, four (11%) had a score of F3, and five (14%) had a score of F4. Voigt elasticity and viscosity measured with SDUV were correlated (r = 0.80, 95% confidence interval [CI]: 0.67, 0.89; Fig 1). Of the three patients with low elasticity but high viscosity (outliers in Fig 1), one patient had acute liver disease (drug-induced liver injury) that improved spontaneously in the interval between biopsy and SDUV after treatment and one had iron overload (owing to hereditary hemochromatosis) that improved with treatment in the interval between biopsy and SDUV. Follow-up data on the third subject is lacking.
Figure 1:
Scatterplot shows Voigt elasticity and viscosity obtained with SDUV in all subjects (sample size: 45). Cases in box are outliers (still included in statistical analysis).
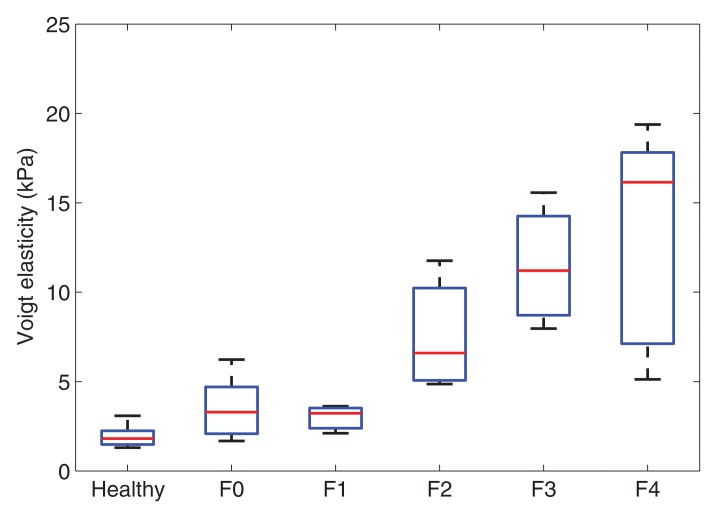
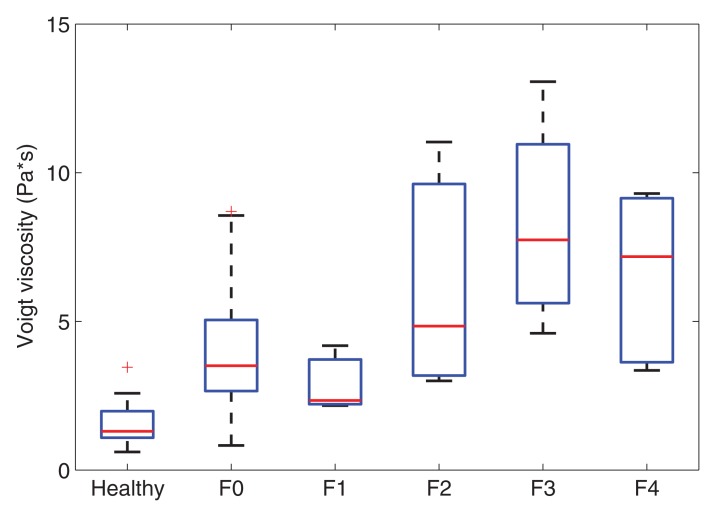
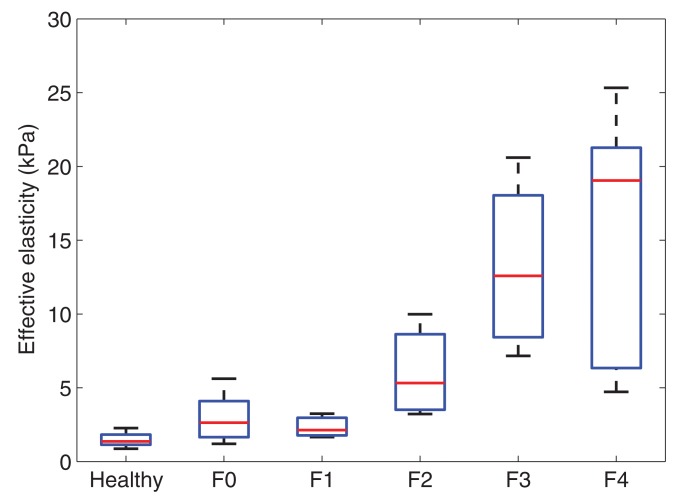
Voigt elasticity and viscosity measured with SDUV and effective elasticity measured with TTP increased with increasing liver fibrosis stage (Fig 2). The extent of fibrosis was correlated with Voigt elasticity (r = 0.83; 95% CI: 0.71, 0.90), Voigt viscosity (r = 0.68; 95% CI: 0.49, 0.81), and effective elasticity (r = 0.81; 95% CI: 0.68, 0.89). Voigt elasticity and effective elasticity were highly correlated (r = 0.94; 95% CI: 0.89, 0.97). At multivariate logistic regression, after adjusting for Voigt elasticity, Voigt viscosity was not significantly associated with fibrosis stage (P = .31).
Figure 2a:
Box plots show interquartile range (box), median (line within box), range (whisker), and outliers (dot) of (a) Voigt elasticity measured with SDUV, (b) Voigt viscosity measured with SDUV, and (c) effective elasticity measured with TTP for healthy volunteers and patients with each fibrosis stage. Data are from 10 healthy volunteers and 17 patients with stage F0 fibrosis, three with stage F1 fibrosis, six with stage F2 fibrosis, four with stage F3 fibrosis, and five with stage F4 fibrosis.
Figure 2b:
Box plots show interquartile range (box), median (line within box), range (whisker), and outliers (dot) of (a) Voigt elasticity measured with SDUV, (b) Voigt viscosity measured with SDUV, and (c) effective elasticity measured with TTP for healthy volunteers and patients with each fibrosis stage. Data are from 10 healthy volunteers and 17 patients with stage F0 fibrosis, three with stage F1 fibrosis, six with stage F2 fibrosis, four with stage F3 fibrosis, and five with stage F4 fibrosis.
Figure 2c:
Box plots show interquartile range (box), median (line within box), range (whisker), and outliers (dot) of (a) Voigt elasticity measured with SDUV, (b) Voigt viscosity measured with SDUV, and (c) effective elasticity measured with TTP for healthy volunteers and patients with each fibrosis stage. Data are from 10 healthy volunteers and 17 patients with stage F0 fibrosis, three with stage F1 fibrosis, six with stage F2 fibrosis, four with stage F3 fibrosis, and five with stage F4 fibrosis.
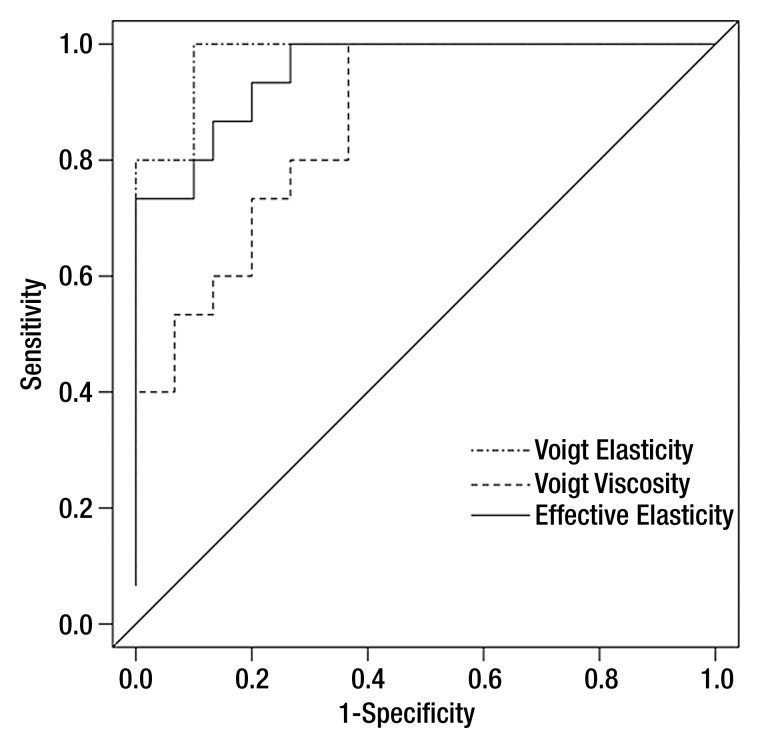
The area under the ROC curve was 0.98 (95% CI: 0.92, 1.00) for Voigt elasticity measured with SDUV, 0.86 (95% CI: 0.72, 1.00) for Voigt viscosity measured with SDUV, and 0.95 (95% CI: 0.87, 1.00) for effective elasticity measured with TTP (Fig 3). The optimal cutoff values (corresponding to the highest sum of sensitivity and specificity) were 4.65 kPa for Voigt elasticity measured with SDUV (sensitivity = 1.00, specificity = 0.87), 2.97 Pa · sec for Voigt viscosity measured with SDUV (sensitivity = 1.00, specificity = 0.63), and 3.5 kPa for effective elasticity measured with TTP (sensitivity = 0.93, specificity = 0.8). The areas under the ROC curves were different between Voigt elasticity and Voigt viscosity (P = .02) and between effective elasticity and Voigt viscosity (P = .03) but were not different between Voigt elasticity and effective elasticity (P = .22).
Figure 3:
ROC curves (sample size: 45) based on Voigt elasticity and viscosity measured with SDUV and effective elasticity measured with TTP for differentiating between stage F0–F1 fibrosis and stage F2–F4 fibrosis. Area under ROC curve was 0.98 (95% CI: 0.92, 1.00) for Voigt elasticity measured with SDUV, 0.86 (95% CI: 0.72, 1.00) for Voigt viscosity measured with SDUV, and 0.95 (95% CI: 0.87, 1.00) for effective elasticity measured with TTP.
Discussion
The results of this study showed that Voigt elasticity and viscosity measured with SDUV were correlated and that Voigt viscosity measurements were less accurate than Voigt elasticity measurements for liver fibrosis staging (F0–F1 vs F2–F4). These findings agree with those obtained with MR elastography at 65 Hz (14). According to multivariate logistic regression, the use of Voigt viscosity in addition to Voigt elasticity did not help differentiate stage F0–F1 fibrosis from stage F2–F4 fibrosis. The area under the ROC curve was 0.98 for Voigt elasticity measured with SDUV and 0.95 for effective elasticity measured with TTP. Therefore, neglecting viscosity in ultrasound shear wave elasticity measurements (the approach used in TTP) may not substantially reduce the performance of liver fibrosis staging.
Follow-up data on the few outliers with lower elasticity but high viscosity in Figure 1 may suggest that elasticity is correlated with chronic changes such as fibrosis, whereas viscosity may be associated with short-term and more dynamic changes in liver. Therefore, it may be interesting to conduct longitudinal studies to follow the measurements of Voigt elasticity and viscosity on the same subjects over a period of time.
Our study was limited by the relatively small sample size. Therefore, we did not study the influence of other factors such as steatosis, edema, or iron overload on elasticity and viscosity measurements. Another limitation was the lack of precise correlation between locations of ultrasound elasticity measurements and biopsy sites (because some subjects underwent US measurements several months after biopsy, it was difficult to align elasticity measurement locations with biopsy sites). Therefore, heterogeneity of liver fibrosis may have an influence on the study results. Viscosity was only analyzed with the Voigt model herein. Further investigations are needed to determine if an improved viscoelastic model would yield more accurate results for viscosity. US acquisitions were obtained by six sonographers with different levels of experience. The sonographer effect on US measurements was not evaluated in this study, which is another limitation.
In conclusion, our preliminary results suggest that Voigt elasticity and viscosity measured between 95 Hz and 380 Hz with SDUV are correlated and that the use of Voigt elasticity measurements from SDUV may not substantially improve performance in liver fibrosis staging compared with TTP.
Advances in Knowledge.
• Elasticity and viscosity obtained from ultrasound shear wave measurements in liver are correlated, and elasticity is more effective than viscosity for liver fibrosis staging.
• Accounting for viscosity does not significantly improve the performance of elasticity in liver fibrosis staging.
Implication for Patient Care.
• The results suggest that ultrasound shear wave measurements for liver fibrosis staging may neglect tissue viscosity.
Disclosures of Conflicts of Interest: S.C. Financial activities related to the present article: institution received a grant from Philips Healthcare; institution received provision of writing assistance, medicines, equipment, or administration support from Philips Healthcare. Financial activities not related to the present article: is a paid consultant for Sonoscape; institution received royalties from GE Medical Systems and Philips Healthcare. Other relationships: none to disclose. W.S. Financial activities related to the present article: institution received a grant from Philips Healthcare; institution received provision of writing assistance, medicines, equipment, or administration support from Philips Healthcare. Financial activities not related to the present article: none to disclose. Other relationships: none to disclose. M.R.C. Financial activities related to the present article: none to disclose. Financial activities not related to the present article: institution has grants/grants pending with Siemens Medical and Endocare. Other relationships: none to disclose. B.G. No relevant conflicts of interest to disclose. J.T.L. Financial activities related to the present article: institution received a grant from Philips Healthcare; institution received provision of writing assistance, medicines, equipment, or administration support from Philips Healthcare. Financial activities not related to the present article: none to disclose. Other relationships: none to disclose. S.O.S. No relevant conflicts of interest to disclose. J.F.G. Financial activities related to the present article: institution received a grant from Philips Healthcare. Financial activities not related to the present article: receives payment for board membership from SuperSonic Imagine; institution has patents (planned, pending, or issued) from Ultrawave. Other relationships: none to disclose. H.X. No relevant conflicts of interest to disclose. Y.S. No relevant conflicts of interest to disclose. M.P. No relevant conflicts of interest to disclose. V.S. Financial activities related to the present article: none to disclose. Financial activities not related to the present article: is an employee of Philips Healthcare. Other relationships: none to disclose. M.L. Financial activities related to the present article: none to disclose. Financial activities not related to the present article: is an employee of Philips Healthcare. Other relationships: none to disclose. S.M. Financial activities related to the present article: none to disclose. Financial activities not related to the present article: is an employee of Philips Healthcare. Other relationships: none to disclose.
Supplementary Material
Acknowledgments
The authors acknowledge Matthew Urban, PhD, and Heng Zhao, PhD, for supporting the background development of the SDUV technology used in this study. The authors also acknowledge the technical assistance of Jean-Luc Robert, PhD, and Shiwei Zhou, PhD, of Philips Research North America to reconstruction algorithms development.
Received April 13, 2012; revision requested June 11; revision received July 27; accepted August 24; final version accepted September 7.
Supported by Philips Ultrasound.
Funding: This research was supported by the National Institutes of Health (grant DK082408).
Abbreviations:
- CI
- confidence interval
- ROC
- receiver operating characteristic
- SDUV
- shear wave ultrasound vibrometry
- TTP
- time to peak
References
- 1.Friedman SL. Liver fibrosis: from bench to bedside. J Hepatol 2003;38(Suppl 1):S38–S53 [DOI] [PubMed] [Google Scholar]
- 2.Pinzani M, Rombouts K. Liver fibrosis: from the bench to clinical targets. Dig Liver Dis 2004;36(4):231–242 [DOI] [PubMed] [Google Scholar]
- 3.Bravo AA, Sheth SG, Chopra S. Liver biopsy. N Engl J Med 2001;344(7):495–500 [DOI] [PubMed] [Google Scholar]
- 4.Afdhal NH, Nunes D. Evaluation of liver fibrosis: a concise review. Am J Gastroenterol 2004;99(6):1160–1174 [DOI] [PubMed] [Google Scholar]
- 5.Yin M, Talwalkar JA, Glaser KJ, et al. Assessment of hepatic fibrosis with magnetic resonance elastography. Clin Gastroenterol Hepatol 2007;5(10):1207–1213, e2 [DOI] [PMC free article] [PubMed] [Google Scholar]
- 6.Huwart L, Sempoux C, Vicaut E, et al. Magnetic resonance elastography for the noninvasive staging of liver fibrosis. Gastroenterology 2008;135(1):32–40 [DOI] [PubMed] [Google Scholar]
- 7.Sandrin L, Fourquet B, Hasquenoph JM, et al. Transient elastography: a new noninvasive method for assessment of hepatic fibrosis. Ultrasound Med Biol 2003;29(12):1705–1713 [DOI] [PubMed] [Google Scholar]
- 8.Castéra L, Vergniol J, Foucher J, et al. Prospective comparison of transient elastography, Fibrotest, APRI, and liver biopsy for the assessment of fibrosis in chronic hepatitis C. Gastroenterology 2005;128(2):343–350 [DOI] [PubMed] [Google Scholar]
- 9.Friedrich-Rust M, Ong MF, Herrmann E, et al. Real-time elastography for noninvasive assessment of liver fibrosis in chronic viral hepatitis. AJR Am J Roentgenol 2007;188(3):758–764 [DOI] [PubMed] [Google Scholar]
- 10.Palmeri ML, Wang MH, Dahl JJ, Frinkley KD, Nightingale KR. Quantifying hepatic shear modulus in vivo using acoustic radiation force. Ultrasound Med Biol 2008;34(4):546–558 [DOI] [PMC free article] [PubMed] [Google Scholar]
- 11.Boursier J, Isselin G, Fouchard-Hubert I, et al. Acoustic radiation force impulse: a new ultrasonographic technology for the widespread noninvasive diagnosis of liver fibrosis. Eur J Gastroenterol Hepatol 2010;22(9):1074–1084 [DOI] [PubMed] [Google Scholar]
- 12.Muller M, Gennisson JL, Deffieux T, Tanter M, Fink M. Quantitative viscoelasticity mapping of human liver using supersonic shear imaging: preliminary in vivo feasibility study. Ultrasound Med Biol 2009;35(2):219–229 [DOI] [PubMed] [Google Scholar]
- 13.Bavu E, Gennisson JL, Couade M, et al. Noninvasive in vivo liver fibrosis evaluation using supersonic shear imaging: a clinical study on 113 hepatitis C virus patients. Ultrasound Med Biol 2011;37(9):1361–1373 [DOI] [PubMed] [Google Scholar]
- 14.Huwart L, Sempoux C, Salameh N, et al. Liver fibrosis: noninvasive assessment with MR elastography versus aspartate aminotransferase–to-platelet ratio index. Radiology 2007;245(2):458–466 [DOI] [PubMed] [Google Scholar]
- 15.Deffieux T, Montaldo G, Tanter M, Fink M. Shear wave spectroscopy for in vivo quantification of human soft tissues visco-elasticity. IEEE Trans Med Imaging 2009;28(3):313–322 [DOI] [PubMed] [Google Scholar]
- 16.Barry CT, Mills B, Hah Z, et al. Shear wave dispersion measures liver steatosis. Ultrasound Med Biol 2012;38(2):175–182 [DOI] [PMC free article] [PubMed] [Google Scholar]
- 17.Chen SG, Urban MW, Pislaru C, et al. Shearwave dispersion ultrasound vibrometry (SDUV) for measuring tissue elasticity and viscosity. IEEE Trans Ultrason Ferroelectr Freq Control 2009;56(1):55–62 [DOI] [PMC free article] [PubMed] [Google Scholar]
- 18.Herman BA, Harris GR. Models and regulatory considerations for transient temperature rise during diagnostic ultrasound pulses. Ultrasound Med Biol 2002;28(9):1217–1224 [DOI] [PubMed] [Google Scholar]
- 19.O’Brien WD, Jr, Deng CX, Harris GR, et al. The risk of exposure to diagnostic ultrasound in postnatal subjects: thermal effects. J Ultrasound Med 2008;27(4):517–535; quiz 537–540 [DOI] [PMC free article] [PubMed] [Google Scholar]
- 20.Catheline S, Gennisson JL, Delon G, et al. Measuring of viscoelastic properties of homogeneous soft solid using transient elastography: an inverse problem approach. J Acoust Soc Am 2004;116(6):3734–3741 [DOI] [PubMed] [Google Scholar]
- 21.Walker WF, Trahey GE. A fundamental limit on delay estimation using partially correlated speckle signals. IEEE Trans Ultrason Ferroelectr Freq Control 1995;42(2):301–308 [Google Scholar]
- 22.Intraobserver and interobserver variations in liver biopsy interpretation in patients with chronic hepatitis C: the French METAVIR Cooperative Study Group. Hepatology 1994;20(1 Pt 1):15–20 [PubMed] [Google Scholar]
- 23.DeLong ER, DeLong DM, Clarke-Pearson DL. Comparing the areas under two or more correlated receiver operating characteristic curves: a nonparametric approach. Biometrics 1988;44(3):837–845 [PubMed] [Google Scholar]
Associated Data
This section collects any data citations, data availability statements, or supplementary materials included in this article.


