In this study, we validate the Bookend approach for quantifying cerebral blood flow against H2[15O] PET in a study of 18 patients with angiographically confirmed cerebrovascular occlusive disease.
Abstract
Purpose:
To compare quantitative values of cerebral blood flow (CBF) derived from dynamic susceptibility contrast (DSC) magnetic resonance (MR) imaging with reference standard positron emission tomography (PET) in patients with confirmed cerebrovascular occlusive disease.
Materials and Methods:
Local institutional review board approval and informed consent were obtained for a prospective study of 18 patients (six men, 12 women; age range, 28–71 years; mean age, 45 years ± 10.4 [standard deviation]) with angiographically confirmed Moyamoya (n = 8) or internal carotid artery occlusions (n = 10). DSC MR images and oxygen 15–labeled water (H2[15O]) PET images were acquired on the same day. DSC images were postprocessed to yield parametric images of CBF (in mL/100 g/min), coregistered, and analyzed using grid-based regions of interest. Mean values of CBF in each region of interest from MR imaging and PET data sets were compared. Correlations for each patient were determined and overall agreement between pooled MR imaging and PET CBF was reported using linear regression analysis and Bland-Altman plots.
Results:
Strong correlations (r2 ≥ 0.55) were found between MR imaging and PET CBF values in all patients. Use of the bookend approach was found to underestimate CBF predictably across the patient cohort (mean slope, 0.82; standard deviation, 0.18; slope of aggregated data, 0.75). This allowed for a simple rescaling of MR imaging values producing strong agreement with PET values in the aggregated data (r2 = 0.66; slope = 1.00; intercept = 0.00).
Conclusion:
The data show that the bookend MR imaging technique produces similar results for quantitative CBF between DSC MR imaging and H2[15O] PET. Although MR-derived CBF underestimated PET-derived CBF, the patient-to-patient variability in the slopes of the linear MR and PET relationships was significantly smaller than a competing quantitation technique. As a result, the bookend technique appears to more predictably measure quantitative CBF in a clinical setting.
© RSNA, 2013
Supplemental material: http://radiology.rsna.org/lookup/suppl/doi:10.1148/radiol.12120756/-/DC1
Introduction
Accurate, quantitative, regional measurements of cerebral blood flow (CBF) in living humans are important for both clinical and research applications (1,2). Recently, investigators from the multicenter DEFUSE-2 (Diffusion Weighted Imaging Evaluation for Understanding Stroke Evolution-2) study reported preliminary data suggesting that usage of magnetic resonance (MR) imaging perfusion-diffusion mismatch could be used to identify acute stroke patients who would benefit from reperfusion therapy. These results have renewed interest in quantitative MR imaging that reflects perfusion deficits.
The quantitation of CBF (measured in mL/100 g/min) is a natural choice to consider for study as it has been extensively investigated in animals as a predictor of irreversible infarct in relation to electrical activity in neurons, histologic examination postmortem, and time from ictus (3–5). The current standard of reference for measuring CBF is positron emission tomography (PET) with use of oxygen 15–radiolabeled water, H2[15O]. However, the limited availability of PET cyclotrons and utilization of arterial puncture and ionizing radiation reduces the widespread use of PET perfusion imaging. A validated MR CBF quantitation method would have particular value for longitudinal studies in patients with a wide range of pathologic conditions including cerebrovascular occlusive disease and ischemic stroke (6).
Dynamic susceptibility contrast (DSC) MR imaging has shown promise in calculating CBF by measuring the susceptibility-induced signal loss with the influx of a contrast agent bolus (7,8). However, due to the inherent complexities of susceptibility imaging, the derived values have only been confirmed to accurately show relative, rather than quantitative, values (7,9–11). The bookend technique (12), a DSC MR imaging perfusion protocol, calibrates relative images of CBF into quantitative ones by using a patient-specific scaling factor—derived from measured changes in the longitudinal relaxation rate (T1) of parenchymal white matter and blood before and after the injection of gadolinium-based contrast agent (Appendix E1 [online]).
Thus far, no direct comparison between the bookend MR imaging– and PET-derived CBF values has been reported. In particular, the evaluation should be performed in a population of patients with altered cerebral hemodynamics, which will ensure the technique is robust in a setting of delay and dispersion effects which are known to be problematic for DSC MR imaging perfusion evaluation (13). The purpose of this work was to compare the accuracy of CBF measurements as obtained by using the bookend technique with CBF values obtained by using H2[15O] PET in a prospective study of patients with angiographically confirmed cerebrovascular occlusive disease.
Materials and Methods
With approval from the institutional review board we obtained informed consent from patients taking part in an ongoing study of cerebrovascular occlusive disease, for recruitment into a prospective study comparing MR imaging and PET-derived CBF quantitation. Patients were recruited into this study between November 2007 and January 2009. MR imaging and PET CBF examinations were performed sequentially on the same day in adjacent imaging suites. There were no adverse events recorded. CBF images were calculated and compared directly to test the hypothesis that MR imaging–derived CBF values can be used to predict PET CBF values, which served as a reference standard. The study inclusion criteria required patients to have undergone angiography, at which Moyamoya disease or occlusion and/or severe stenosis of one or both internal carotid arteries was found, within 120 days of enrollment. All subsequent MR and PET imaging was performed at Washington University in St. Louis, Mo—the site of recruitment. Major exclusion criteria included pregnancy, contraindications to MR imaging, and inability to provide informed consent.
Bookend CBF Quantitation
The bookend technique has been previously described (12,14,15) but will briefly be summarized below. A more detailed description is found in Appendix E1 (online). Three consecutive image series were acquired: two-segmented, multiphase inversion-recovery (IR) Look-Locker (LL) echo-planar imaging (EPI) studies, one obtained before and one after the T2*-weighted DSC gradient recalled-echo EPI perfusion-weighted images. The IR LL EPI images were used to obtain estimates of T1 changes in normal white matter, before and after the injection of a T1-shortening contrast agent. These estimates, along with a careful modeling of the intravascular to extravascular water exchange, allowed quantitation of cerebral blood volume from the steady-state (CBVSS)—that is, the distribution phase of the contrast agent (14–17). From DSC MR imaging analysis, relative CBF (rCBF) and relative CBV (rCBV) were computed by using singular value decomposition as described in Ostergaard et al (8). The ratio of the mean CBVSS in parenchymal white matter measured in milliliters per 100 g to the average relative CBV (in arbitrary units) in the same white matter produces a correction factor for calculating quantitative CBF (qCBF) in mL/100 g/min (12):
 |
This quantitation process was performed automatically and without manual intervention by using in-house software written in Matlab (Matlab 2009a; Mathworks, Natick, Mass), based on the bookend method outlined above and previously applied in clinical studies of cancer (18,19), multiple sclerosis (20), and acute stroke (21). In large clinical studies this automated perfusion quantitation technique has been found to be robust, repeatable, and reliable (15). Reconstructed images were assessed for quality by an MR physicist (T.J.C., with more than 10 years of experience in perfusion imaging). In addition, a separate calculation of MR qCBF was performed in which the average non–bookend calibrated MR relative CBF, determined in a subcortical region of healthy white matter, was scaled to a standard value of 22 mL/100 g/min—the mean, age-independent CBF in white matter. In this quantitation scheme,
 |
where rCBFWM is the average rCBF in healthy white matter in DSC MR imaging–derived rCBF maps—ie, prior to bookend calibration. This approach has been used to estimate MR imaging–derived qCBF in prior studies (10,22,23).
MR Imaging Protocol
Bookend DSC MR imaging examinations were performed as follows: IR LL EPI precontrast acquisition, gradient-recalled-echo EPI DSC MR imaging with contrast material injection, and IR LL EPI postcontrast acquisition. The following imaging parameters were utilized for the IR LL EPI sequences: acquisition of a single 5-mm two-dimensional section co-localized to a single section of the gradient-recalled-echo EPI acquisition with repetition time msec/echo time msec, 21/9; field of view, 22 cm; 128 × 128 matrix; 20° flip angle; 120-point read out. The total acquisition time for each LL EPI sequence was 45 seconds. The DSC MR imaging sequence utilized the following parameters: a stack of 13–15 5-mm sections, 1500/45, 128 × 128 matrix, 22-cm field of view, 30° flip angle, 50 measurements per section. A single dose (0.1 mmol/kg) of gadolinium-based contrast agent (gadopentetate dimeglumine [Magnevist; Berlex, Princeton, NJ]) was injected through an antecubital vein at 4 mL/sec during the DSC MR imaging acquisition. In addition, an anatomic T1-weighted magnetization-prepared rapid acquisition gradient echo (2000/3.06, 8° flip angle, 256 × 256-mm field of view and matrix) study was acquired for image registration prior to contrast agent injection.
PET Protocol
All PET scans were acquired (ECAT EXACT HR PET scanner; CTI PET Systems, Knoxville, Tenn) in two-dimensional mode with intersection septa extended (24). A 40-second acquisition was initiated upon arrival of activity in the head following bolus injection of 50–75 mCi of H2[15O] while arterial blood activity is obtained at 1-second intervals with an automated blood sampler. PET images (2.0 × 2.0 × 2.425-mm pixels) were reconstructed with filtered back-projection by using measured attenuation and scatter correction with a ramp filter. The reconstructed images were smoothed with a three-dimensional Gaussian filter to a final resolution of 10-mm full-width at half-maximum in all dimensions for the region-of-interest analysis. Blood flow was calculated by using the Kety autoradiographic method (25). PET CBF measured with H2[15O] underestimates the true CBF at high flow rates owing to the incomplete permeability of the blood-brain barrier to water and therefore was corrected by accounting for the measured permeability–surface area product of water in the brain (26). This correction factor was applied to all PET CBF measurements in this study by using the method of Herscovitch et al (26). PET postprocessing was performed by a physician-scientist (J.J.L., with more than 5 years of experience in PET imaging). PET perfusion images were reviewed for quality assessment by a board-certified neuroradiologist (C.P.D., with more than 10 years of experience in PET imaging).
CBF Analysis
All PET and MR images were coregistered and resectioned by using automated image registration (27). The PET images were coregistered to T1-weighted magnetization-prepared rapid acquisition gradient echo images, which, in turn, were coregistered to the MR perfusion images.
MR qCBF maps were smoothed by using a 10-mm Gaussian convolution kernel to match the 10-mm full-width at half-maximum spatial resolution of PET images. A 5 × 5 grid was created for each section of each registered image by using Matlab. Given the 22-cm field of view, each region of interest was approximately 4.4 × 4.4 cm. Extracerebral tissue was excluded from each region of interest. Finally, the mean qCBF value of each region of interest for MR and PET images were computed by using Matlab in each grid for each section obtaining a broad range of flow values.
Statistical Analysis
Linear regression analysis was performed on each patient’s paired PET and MR imaging CBF data. An additional linear regression analysis was performed on pooled (aggregated) data from all patients to assess variability in the MR imaging versus PET relationship. We compared the slopes, intercepts, and coefficient of determination, r2, from linear regression analysis and mean difference and standard deviations from Bland-Altman analysis of MR and PET data sets. All statistical analysis was performed by using the Matlab software package.
Results
Six men (mean age, 49.7 years ± 7.3 [standard deviation]; age range, 42–62 years) and 12 women (mean age, 42.7 years ± 11.2; age range, 28–71 years) participated in this study. There were no statistically significant differences in age on the basis of sex (P = .2, Student t test). All 18 patients (six men and 12 women; age range, 28–71 years; mean age, 45 years ± 10.4) underwent DSC MR imaging with bookend calibration and H2[15O] PET.
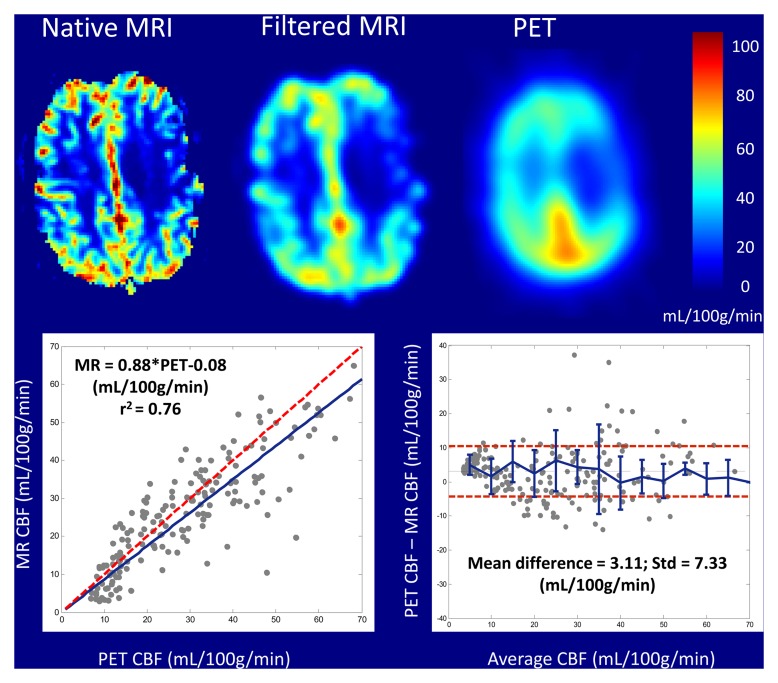
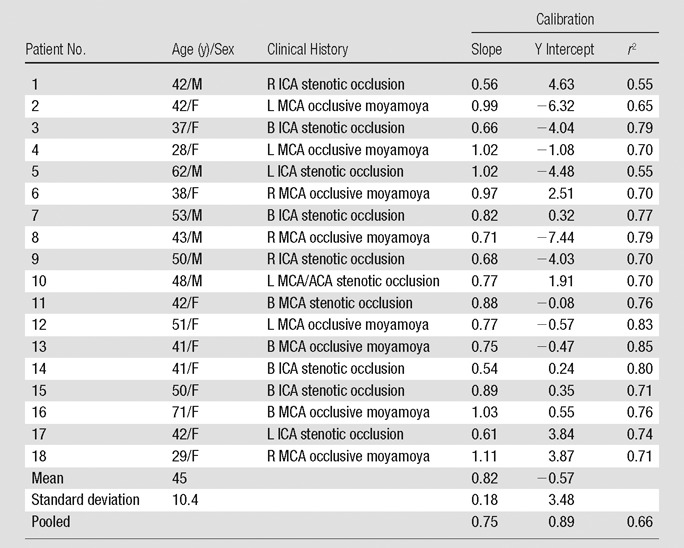
Patient clinical histories were as follows: eight patients had occlusive Moyamoya disease and 10 patients had internal carotid artery occlusions (Table 1). A total of nine patients were excluded from the study for the following reasons: one patient was unable to provide consent, one patient had an aneurysm clip, and seven patients chose not to enroll in the study for unspecified reasons. Figure 1 shows an example of coregistered MR and PET qCBF images from a single section in patient 11, a 42-year-old woman with bilateral stenotic occlusions in the middle cerebral arteries at presentation. MR qCBF images before and after smoothing with a 10-mm Gaussian kernel are shown. All MR postprocessing, including the selection of the arterial input function (AIF), parenchymal white matter, and sagittal sinus in the bookend T1 maps, was performed automatically and without manual intervention. On average there were 228 ± 17 regions of interest for calculating qCBF for each MR and PET image by using the grid approach.
Table 1.
Subject Demographics and Regression Analysis of Bookend MR and PET CBF Data
Note.—ACA = anterior cerebral artery, B = bilateral, ICA = internal carotid artery, L = left, MCA = middle cerebral artery, R = right.
Figure 1:
Coregistered color parametric maps of native bookend MR imaging–, smoothed bookend MR imaging–, and PET-derived qCBF images of a single section in patient 11, a 42-year-old woman with bilateral middle cerebral artery stenoses. Imaging and corresponding linear regression and Bland-Altman analysis demonstrate strong agreement between bookend-calibrated MR imaging and PET CBF data.
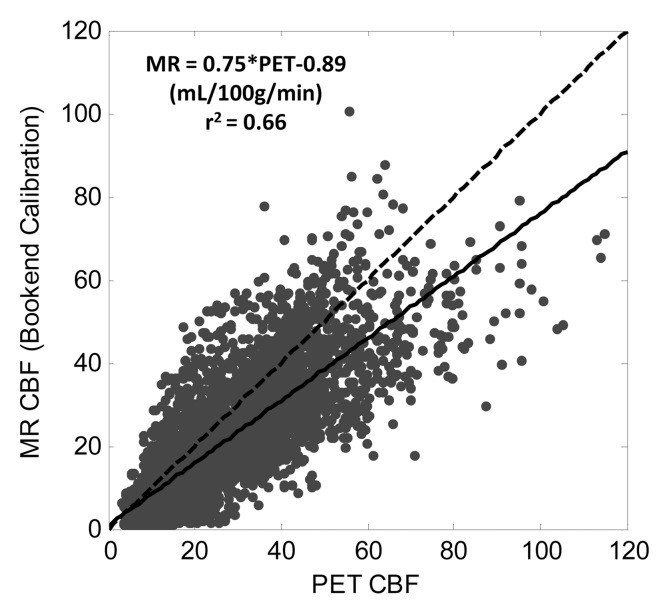
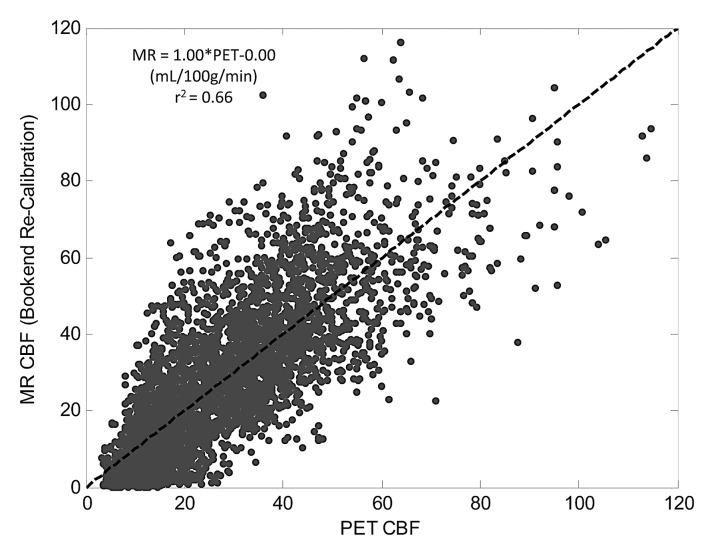
Table 1 shows slopes, intercepts, and coefficient of determination (r2) for PET and MR region of interest qCBF values in all 18 subjects. In each patient, strong linear correlation was shown between MR and PET data sets (r2 > 0.55). The linear coefficient of determination for each patient varied separately between 0.55 and 0.85 and was statistically significant in all cases (P < .01). Mean slope and intercepts were 0.82 mL/100 g/min ± 0.18 and −0.57 mL/100 g/min ± 3.48, respectively. In addition, the point, slope, and r2 value for the pooled patient data set was 0.75, 20.89 mL/100 g/min, and 0.66, respectively. Figure 2a shows a plot of cumulative patient data with the fitted regression line for the bookend-calibrated MR data.
Figure 2a:
Linear regression of pooled data comparing MR and PET CBF (in mL/100 g/min) across 18 subjects by using (a) bookend calibration and (b) global recalibration of average white matter (WM) CBF to 22 mL/100 g/min. Line of unity is dashed and fitted line is solid. Fitted regression coefficients were significant in all cases (P < .01).
There were no significant differences in the derived regression slopes on the basis of sex (P = .3, Student t test). However, in patients with different clinical histories—Moyamoya disease versus occlusive carotid stenosis—significant differences were demonstrated in slopes of PET versus MR imaging data with the Student t test. Occlusive carotid stenosis and Moyamoya groups had slopes of 0.74 and 0.92, respectively (P = .02, Student t test).
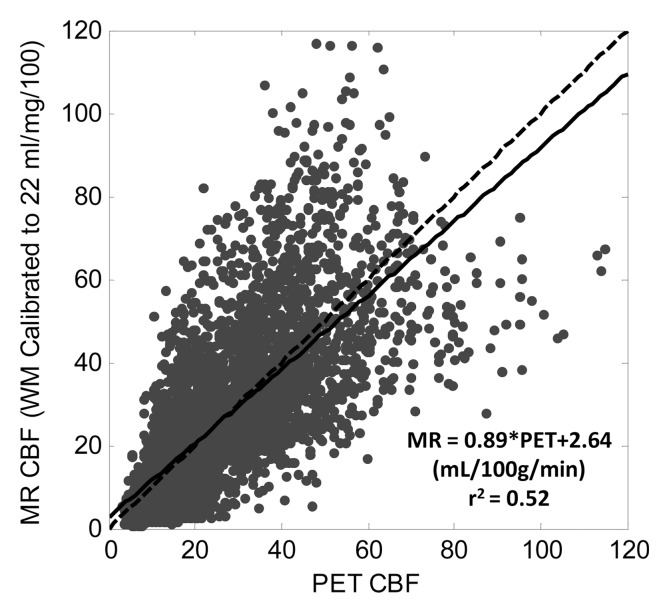
Calibrating average white matter qCBF to 22 mL/100 g/min showed weaker correlations in the pooled data (r2 = 0.52; slope = 0.89) as well as greater variability in linear relationship on a subject by subject basis (Table 2). The mean slope was 1.07 ± 0.41 with slopes ranging from 0.46 to 2.3 indicating less predictability in the MR qCBF underestimation error using this quantitation technique. Figure 2b shows a plot of pooled patient data with the fitted regression line.
Table 2.
Comparison of Two Global Parameter Recalibrations of MR CBF Data
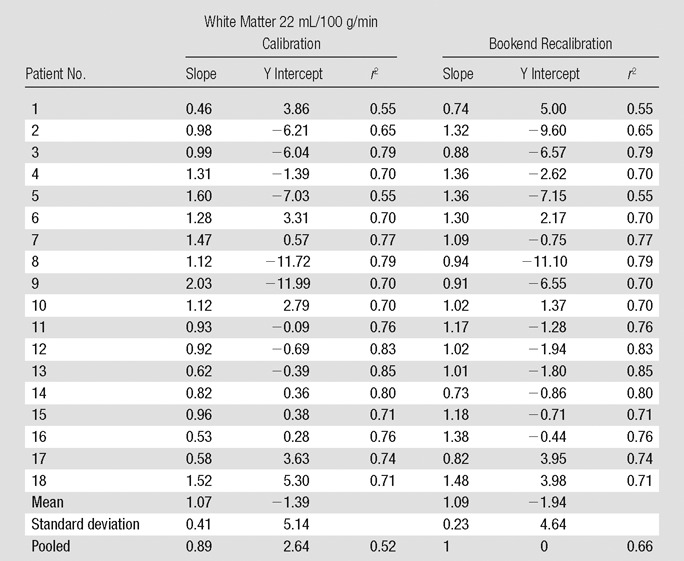
Figure 2b:
Linear regression of pooled data comparing MR and PET CBF (in mL/100 g/min) across 18 subjects by using (a) bookend calibration and (b) global recalibration of average white matter (WM) CBF to 22 mL/100 g/min. Line of unity is dashed and fitted line is solid. Fitted regression coefficients were significant in all cases (P < .01).
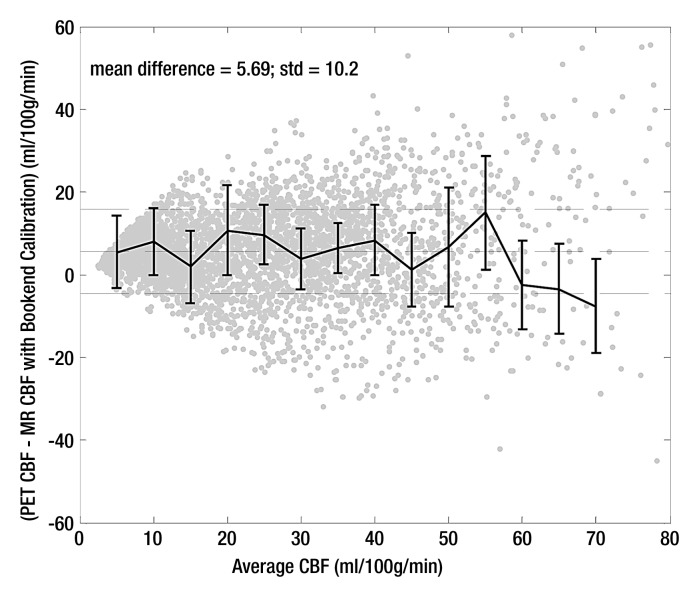
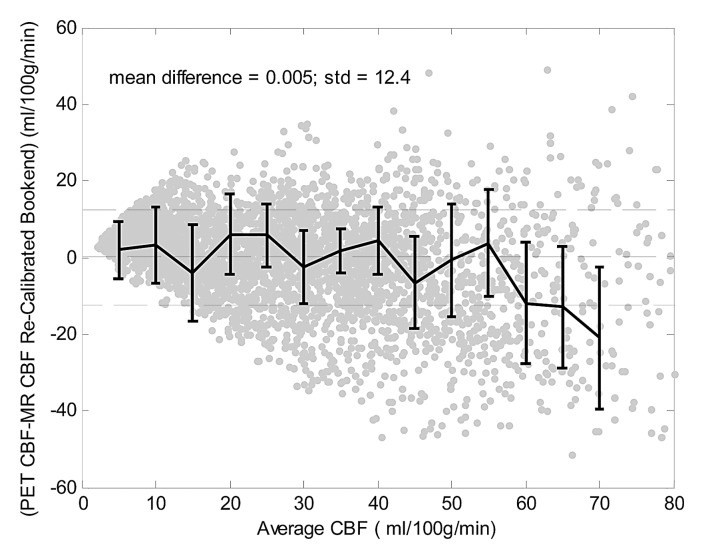
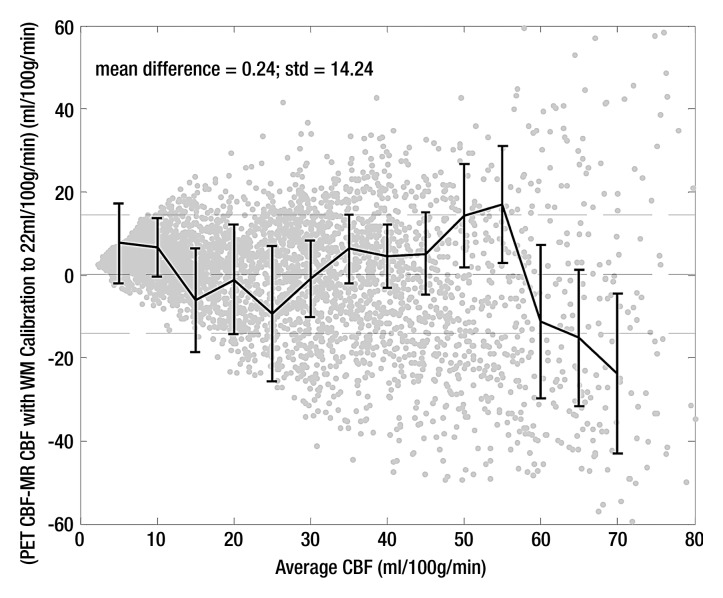
Bland-Altman analysis (Fig 3) demonstrated stronger agreement between MR and PET CBF measurements when using the bookend calibration as opposed to a global scaling factor corresponding to a white matter value of 22 mL/100 g/min. The mean bias between bookend-calibrated MR and PET was 5.69 mL/100 g/min ± 10.2 over a range of 0–80 mL/100 g/min versus 0.24 mL/100 g/min ± 14.24 for global white matter scaling. To demonstrate the predictability of the mean bias introduced by bookend calibration, we empirically rescaled each patient’s MR imaging qCBF data by the inverse slope of pooled data, 1.33, and combined the results into a new pooled data set (Table 2) with linear regression analysis demonstrating slope of 1, intercept of 0, and r2 of 0.66 (Fig 4a). The Bland-Altman analysis demonstrated mean bias of 0.005 mL/100 g/min ± 12.4 (Fig 4b).
Figure 3a:
Bland-Altman analysis of pooled data comparing agreement between MR and PET CBF by using (a) bookend calibration and (b) global recalibration of average white matter (WM) CBF to 22 mL/100 g/min. Center dashed line shows bias with 1 standard deviation above and below.
Figure 4a:
Recalibrated bookend data demonstrate the predictability of the mean bias introduced by the bookend technique. (a) Linear regression analysis of recalibrated data demonstrates slope of 1.0 and intercept of 0.0 mL/100 g/min. (b) Bland-Altman analysis demonstrates mean bias of 0.005 mL/100 g/min and standard deviation of 12.4 mL/100 g/min.
Figure 4b:
Recalibrated bookend data demonstrate the predictability of the mean bias introduced by the bookend technique. (a) Linear regression analysis of recalibrated data demonstrates slope of 1.0 and intercept of 0.0 mL/100 g/min. (b) Bland-Altman analysis demonstrates mean bias of 0.005 mL/100 g/min and standard deviation of 12.4 mL/100 g/min.
Figure 3b:
Bland-Altman analysis of pooled data comparing agreement between MR and PET CBF by using (a) bookend calibration and (b) global recalibration of average white matter (WM) CBF to 22 mL/100 g/min. Center dashed line shows bias with 1 standard deviation above and below.
Discussion
In this study we validated the bookend approach for quantifying CBF against H2[15O] PET in a study of 18 patients with angiographically confirmed cerebrovascular occlusive disease. With data pooled from all subjects, MR imaging CBF values displayed excellent linearity with the PET CBF measurements. In addition, the variability in the slopes of bookend-calibrated MR versus PET data set was significantly smaller than an alternative, population-averaged calibration method, indicating that errors in absolute CBF quantitation are more predictable with the bookend approach. The population-average scaling scheme of 22 mL/100 g/min (22) in white matter produced a larger slope of 0.89 for MR-PET pooled data; however the correlation was significantly weaker and variability was higher in Bland-Altman analysis, indicating less predictability with this technique.
This result closely corroborates the findings of Mukherjee et al (10), who reported that this population-based approach fails in patient populations because of the wide variability in white matter qCBF. The reduced variability from bookend calibration allowed rescaling PET-MR data with the inverse slope of the pooled data, 1.33, demonstrating unity slope in regression analysis, reduced mean bias, and less variability in PET-MR agreement. These data support the conclusion that bookend calibration improves absolute CBF measurements in DSC MR imaging data sets by reducing the variability in the underestimation bias.
Prior studies that compared PET and DSC MR imaging CBF have had varying levels of success. Lin et al (7) applied a global calibration factor derived from averaged venous outflow in a healthy normal population to a subgroup of patients with unilateral carotid artery occlusion. This approach improved MR-PET CBF correlation in the pooled patient group (r2 = 0.17 to r2 = 0.64), but also incurred a large y-intercept (20.1 mL/100 g/min). In a study by Tanaka et al (28) MR and PET CBF values were calculated relative to an internal control and compared between the two modalities; however no significant correlation was found. Ibaraki et al (29) found significant correlations when MR and PET CBF were expressed as relative to white matter; however quantitation was not successful owing to difficulties in obtaining a reliable scaling for the AIF.
In fact, errors in AIF selection and/or measurement and delay and dispersion effects have previously been suggested as inherent weaknesses in DSC MR imaging perfusion techniques that would make it unreliable in the setting of acute stroke. However, Takasawa et al (11) found that even in an acute stroke setting MR and PET CBF values showed strong correlations when they were normalized by the mean on a patient-by-patient basis. These results suggested that a patient-specific scaling factor may at least partially correct for AIF-incurred errors. Our usage of a patient-specific, T1-derived calibration factor offers a potential solution to this problem. Furthermore, our utilization of an automated AIF finding algorithm has been shown to choose arterial voxels with smaller partial volume artifact than manually chosen AIFs (30). However, the distortion of the AIF bolus shape due to dispersion in the feeding vessel is still a source of error (13) that is not corrected for in the bookend approach.
Recent work (31–34) has shown promising results for reducing these errors through selected localized AIFs near the perfused capillary bed and AIF correction models that utilize more accurate bolus arrival times and reduce delay-dependent dispersion. Our study showed a difference in MR-PET correlation slopes based on clinical indication—carotid versus intracranial vessel occlusions—suggesting the need for the incorporation of such models. In fact, in a separate study, a subgroup of patients with poor MR-PET CBF correlation demonstrated improved agreement upon application of AIF delay and dispersion corrections (33). Similar postprocessing techniques are not precluded by the bookend perfusion scans, as both correct for different imperfections in the data. Therefore, we anticipate the inclusion of these methods in future iterations of this technology.
This work was not without limitations. For example cortical “blooming” artifacts in gray matter territories and signal dropout near frontal and ethmoid sinuses and near the internal auditory canal are well known phenomena limiting gradient-recalled-echo EPI sequences (34,35). Utilization of a spin-echo EPI protocol with the bookend approach may limit these effects as was shown in a recent study by Carroll et al (18). We believe the future direction of the bookend technique lies in this approach. Finally, no patients were imaged in the “acute” phase of a stroke, therefore we cannot comment on the usefulness of our technique in that setting. However many of our subjects had cerebrovascular occlusive disease, exposing our analysis to similar effects from vascular delays and dispersion. We believe the strong between-patient correlations obtained through the bookend calibration demonstrate its validity in a patient setting, corroborate the findings of Takasawa et al (11), and indicate a need for evaluating bookend perfusion values in the setting of acute stroke.
In conclusion, we have found that bookend calibration improves quantitation of of cerebral blood flow using DSC-MR imaging in the setting of cerebrovascular occlusive disease by reducing the variability in patient-to-patient agreement between MR and PET data sets.
Advances in Knowledge.
• Parenchymal T1 changes and water compartmentalization modeling can be used to improve dynamic susceptibility contrast (DSC) MR imaging quantitation of cerebral blood flow (CBF) in a clinical setting of cerebrovascular occlusive disease.
• Patient-averaged calibration of perfusion values does not reflect the true perfusion values.
• DSC MR imaging with bookend calibration CBF provided quantitative values in a setting of altered intracerebral hemodynamics.
Implications for Patient Care.
• Quantitative MR imaging perfusion will allow for longitudinal study in individual patients.
• A widely available quantitative DSC MR imaging perfusion technique can replace existing relative DSC MR imaging perfusion studies.
Disclosures of Conflicts of Interest: P.V. No relevant conflicts of interest to disclose. J.J.L. No relevant conflicts of interest to disclose. J.M.S. No relevant conflicts of interest to disclose. C.P.D. Financial activities related to the present article: none to disclose. Financial activities not related to the present article: board memberships, W.L. Gore and Associates and Pulse Therapeutics. Other relationships: none to disclose. T.J.C. Financial activities related to the present article: none to disclose. Financial activities not related to the present article: patent, USPTO. Other relationships: none to disclose.
Supplementary Material
Acknowledgments
The authors thank the staff of the CCIR facility for their assistance with MR and PET measurements.
Received April 23, 2012; revision requested May 30; revision received July 19; accepted August 30; final version accepted September 11.
Funding: This research was supported by the National Institutes of Health (grants R01 NS0493395, T32 EB005170, 10PRE 4280071, 0515456Z, 0655758Z, NS05163, NINDS RO1 51631).
Abbreviations:
- AIF
- arterial input function
- CBF
- cerebral blood flow
- DSC
- dynamic susceptibility contrast
- EPI
- echo-planar imaging
- IR
- inversion recovery
- LL
- Look-Locker
- qCBF
- quantitative CBF
References
- 1.Powers WJ. Cerebral hemodynamics in ischemic cerebrovascular disease. Ann Neurol 1991;29(3):231–240 [DOI] [PubMed] [Google Scholar]
- 2.Yanagihara T, Wahner HW. Cerebral blood flow measurement in cerebrovascular occlusive diseases. Stroke 1984;15(5):816–822 [DOI] [PubMed] [Google Scholar]
- 3.Jones TH, Morawetz RB, Crowell RM, et al. Thresholds of focal cerebral ischemia in awake monkeys. J Neurosurg 1981;54(6):773–782 [DOI] [PubMed] [Google Scholar]
- 4.Marcoux FW, Morawetz RB, Crowell RM, DeGirolami U, Halsey JH., Jr Differential regional vulnerability in transient focal cerebral ischemia. Stroke 1982;13(3):339–346 [DOI] [PubMed] [Google Scholar]
- 5.Heiss WD, Rosner G. Functional recovery of cortical neurons as related to degree and duration of ischemia. Ann Neurol 1983;14(3):294–301 [DOI] [PubMed] [Google Scholar]
- 6.Latchaw RE, Yonas H, Hunter GJ, et al. Guidelines and recommendations for perfusion imaging in cerebral ischemia: a scientific statement for healthcare professionals by the writing group on perfusion imaging, from the Council on Cardiovascular Radiology of the American Heart Association. Stroke 2003;34(4):1084–1104 [DOI] [PubMed] [Google Scholar]
- 7.Lin W, Celik A, Derdeyn C, et al. Quantitative measurements of cerebral blood flow in patients with unilateral carotid artery occlusion: a PET and MR study. J Magn Reson Imaging 2001;14(6):659–667 [DOI] [PMC free article] [PubMed] [Google Scholar]
- 8.Ostergaard L, Weisskoff RM, Chesler DA, Gyldensted C, Rosen BR. High resolution measurement of cerebral blood flow using intravascular tracer bolus passages. Part I: Mathematical approach and statistical analysis. Magn Reson Med 1996;36(5):715–725 [DOI] [PubMed] [Google Scholar]
- 9.Ostergaard L, Johannsen P, Høst-Poulsen P, et al. Cerebral blood flow measurements by magnetic resonance imaging bolus tracking: comparison with [(15)O]H2O positron emission tomography in humans. J Cereb Blood Flow Metab 1998;18(9):935–940 [DOI] [PubMed] [Google Scholar]
- 10.Mukherjee P, Kang HC, Videen TO, McKinstry RC, Powers WJ, Derdeyn CP. Measurement of cerebral blood flow in chronic carotid occlusive disease: comparison of dynamic susceptibility contrast perfusion MR imaging with positron emission tomography. AJNR Am J Neuroradiol 2003;24(5):862–871 [PMC free article] [PubMed] [Google Scholar]
- 11.Takasawa M, Jones PS, Guadagno JV, et al. How reliable is perfusion MR in acute stroke? validation and determination of the penumbra threshold against quantitative PET. Stroke 2008;39(3):870–877 [DOI] [PubMed] [Google Scholar]
- 12.Sakaie KE, Shin W, Curtin KR, McCarthy RM, Cashen TA, Carroll TJ. Method for improving the accuracy of quantitative cerebral perfusion imaging. J Magn Reson Imaging 2005;21(5):512–519 [DOI] [PubMed] [Google Scholar]
- 13.Calamante F, Gadian DG, Connelly A. Delay and dispersion effects in dynamic susceptibility contrast MRI: simulations using singular value decomposition. Magn Reson Med 2000;44(3):466–473 [DOI] [PubMed] [Google Scholar]
- 14.Shin W, Cashen TA, Horowitz SW, Sawlani R, Carroll TJ. Quantitative CBV measurement from static T1 changes in tissue and correction for intravascular water exchange. Magn Reson Med 2006;56(1):138–145 [DOI] [PubMed] [Google Scholar]
- 15.Shin W, Horowitz S, Ragin A, Chen Y, Walker M, Carroll TJ. Quantitative cerebral perfusion using dynamic susceptibility contrast MRI: evaluation of reproducibility and age- and gender-dependence with fully automatic image postprocessing algorithm. Magn Reson Med 2007;58(6):1232–1241 [DOI] [PubMed] [Google Scholar]
- 16.Kuppusamy K, Lin W, Cizek GR, Haacke EM. In vivo regional cerebral blood volume: quantitative assessment with 3D T1-weighted pre- and postcontrast MR imaging. Radiology 1996;201(1):106–112 [DOI] [PubMed] [Google Scholar]
- 17.Moseley ME, Chew WM, White DL, et al. Hypercarbia-induced changes in cerebral blood volume in the cat: a 1H MRI and intravascular contrast agent study. Magn Reson Med 1992;23(1):21–30 [DOI] [PubMed] [Google Scholar]
- 18.Carroll TJ, Horowitz S, Shin W, et al. Quantification of cerebral perfusion using the “bookend technique”: an evaluation in CNS tumors. Magn Reson Imaging 2008;26(10):1352–1359 [DOI] [PMC free article] [PubMed] [Google Scholar]
- 19.Sawlani RN, Raizer J, Horowitz SW, et al. Glioblastoma: a method for predicting response to antiangiogenic chemotherapy by using MR perfusion imaging—pilot study. Radiology 2010;255(2):622–628 [DOI] [PMC free article] [PubMed] [Google Scholar]
- 20.Aviv RI, Francis PL, Tenenbein R, et al. Decreased frontal lobe gray matter perfusion in cognitively impaired patients with secondary-progressive multiple sclerosis detected by the bookend technique. AJNR Am J Neuroradiol 2012;33(9):1779–1785 [DOI] [PMC free article] [PubMed] [Google Scholar]
- 21.Shah MK, Shin W, Parikh VSet al. Quantitative cerebral perfusion using MRI: initial evaluation in ischemic stroke patients. Stroke (in press) [Google Scholar]
- 22.Ostergaard L, Sorensen AG, Kwong KK, Weisskoff RM, Gyldensted C, Rosen BR. High resolution measurement of cerebral blood flow using intravascular tracer bolus passages. Part II: Experimental comparison and preliminary results. Magn Reson Med 1996;36(5):726–736 [DOI] [PubMed] [Google Scholar]
- 23.Leenders KL, Perani D, Lammertsma AA, et al. Cerebral blood flow, blood volume and oxygen utilization. Normal values and effect of age. Brain 1990;113(Pt 1):27–47 [DOI] [PubMed] [Google Scholar]
- 24.Wienhard K, Dahlbom M, Eriksson L, et al. The ECAT EXACT HR: performance of a new high resolution positron scanner. J Comput Assist Tomogr 1994;18(1):110–118 [PubMed] [Google Scholar]
- 25.Videen TO, Perlmutter JS, Herscovitch P, Raichle ME. Brain blood volume, flow, and oxygen utilization measured with 15O radiotracers and positron emission tomography: revised metabolic computations. J Cereb Blood Flow Metab 1987;7(4):513–516 [DOI] [PubMed] [Google Scholar]
- 26.Herscovitch P, Raichle ME, Kilbourn MR, Welch MJ. Positron emission tomographic measurement of cerebral blood flow and permeability-surface area product of water using [15O]water and [11C]butanol. J Cereb Blood Flow Metab 1987;7(5):527–542 [DOI] [PubMed] [Google Scholar]
- 27.Woods RP, Grafton ST, Holmes CJ, Cherry SR, Mazziotta JC. Automated image registration: I. General methods and intrasubject, intramodality validation. J Comput Assist Tomogr 1998;22(1):139–152 [DOI] [PubMed] [Google Scholar]
- 28.Tanaka Y, Nariai T, Nagaoka T, et al. Quantitative evaluation of cerebral hemodynamics in patients with moyamoya disease by dynamic susceptibility contrast magnetic resonance imaging: comparison with positron emission tomography. J Cereb Blood Flow Metab 2006;26(2):291–300 [DOI] [PubMed] [Google Scholar]
- 29.Ibaraki M, Ito H, Shimosegawa E, et al. Cerebral vascular mean transit time in healthy humans: a comparative study with PET and dynamic susceptibility contrast-enhanced MRI. J Cereb Blood Flow Metab 2007;27(2):404–413 [DOI] [PubMed] [Google Scholar]
- 30.Carroll TJ, Rowley HA, Haughton VM. Automatic calculation of the arterial input function for cerebral perfusion imaging with MR imaging. Radiology 2003;227(2):593–600 [DOI] [PubMed] [Google Scholar]
- 31.Lorenz C, Benner T, Chen PJ, et al. Automated perfusion-weighted MRI using localized arterial input functions. J Magn Reson Imaging 2006;24(5):1133–1139 [DOI] [PubMed] [Google Scholar]
- 32.Willats L, Christensen S, Ma HK, Donnan GA, Connelly A, Calamante F. Validating a local arterial input function method for improved perfusion quantification in stroke. J Cereb Blood Flow Metab 2011;31(11):2189–2198 [DOI] [PMC free article] [PubMed] [Google Scholar]
- 33.Mouannes-Srour JJ, Shin W, Ansari SA, et al. Correction for arterial-tissue delay and dispersion in absolute quantitative cerebral perfusion DSC MR imaging. Magn Reson Med 2012;68(2):495–506 [DOI] [PMC free article] [PubMed] [Google Scholar]
- 34.Weisskoff RM, Zuo CS, Boxerman JL, Rosen BR. Microscopic susceptibility variation and transverse relaxation: theory and experiment. Magn Reson Med 1994;31(6):601–610 [DOI] [PubMed] [Google Scholar]
- 35.Sorensen AG, Reimer P. Cerebral MR perfusion imaging: principles and current applications. New York: Thieme, 2001 [Google Scholar]
Associated Data
This section collects any data citations, data availability statements, or supplementary materials included in this article.


