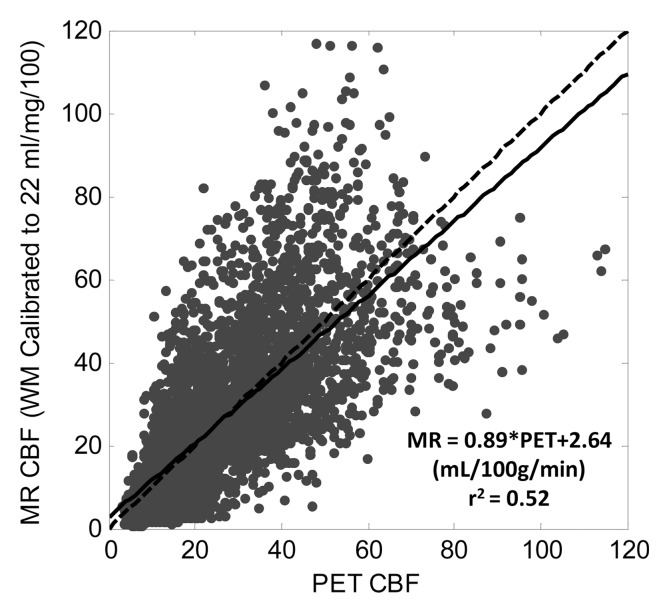
Figure 2b:
Linear regression of pooled data comparing MR and PET CBF (in mL/100 g/min) across 18 subjects by using (a) bookend calibration and (b) global recalibration of average white matter (WM) CBF to 22 mL/100 g/min. Line of unity is dashed and fitted line is solid. Fitted regression coefficients were significant in all cases (P < .01).

