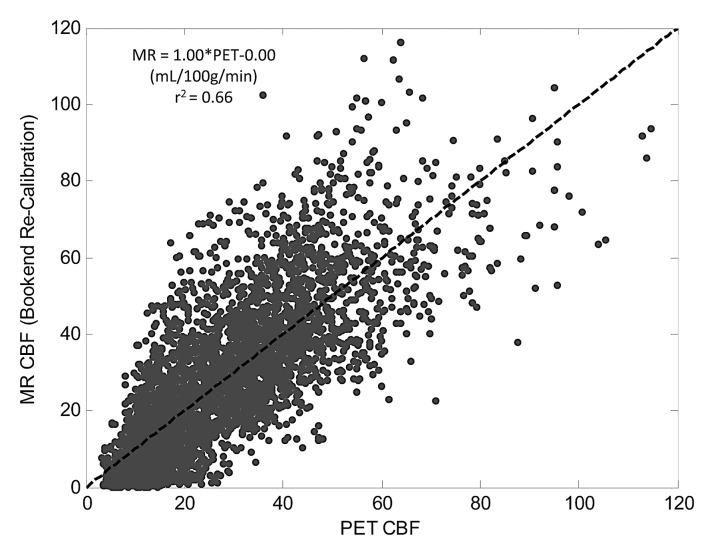
Figure 4a:
Recalibrated bookend data demonstrate the predictability of the mean bias introduced by the bookend technique. (a) Linear regression analysis of recalibrated data demonstrates slope of 1.0 and intercept of 0.0 mL/100 g/min. (b) Bland-Altman analysis demonstrates mean bias of 0.005 mL/100 g/min and standard deviation of 12.4 mL/100 g/min.

