Abstract
Many pathological processes cause marked changes in the mechanical properties of tissue. Magnetic Resonance Elastography (MRE) is a non-invasive MRI based technique for quantitatively assessing the mechanical properties of tissues in vivo. MRE is performed by using a vibration source to generate low frequency mechanical waves in tissue, imaging the propagating waves using a phase contrast MRI technique, and then processing the wave information to generate quantitative images showing mechanical properties such as tissue stiffness. Since its first description in 1995, published studies have explored many potential clinical applications including brain, thyroid, lung, heart, breast, and skeletal muscle imaging. However, the best-documented application to emerge has been the use of MRE to assess liver disease. Multiple studies have demonstrated that there is a strong correlation between MRE-measured hepatic stiffness and the stage of fibrosis at histology. The emerging literature indicates that MRE can serve as a safer, less expensive, and potentially more accurate alternative to invasive liver biopsy which is currently the gold standard for diagnosis and staging of liver fibrosis. This review describes the basic principles, technique of performing a liver MRE, analysis and calculation of stiffness, clinical applications, limitations, and potential future applications.
Keywords: Magnetic Resonance Elastography (MRE), Liver, Fibrosis, Technique, Analysis, Clinical applications
INTRODUCTION
Liver fibrosis is a common result of many chronic liver diseases and if progressive leads to cirrhosis. Cirrhosis has potential complications that include liver failure, portal hypertension, varices, hepatocellular carcinoma (HCC), and hepatic encephalopathy. There is increasing evidence that fibrosis of liver is reversible at early stages and therefore early detection of liver fibrosis may be helpful in the management of chronic liver diseases (1–4). The treatment of patients with hepatic fibrosis often targets the underlying disease process leading to fibrosis. Knowledge of the extent of liver fibrosis is critical for assessing prognosis and determining clinical management in chronic liver disease due to viral hepatitis. Active antiviral therapy is strongly recommended in chronic hepatitis B patients with cirrhosis and therefore it may be meaningful to clinicians to detect early cirrhosis for determining timing of antiviral therapy (5, 6). In chronic hepatitis C, treatment is often advocated for those with at least moderate stage of fibrosis but may not be indicated in those who have minimal or absent fibrosis (7, 8). Moreover, practice guidelines for treatment of chronic hepatitis C infection with recently approved protease inhibitor drugs require an assessment of fibrosis staging in order to determine the recommended duration of therapy with these effective but very expensive drugs (9, 10). Patients with fibrosis that has progressed to cirrhosis are recommended to undergo screening for hepatocellular carcinoma and varices (11).
The conventional standard for the diagnosing and staging liver fibrosis is percutaneous biopsy, which is invasive, expensive, has poor patient acceptance, is prone to interobserver variability and sampling errors, has poor repeatability, and carries a risk of complications estimated at 3% with a mortality rate of 0.03% (12–15). Many physicians are reluctant to recommend liver biopsy in asymptomatic patients with progressive hepatic fibrosis due to these concerns. Therefore, tests for non-invasive evaluation of liver fibrosis have been explored, including serum markers, transient elastography (Fibroscan) and MRI based functional imaging methods. Serum markers, although attractive as non-invasive, have variable accuracies for the diagnosis of liver fibrosis (16). Transient elastography (Fibroscan, Echosens) is an ultrasound based technique for measuring liver stiffness and it has been shown that there is a strong correlation between this parameter and increasing degrees of fibrosis (17, 18). A number of MRI-based techniques have been evaluated for assessing hepatic fibrosis, including diffusion weighted imaging (DWI), perfusion MRI, MR spectroscopy (MRS), and MR Elastography (MRE) (19–22). MRE is an MRI-based method for quantitatively imaging the direct consequence of liver fibrosis – increased stiffness of the hepatic parenchyma (23–28). The technique provides quantitative maps of tissue stiffness over large regions of the liver, whereas transient ultrasound-based techniques provide localized spot measurements at limited depth in the liver in areas where there is an acoustic window. MRE is much less operator dependent than ultrasound-based techniques. The MRE sequence can require less than a minute of acquisition time. Therefore, MRE can be readily included in standard abdominal MRI protocols which can provide a comprehensive evaluation of the liver, including assessment of fat content, presence of focal disease, and of complications of chronic liver disease such as varices. MRE is has a low rate of technical failure compared to transient ultrasound elastography. The most frequent reason for technical failure in MRE is hepatic iron overload, which can decrease hepatic signal intensity in gradient echo based MRE sequences to unacceptably low levels. Despite this limitation, MRE is the only non-invasive technique that has been able to stage liver fibrosis or diagnose mild fibrosis with reasonable accuracy as reported by a recent systemic review of imaging techniques for diagnosis and staging of hepatic fibrosis (29). Studies have shown that MRE is highly reproducible in both volunteers and in patients with liver fibrosis (30–32). MRE therefore is a promising tool for detecting and staging liver fibrosis and for longitudinal assessment of response to antiviral or antifibrotic therapy.
Basic Principles of MRE
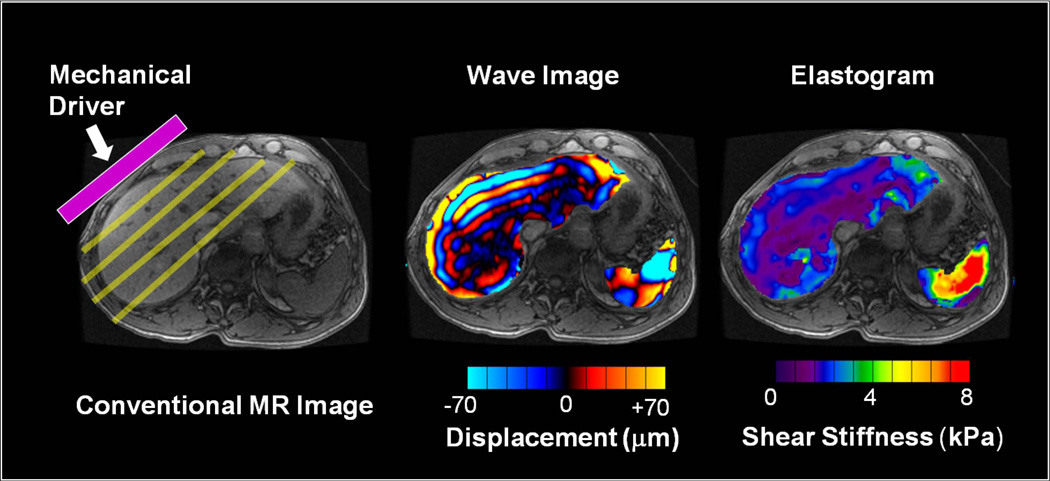
MRE uses propagating mechanical shear waves (range, 20–200 Hz) to probe the mechanical properties of tissues (21). Such waves propagate more rapidly in stiffer tissue and more slowly in softer tissue. If the waves are applied continuously, the speed of propagation is reflected in the wavelength. Hence, as tissue stiffness increases, the wavelength becomes longer. Low frequency mechanical shear waves are generated with a special acoustic driver system and propagated into the body. A modified phase-contrast pulse sequence with cyclic motion encoding gradients synchronized to the mechanical waves is used to image the micron-level displacements associated with wave propagation. The imaging process can be accomplished in one or more breath-holds and yields images depicting the pattern of propagating waves in the liver. The wave images are then processed with specialized software (called an inversion algorithm) to generate quantitative cross-sectional images depicting the stiffness of tissue. The tissues with shear waves of longer wavelengths are represented as areas of higher stiffness as compared to those with shorter wavelengths. Hence, MRE is a three step technique: 1) generating mechanical waves in tissue; 2) imaging the waves with a special MRI sequence, and 3) processing the wave information to generate elastograms, which are images that quantitatively depict tissue stiffness. (Fig 1).
Fig 1.
MRE is performed in three steps. (a) A source of vibration is placed on the surface of the body to generate mechanical waves in the tissues of interest. (b) A special MRE pulse sequence with synchronized motion encoding gradients is used to image the micron-level cyclic displacements caused by the propagating waves. The wavelength of the shear waves is longer in stiffer tissues and shorter in softer tissues. (c) The wave images are then automatically processed with an “inversion algorithm” to create quantitative images depicting the stiffness of tissue. (For these illustrations, the portions of the wave image and elastogram corresponding to liver and spleen have been superimposed on a conventional MR image.)
Performing MR Elastography of Liver
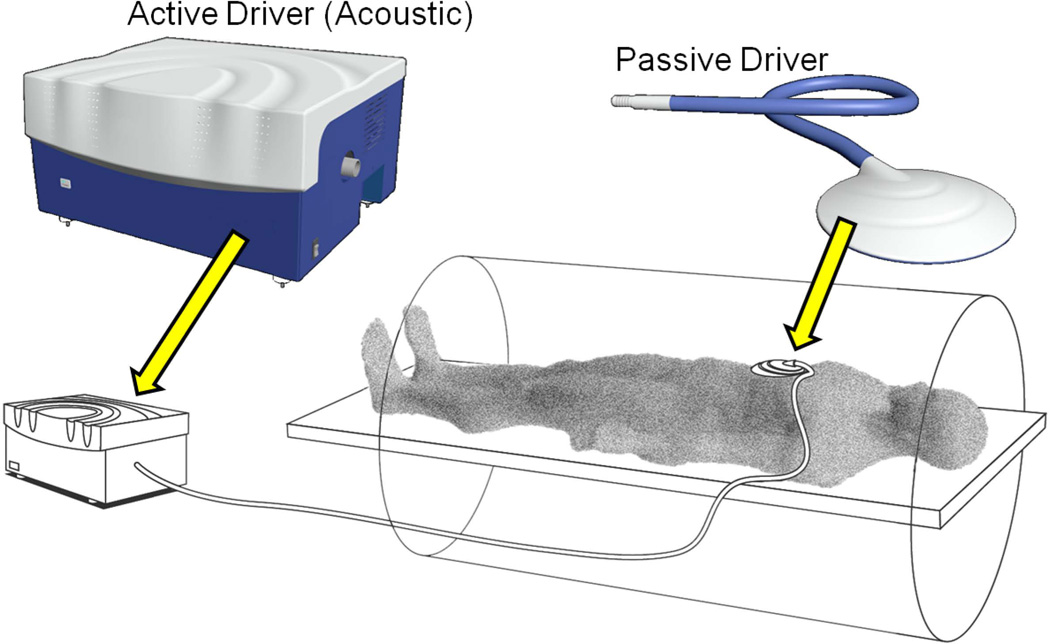
The technique can be readily implemented on a conventional MR system with added hardware to generate mechanical waves, and special software for acquisition and processing. In commercially-available implementations of MRE, the hardware typically consists of an active acoustic driver, located outside the magnet, which is coupled via plastic tubing to a disc-shaped non-metallic passive driver that is placed that is placed against the right anterior chest wall overlying the liver (Fig 2) and held in place with an elastic strap around the body (Fig 3). For evaluating the liver, a continuous acoustic vibration at typically 60Hz is transmitted into the abdomen via the passive driver. The applied vibrations are well tolerated and do not cause any discomfort.
Fig 2.
Diagram showing typical positioning of the mechanical driver over the right lobe of the liver with its center approximately at the level of xiphisternum. The location is chosen so that the largest cross-section of the liver is directly under the passive driver to ensure good illumination of liver during breath holds at the end of expiration.
Fig 3.
Illustration of a driver system for clinical hepatic MRE. The source of mechanical waves is an “active driver” device that can be located outside the scanner room. Pressure waves are transmitted to a non-metallic “passive driver”, placed in contact with the body, via a flexible air-filled plastic tube. A flexible membrane on the surface of the passive driver conducts the vibrations into the body, to generate propagating shear waves.
MR Elastography Sequence
Depending on the specific application, the phase-contrast MRE sequence may be based on gradient-recalled echo (GRE), spin echo (SE) or echo planar imaging (EPI) sequences, with added cyclic motion-encoding gradients (MEGs) which allow shear waves with amplitudes in the micron range to be readily imaged. The MEGs are imposed along a specific direction and the applied mechanical waves are synchronized via trigger pulses provided by the pulse sequence. In the resulting wave images, phase shifts caused by the cyclic motion of the spins in the presence of these MEGs provide snapshots of the mechanical waves propagating within the tissue. By adjusting the phase relationship between the mechanical excitation and the oscillating MEGs, wave images can be obtained for various phases of the repetitive wave cycle. Wave images at four evenly-spaced time points over the motion cycle are typically obtained.
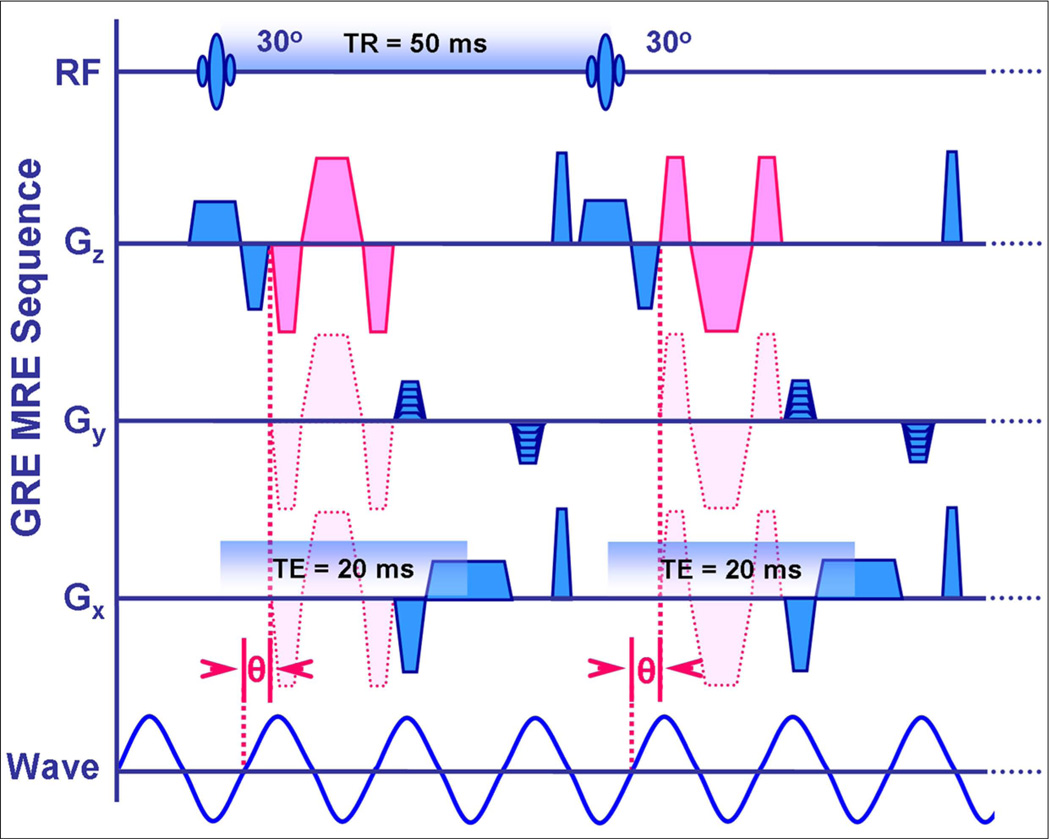
The MRE sequence that is currently most commonly used for clinical hepatic applications (Fig 4) is a modified gradient echo (GRE) sequence with a MEG imposed along the longitudinal axis of the body (z direction). Two to four axial image sections are typically imaged through the widest transverse dimension of the liver. Typical sequence parameters are as follows: TR/TE= 50/20ms; FOV= 30–48cm; matrix= 256× 64; NEX=1; phase offsets=4; band width= 33 KHz; slice thickness 6–10mm. Using parallel imaging with an acceleration factor of 2, each section can be acquired with an acquisition time of 16 seconds. The MRE technique has been successfully implemented on MRI systems from 1.5T to 7T. There is no known physical basis for measured mechanical properties to depend on magnetic field strength and preliminary studies have shown that in vivo MRE measurements obtained on systems from different manufacturers are highly-comparable (33).
Fig 4.
Schematic showing a 2-D gradient echo-based MR elastography sequence. Sensitivity to cyclic tissue motion caused by wave propagation is achieved by adding motion encoding gradients (MEGs) that are synchronized with the applied vibration throughout image acquisition. The MEGs (shown in pink) can be applied to sensitize the sequence to cyclic tissue motion in the x, y, or z directions, as shown. The phase relationship (θ) between the MEGs and the applied waves can be adjusted in steps to acquire wave images at different phases of the cyclic motion.
Generating Elastograms
After the acquisition is complete, the wave images are automatically processed by the scanner to generate images that depict tissue stiffness- called elastograms. Several different types of inversion algorithms have been used, including spatial frequency estimation, and analytic solutions to the wave equation (34, 35). These quantitatative images typically depict shear stiffness in units of kilopascals (kPa), and may be displayed in a gray scale or with a color scale (36) (Fig 5).
Fig 5.
Magnitude image, wave image, and elastogram of the liver in a healthy volunteer. (a) The magnitude image obtained with the MRE sequence shows signal loss and blurring due to the effects of the applied MEGs, but is useful for identifying the anatomic location of the corresponding elastogram. (b) The phase image obtained with the MRE sequence shows the pattern of propagating waves. (c) The elastogram obtained by processing the wave information shows the stiffness of tissues in the same cross-section on a quantitative color scale, depicting shear stiffness from 0 to 8 kPa. The stiffness values reported by the elastogram are only valid in regions that have sufficient MRI signal as seen in the magnitude image, and sufficient wave amplitude as seen in the wave image.
Analysis of Elastograms
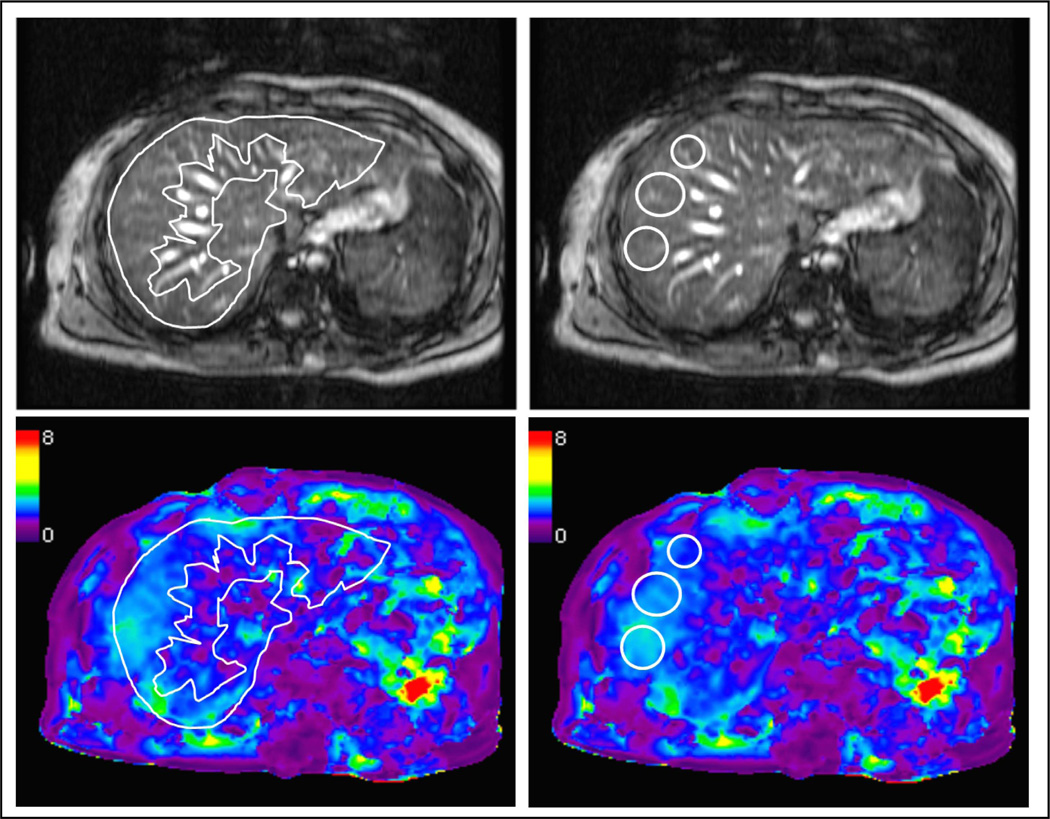
Liver stiffness is typically assessed by drawing regions of interest (ROI’s) in the elastograms. ROI’s should be placed only in regions of the liver that have adequate wave amplitude and should not extend closer than approximately one-half wavelength to the liver margin to avoid edge effects. Large vessels, the gall bladder fossa, and any areas affected by cardiac and vascular artifacts should also be excluded. ROIs can be either geographic or oval in shape (Fig 6).
Fig 6.
Measuring stiffness values in elastograms. Regions of interest (ROI) can be drawn either as a geographic or elliptical areas, guided by the magnitude image to include hepatic parenchyma and excluding areas close to the liver margins and larger vessels. In the example shown here, mean stiffness value from the geographic and elliptical ROIs is equivalent, at 2.2kPa.
Clinical Applications of Hepatic MRE
Detection of Liver Fibrosis
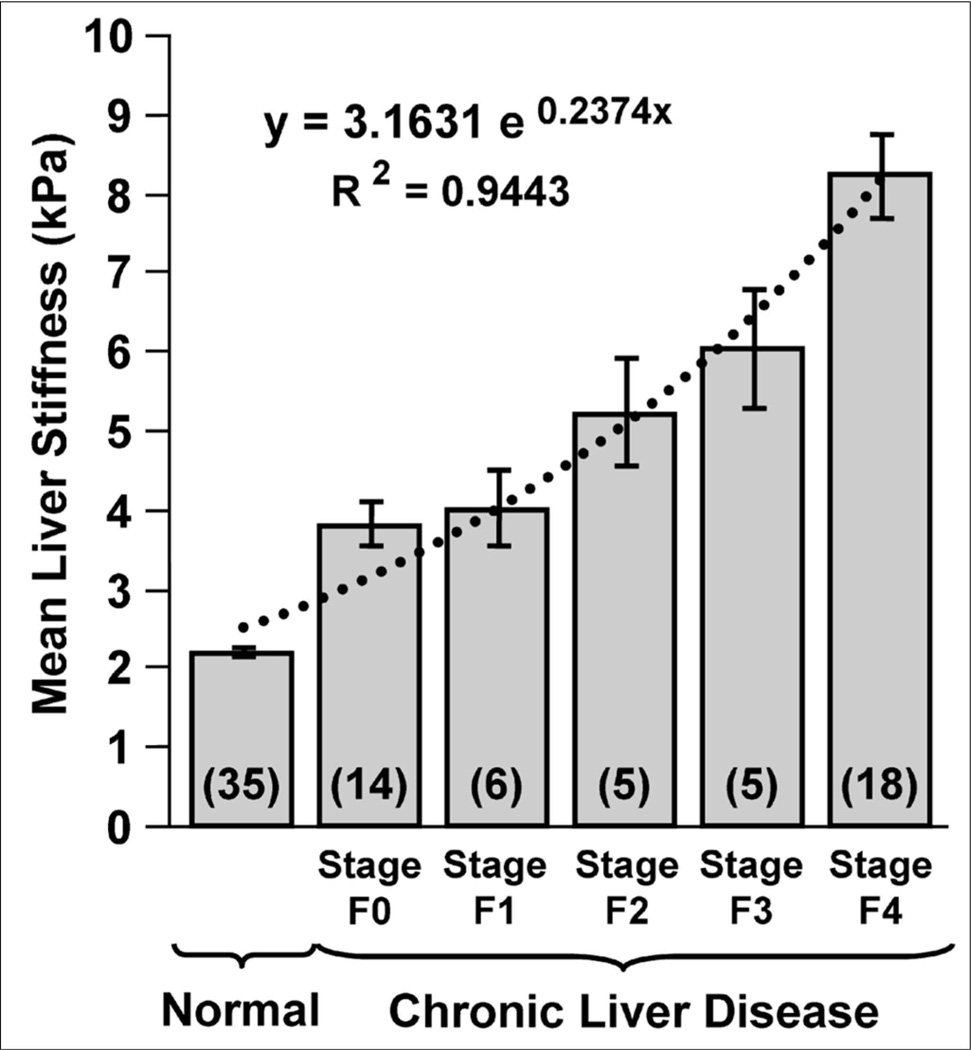
Normal liver parenchyma has shear stiffness values less than 3 kPa (23, 25, 27, 28, 37–39). Hepatic fibrosis can be diagnosed with high sensitivity and specificity if the hepatic stiffness is above this value. MRE has also been shown to be useful for differentiating between various stages of fibrosis (25, 37, 38). Liver stiffness increases incrementally with histological stage of fibrosis (Fig 7, 8).
Fig 7.
MRE demonstrates increasing liver stiffness values with increasing stage of fibrosis. The top row shows wave images from four patients with biopsy-proven hepatic fibrosis ranging from METAVIR stage 1 to 4. The lower row shows corresponding elastograms for these patients. The wavelength of the imaged shear waves and mean stiffness of liver tissue wave increases systematically with the severity of fibrosis. In general, the attenuation of shear waves with depth in the liver also decreases with increasing severity of fibrosis.
Fig 8.
(Reproduced with permission from Yin M et al. Clinical Gastroenterology and Hepatology 2007; 5(10):1207–1213). Bar chart showing mean shear stiffness measurements of the liver for 35 healthy volunteers and the 48 patients with known liver disease and biopsy-proven fibrosis staging, indicated here as F0, F1 … F4. Liver stiffness increases systematically with fibrosis stage.
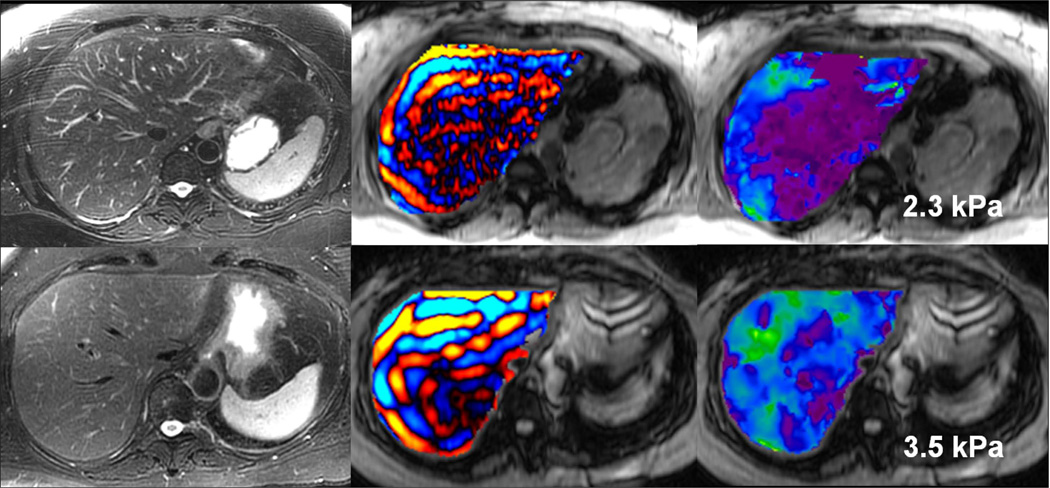
Studies have also shown that MRE can be used to detect liver fibrosis well before other imaging signs of fibrosis are seen (Fig 9). MR Elastography is useful for differentiating patients with clinically important hepatic fibrosis (METAVIR stage F2–4) from those individuals with lesser degrees of fibrosis, including persons without chronic liver disease (25–27, 37–39). Most of the studies reporting the accuracy of MRE have included patients with fibrosis from varied etiologies. It is thought that the degree, extent, pattern and distribution of fibrosis may be different in chronic liver diseases with various etiologies. These differences may affect the cut off value to be used for distinguishing the stages of fibrosis in different chronic liver diseases. Further, fibrosis staging with histopathology is defined by architectural changes and not the total amount of fibrosis. Whether MRE is affected by the amount of fibrosis or the pattern of architectural changes is not known and is a potential area of research in future. Therefore, more studies with larger patient populations, preferably of same etiology are needed to confirm the sensitivity and specificity of MRE and to standardize the technique. Accurate cut-off values incorporating sensitivity and specificity values need to be determined for different etiologies. Most studies to date have found that a cut-off value of 3 kPa is useful to distinguish patients with normal liver parenchyma from those with steatohepatitis or fibrosis.
Fig 9.
Early detection of fibrosis with MRE. Two patients with chronic hepatitis B. The patient in the upper row has normal liver stiffness, whereas the patient in the lower row has modestly elevated liver stiffness. Biopsies excluded fibrosis in the first patient and showed mild fibrosis in the second. All conventional MR images were normal in both patients.
While the presence of liver fibrosis appears to be consistently associated with increased hepatic parenchymal stiffness, the reverse is not always true. Studies with transient elastography have shown that acute inflammation of liver without presence of fibrosis can cause increased hepatic stiffness (40). Similar observations are emerging with MRE and, in particular, marked elevation of MRE-assessed hepatic stiffness without biopsy evidence of fibrosis has been reported in patients with acute hepatitis (41).
Hepatic fibrosis may not be a homogenous process, creating the potential for sampling error in biopsy-based diagnosis (42). MRE provides a unique opportunity to visualize the spatial pattern of fibrosis in the liver and preliminary observations have indicated that heterogeneity is often apparent especially in the early stages (Fig 10). MRE provides an opportunity for biopsy guidance (43).
Fig 10.
Heterogeneity of fibrosis demonstrated with MRE. (a) Patient with chronic hepatitis B with METAVIR stage F2 fibrosis has slightly heterogeneous, elevated liver stiffness, averaging 3.6kPa. (b) A patient with primary sclerosing cholangitis has substantial heterogeneity with increased stiffness peripherally and a mean value of 4.2 kPa. Preliminary experience suggests that this pattern is more common in patients with primary sclerosing cholangitis (c) A patient with cirrhosis due to hepatitis C has marked heterogeneity and a mean hepatic stiffness value of 7.3kPa.
Hepatic MRE is usually performed in a fasting state, because increased postprandial portal blood flow may cause a dynamic increase in liver stiffness in patients with liver disease, potentially leading to an overestimation of the extent of fibrosis (44, 45). Hepatic MRE can be performed either before or after intravenous gadolinium administration, as liver stiffness values are not significantly affected by intravenous gadolinium (46)(Fig 11).
Fig 11.
MRE of liver in an obese patient with body mass index of 43. Note the good illumination of liver in the wave image (b) despite thick subcutaneous fat. The elastogram (b) shows that liver has normal stiffness.
Studies comparing the MRE with Fibroscan are few (27, 47). In one study, MRE had a higher technical success rate than Fibroscan and a better diagnostic accuracy (0.994 for F > 2; 0.985 for F > 3; 0.998 for F > 4) than Fibroscan and aspartate aminotransferase to platelets ratio index (APRI), and the combination of Fibroscan and APRI (0.837, 0.709, and 0.849 for F > 2; 0.906, 0.816, and 0.936 for F > 3; 0.930, 0.820, and 0.944 for F > 4, respectively) (27).
MRE can be Performed in Most Patients
MRE technique is well tolerated by most patients and can be incorporated into a standard liver MRI study with minimal effect on exam time. MRE is not affected by obesity (Fig 12), ascites (Fig 13) or bowel interposition between liver and anterior abdominal wall (Fig 14), all of which may limit the application of ultrasound-based quantitative elastography.
Fig 12.
Non-alcoholic steatohepatitis with cirrhosis and ascites. Note the ascites in axial T2-w image (a), however the shear waves are still well visualized in the liver (b) and the elastogram (c) confirms increased liver stiffness value of more than 8kPa consistent with cirrhosis.
Fig 13.
MRE of liver in a patient with chronic hepatitis B and fibrosis. Axial T1-w image (a) showing interposition of bowel between liver and anterior abdominal wall (arrow). MRE wave image (b) shows good illumination of the liver and elastogram (c) confirms increased liver stiffness.
Fig 14.
Hepatic steatosis alone has little effect on liver stiffness. The top row shows images of a patient with biopsy-proven non-alcoholic fatty liver disease (NAFLD) without steatohepatitis. The in-phase and opposed-phase gradient echo images on the left show a drop in the signal relative to in-phase, indicative of significant hepatic steatosis. The corresponding MR elastogram shows normal hepatic stiffness. The lower row shows images of a patient with biopsy-proven non-alcoholic steatohepatitis (NASH). The in-phase and opposed-phase images demonstrate elevated hepatic fat content, similar to the first patient, but the elastogram shows markedly increased hepatic stiffness consistent with the biopsy diagnosis of stage 4 fibrosis.
Fatty change in the Liver does not affect Measurement of Liver Stiffness
In patients with non- alcoholic fatty liver disease (NAFLD), steatosis alone does not appear to have a significant effect on hepatic stiffness (fig 15) (25). However, it has been shown that if the disease progresses to inflammation (non-alcoholic steatohepatitis or NASH), MRE-assessed hepatic stiffness does increase, even before the onset of fibrosis (48). More studies on utility of MRE in this particular and important cause of chronic liver disease are needed.
Fig 15.
Intravenous gadolinium contrast administration does not affect hepatic stiffness. MRE in a chronic hepatitis B patient with biopsy confirmed stage 3 fibrosis before (top row) and after (bottom row) administration of intravenous gadolinium agent shows no significant change in hepatic stiffness (3.6 and 3.7 kPa respectively).
MRE may be Useful in Characterization of Liver Tumors
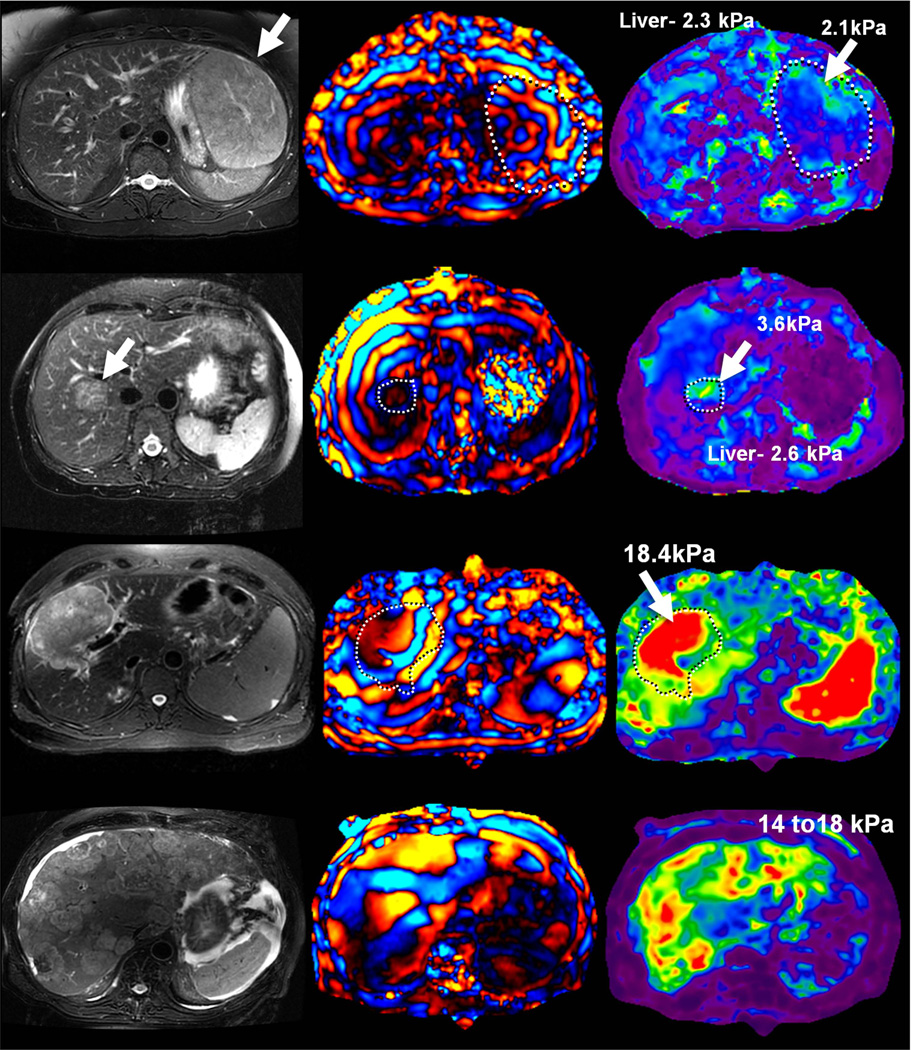
Preliminary studies have shown that benign hepatic tumors tend to show lower or similar stiffness to that of normal liver whereas malignant lesions tend to have higher stiffness than normal liver and benign tumors (Fig 16). A study of 44 hepatic masses in 29 patients showed that all of the observed malignant tumors had stiffness values above 5 kPa, whereas all of the benign hepatic tumors and normal liver parenchymal measurements were below this value (49). The results indicate that MRE shows promise as a method for characterizing focal hepatic lesions.
Fig 16.
MRE of liver tumors. Benign tumors such as focal nodular hyperplasia (top row, a–c) and hepatic adenoma (second row from the top, d–f) show stiffness values that are similar or slightly higher than normal liver parenchyma and generally less than 5kPa. Malignant tumors show increased stiffness compared to normal liver parenchyma as demonstrated with examples of hepatocellular carcinoma-cholangiocarcinoma (third row, g–i) and colorectal carcinoma metastases (bottom row, j–l).
Limitations of MRE
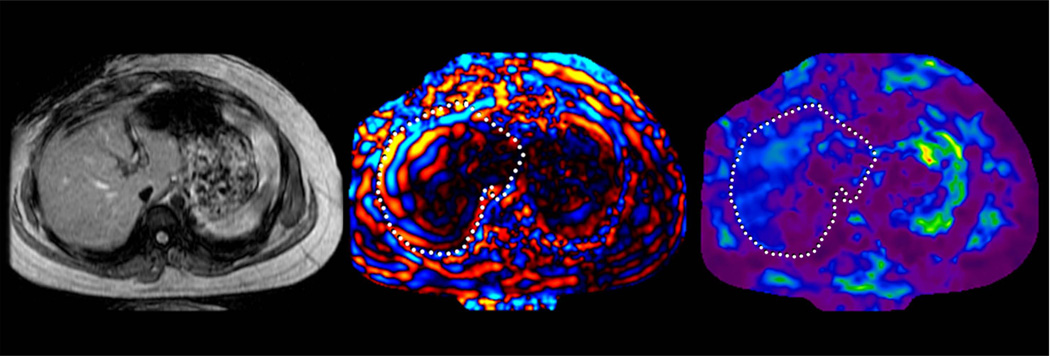
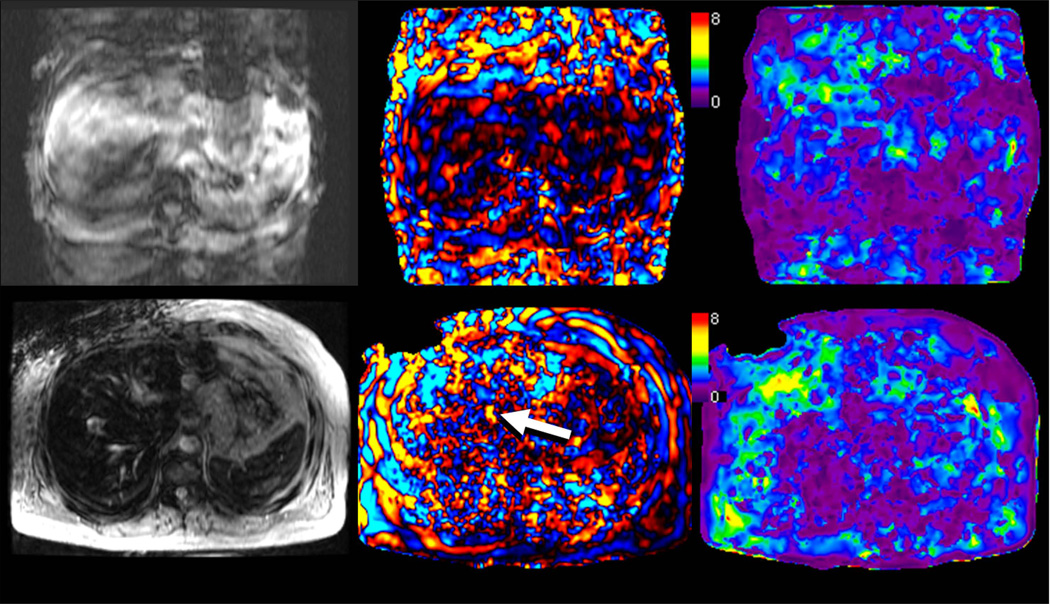
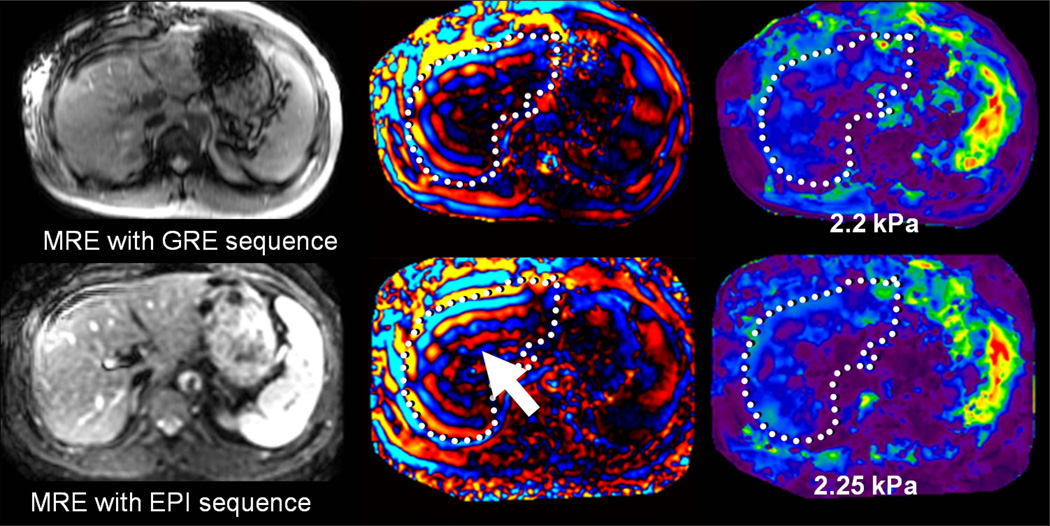
MRE is typically a breath-hold technique and therefore requires co-operation by patients similar to other MRI-based hepatic sequences (Fig 17). In patients with moderate to severe iron overload due to hemochromatosis or hemosiderosis, the hepatic MRI signal may be so low that waves cannot be adequately visiualized with a gradient-echo based MRE sequence. (Fig 17) (50). This limitation may be overcome by implementing alternative pulse sequences with shorter echo times such as spin-echo EPI based MRE (Fig 18) (51).
Fig 17.
Situations in which MRE exams may fail. Top row shows severe breath hold artifacts degrading the MRE study in a patient who could not hold breath consistently. Note that waves are not well seen in the wave image and therefore the elastogram (c) is not reliable. Bottom row shows an MRE study in a patient with hemochromatosis and high iron content. The lack of signal from the liver prevents the mechanical waves from being visualized. Without adequate wave data, the elastogram provided by the inversion algorithm is not valid.
Fig 18.
Patient with moderate hemochromatosis, controlled with multiple phlebotomies. In the top row, MRE was performed with a GRE based technique. Fortunately, the hepatic signal was sufficient to obtain adequate visualization of shear waves, resulting in a valid elastogram. The bottom row shows a follow-up MRE acquisition performed with a spin-echo based EPI technique, designed to be less affected by hepatic iron. The magnitude image demonstrates increased relative signal in the liver, providing improved depiction of waves (arrow). The elastogram provided similar values to the GRE-based measurement, but with improved confidence.
Discussion
With growing clinical experience, MRE is emerging as a noninvasive alternative to biopsy in patients with suspected hepatic fibrosis. The technique may be especially relevant for surveillance of patients receiving therapeutic agents with known hepatotoxic effects and to assess the longitudinal response to anti-fibrotic treatment (Fig 19) (52).
Fig 19.
Use of MRE to assess a patient with chronic hepatitis C and biopsy 5 years previously showing hepatic fibrosis. After the patient refused follow-up biopsy, MRE was performed. The elastogram showed a mean stiffness of 4.2 kPa, consistent with moderate fibrosis. Antiviral treatment was continued without any histological confirmation and patient has opted for further follow up with MRE.
Given the high test –retest repeatability of MRE, the technique may be especially suitable as an alternative to biopsy for clinical trials of anti-fibrotic drugs (31).
There is scope for further refinement of the technique especially to optimize the image quality. Currently applied MRE technique has lower resolution than the standard MRI sequences. True three dimensional imaging with increasingly sophisticated inversion algorithms can help improve the resolution and accuracy. This may be particularly useful for detection of focal lesions. Reducing acquisition time with reduced k-space acquisition and use of parallel imaging may help minimize breath hold artifacts. Other areas for improvement of image quality are to improve signal to noise ratio in patients with iron overload with using spin echo, fast spin echo and echo planar imaging methods.
Many research opportunities seem apparent. By applying more elaborate mechanical models to the processing of wave data, it is possible to estimate new independent tissue characterization parameters that account for properties such as attenuation, anisotropy, and nonlinearity. By using these additional parameters, it may be possible to augment the specificity of MRE to discriminate between the effects of inflammation, edema, passive congestion, fibrosis, and scarring.
In summary, emerging evidence indicates that MRE is a reliable non-invasive technique for evaluating hepatic fibrosis. It is safer, less expensive, and potentially less affected by sampling errors than biopsy. MRE of the liver can be performed in most patients with liver disease including those with ascites or obesity.
Acknowledgments
Grant support:
This work has been supported by NIH grant EB001981 and NMRC individual research grant 1163/2008.
REFERENCES
- 1.Farci P, Roskams T, Chessa L, et al. Long-term benefit of interferon alpha therapy of chronic hepatitis D: regression of advanced hepatic fibrosis. Gastroenterology. 2004;126:1740–1749. doi: 10.1053/j.gastro.2004.03.017. [DOI] [PubMed] [Google Scholar]
- 2.Friedman S, Bansal M. Reversal of hepatic fibrosis -- fact or fantasy? Hepatology. 2006;43:S82–S88. doi: 10.1002/hep.20974. [DOI] [PubMed] [Google Scholar]
- 3.Dixon J, Bhathal P, Hughes N, O'Brien P. Nonalcoholic fatty liver disease: Improvement in liver histological analysis with weight loss. Hepatology. 2004;39:1647–1654. doi: 10.1002/hep.20251. [DOI] [PubMed] [Google Scholar]
- 4.Fowell A, Iredale J. Emerging therapies for liver fibrosis. Dig Dis. 2006;24:174–183. doi: 10.1159/000090320. [DOI] [PubMed] [Google Scholar]
- 5.Craxi A, Antonucci G, Camma C. Treatment options in HBV. J Hepatol. 2006;44:S77–S83. doi: 10.1016/j.jhep.2005.11.018. [DOI] [PubMed] [Google Scholar]
- 6.Liaw YF, Sung JJ, Chow WC, et al. Lamivudine for patients with chronic hepatitis B and advanced liver disease. N Engl J Med. 2004;351:1521–1531. doi: 10.1056/NEJMoa033364. [DOI] [PubMed] [Google Scholar]
- 7.Dienstag JL, McHutchison JG. American gastroenterological ascoication technical review on the management of hepatitis C. Gastroenterology. 2006;130:231–264. doi: 10.1053/j.gastro.2005.11.010. [DOI] [PubMed] [Google Scholar]
- 8.Lok AS, McMahon BJ. Chronic hepatitis B. Hepatology. 2007;45:507–539. doi: 10.1002/hep.21513. [DOI] [PubMed] [Google Scholar]
- 9.Ghany MG, Nelson DR, Strader DB, Thomas DL, Seeff LB. An update on treatment of genotype 1 chronic hepatitis C virus infection: 2011 practice guideline by the American association for the study of liver diseases. Hepatology. 2011;54:1433–1444. doi: 10.1002/hep.24641. [DOI] [PMC free article] [PubMed] [Google Scholar]
- 10.Leise MD, Kim WR, Canterbury KM, Poterucha JJ. Drug therapy: telaprevir. Hepatology. 2011;54:1463–1469. doi: 10.1002/hep.24660. [DOI] [PubMed] [Google Scholar]
- 11.Martinez SM, Crespo G, Navasa M, Forns X. Noninvasive assessment of liver fibrosis. Hepatology. 2011;53:325–335. doi: 10.1002/hep.24013. [DOI] [PubMed] [Google Scholar]
- 12.Maharaj B, Maharaj R, Leary W, et al. Sampling variability and its influence on the diagnostic yield of percutaneous needle biopsy of the liver. Lancet. 1986;1:523–525. doi: 10.1016/s0140-6736(86)90883-4. [DOI] [PubMed] [Google Scholar]
- 13.Regev A, Berho M, Jeffers L, et al. Sampling error and intraobserver variation in liver biopsy in patients with chronic HCV infection. Am J Gastroenterol. 2002;97:2614–2618. doi: 10.1111/j.1572-0241.2002.06038.x. [DOI] [PubMed] [Google Scholar]
- 14.Bedossa P, Dargère D, Paradis V. Sampling variability of liver fibrosis in chronic hepatitis C. Hepatology. 2003;38:1449–1457. doi: 10.1016/j.hep.2003.09.022. [DOI] [PubMed] [Google Scholar]
- 15.Piccinino F, Sagnelli E, Pasquale G, Giusti G. Complications following percutaneous liver biopsy. A multicentre retrospective study on 68,276 biopsies. J Hepatol. 1986;2:165–173. doi: 10.1016/s0168-8278(86)80075-7. [DOI] [PubMed] [Google Scholar]
- 16.Afdhal N, Nunes D. Evaluation of liver fibrosis: a concise review. Am J Gastroenterol. 2004;99:1160–1174. doi: 10.1111/j.1572-0241.2004.30110.x. [DOI] [PubMed] [Google Scholar]
- 17.Sandrin L, Fourquet B, Hasquenoph J, et al. Transient elastography: a new noninvasive method for assessment of hepatic fibrosis. Ultrasound Med Biol. 2003;29:1705–1713. doi: 10.1016/j.ultrasmedbio.2003.07.001. [DOI] [PubMed] [Google Scholar]
- 18.Castéra L, Vergniol J, Foucher J, et al. Prospective comparison of transient elastography, Fibrotest, APRI, and liver biopsy for the assessment of fibrosis in chronic hepatitis C. Gastroenterology. 2005;128:343–350. doi: 10.1053/j.gastro.2004.11.018. [DOI] [PubMed] [Google Scholar]
- 19.Girometti R, Furlan A, Bazzocchi M, et al. Diffusion-weighted MRI in evaluating liver fibrosis: a feasibility study in cirrhotic patients. Radiol Med. 2007;112:394–408. doi: 10.1007/s11547-007-0149-1. [DOI] [PubMed] [Google Scholar]
- 20.Lim A, Patel N, Hamilton G, Hajnal J, Goldin R, Taylor-Robinson S. The relationship of in vivo 31P MR spectroscopy to histology in chronic hepatitis C. Hepatology. 2003;37:788–794. doi: 10.1053/jhep.2003.50149. [DOI] [PubMed] [Google Scholar]
- 21.Muthupillai R, Lomas D, Rossman P, Greenleaf J, Manduca A, Ehman R. Magnetic resonance elastography by direct visualization of propagating acoustic strain waves. Science. 1995;269:1854–1857. doi: 10.1126/science.7569924. [DOI] [PubMed] [Google Scholar]
- 22.Manduca A, Oliphant T, Dresner M, et al. Magnetic resonance elastography: non-invasive mapping of tissue elasticity. Med Image Anal. 2001;5:237–254. doi: 10.1016/s1361-8415(00)00039-6. [DOI] [PubMed] [Google Scholar]
- 23.Rouvière O, Yin M, Dresner M, et al. MR elastography of the liver: preliminary results. Radiology. 2006;240:440–448. doi: 10.1148/radiol.2402050606. [DOI] [PubMed] [Google Scholar]
- 24.Huwart L, Peeters F, Sinkus R, et al. Liver fibrosis: non-invasive assessment with MR elastography. NMR Biomed. 2006;19:173–179. doi: 10.1002/nbm.1030. [DOI] [PubMed] [Google Scholar]
- 25.Yin M, Talwalkar J, Glaser K, et al. Assessment of hepatic fibrosis with magnetic resonance elastography. Clin Gastroenterol Hepatol. 2007;5:1207–1213. doi: 10.1016/j.cgh.2007.06.012. e1202. [DOI] [PMC free article] [PubMed] [Google Scholar]
- 26.Huwart L, Sempoux C, Salameh N, et al. Liver fibrosis: noninvasive assessment with MR elastography versus aspartate aminotransferase-to-platelet ratio index. Radiology. 2007;245:458–466. doi: 10.1148/radiol.2452061673. [DOI] [PubMed] [Google Scholar]
- 27.Huwart L, Sempoux C, Vicaut E, et al. Magnetic resonance elastography for the noninvasive staging of liver fibrosis. Gastroenterology. 2008;135:32–40. doi: 10.1053/j.gastro.2008.03.076. [DOI] [PubMed] [Google Scholar]
- 28.Asbach P, Klatt D, Hamhaber U, et al. Assessment of liver viscoelasticity using multifrequency MR elastography. Mag Reson Med. 2008;60:373–379. doi: 10.1002/mrm.21636. [DOI] [PubMed] [Google Scholar]
- 29.Bonekamp S, Kamel I, Solga S, Clark J. Can imaging modalities diagnose and stage hepatic fibrosis and cirrhosis accurately? J Hepatol. 2009;50:17–35. doi: 10.1016/j.jhep.2008.10.016. [DOI] [PubMed] [Google Scholar]
- 30.Hines C, Bley T, Lindstrom M, Reeder S. Repeatability of magnetic resonance elastography for quantification of hepatic stiffness. J Magn Reson Imaging. 2010;31:725–731. doi: 10.1002/jmri.22066. [DOI] [PMC free article] [PubMed] [Google Scholar]
- 31.Shire NJ, Yin M, Chen J, et al. Test-retest repeatability of MR elastography for noninvasive liver fibrosis assessment in hepatitis C. J Magn Reson Imaging. 2011;34:947–955. doi: 10.1002/jmri.22716. [DOI] [PMC free article] [PubMed] [Google Scholar]
- 32.Motosugi U, Ichikawa T, Sano K, et al. Magnetic Resonance elastography of the liver: preliminary results and estimation of inter-rater reliability. Jpn J Radiol. 2010;28:623–627. doi: 10.1007/s11604-010-0478-1. [DOI] [PMC free article] [PubMed] [Google Scholar]
- 33.Murphy MC, Glaser KJ, Bolster BD, Litwiller DV, Kruse SA, Ehman RL. Cross-Platform Comparison of Brain MRE. Proceedings of the 19th Annual Meeting of ISMRM; Montreal. 2011. (abstract 1488) [Google Scholar]
- 34.Manduca A, Oliphant TE, Dresner MA, et al. Magnetic resonance elastography: non-invasive mapping of tissue elasticity. Med Image Anal. 2001;5:237–254. doi: 10.1016/s1361-8415(00)00039-6. [DOI] [PubMed] [Google Scholar]
- 35.Oliphant TE, Manduca A, Ehman RL, Greenleaf JF. Complex-valued stiffness reconstruction for magnetic resonance elastography by algebraic inversion of the differential equation. Magn Reson Med. 2001;45:299–310. doi: 10.1002/1522-2594(200102)45:2<299::aid-mrm1039>3.0.co;2-o. [DOI] [PubMed] [Google Scholar]
- 36.Manduca A, Lake D, Kruse S, Ehman R. Spatio-temporal directional filtering for improved inversion of MR elastography images. Med Image Anal. 2003;7:465–473. doi: 10.1016/s1361-8415(03)00038-0. [DOI] [PubMed] [Google Scholar]
- 37.Huwart L, Salameh N, ter Beek L, et al. MR elastography of liver fibrosis: preliminary results comparing spin-echo and echo-planar imaging. Eur Radiol. 2008;18:2535–2541. doi: 10.1007/s00330-008-1051-5. [DOI] [PubMed] [Google Scholar]
- 38.Asbach P, Klatt D, Schlosser B, et al. Viscoelasticity-based staging of hepatic fibrosis with multifrequency MR Elastography. Radiology. 2010;257:80–86. doi: 10.1148/radiol.10092489. [DOI] [PubMed] [Google Scholar]
- 39.Wang Y, Ganger DR, Levitsky J, et al. Assessment of chronic hepatitis and fibrosis: comparison of MR elastography and diffusion-weighted imaging. AJR Am J Roentgenol. 2011;196:553–561. doi: 10.2214/AJR.10.4580. [DOI] [PMC free article] [PubMed] [Google Scholar]
- 40.Arena U, Vizzutti F, Corti G, et al. Acute viral hepatitis increases liver stiffness values measured by transient elastography. Hepatology. 2008;47:380–384. doi: 10.1002/hep.22007. [DOI] [PubMed] [Google Scholar]
- 41.Silva AC, Walker FB, Vargas HE, Jatoi MA, Ehman RL. Diffuse liver disease: virtual palpation with MR elastography. Radiological Society of North America 93rd Scientific Assembly and Annual Meeting; Chicago, IL. 2008. Nov, [Google Scholar]
- 42.Marcellin P, Asselah T, Boyer N. Fibrosis and disease progression in hepatitis C. Hepatology. 2002;36:S47–S56. doi: 10.1053/jhep.2002.36993. [DOI] [PubMed] [Google Scholar]
- 43.Lee VS, Miller FH, Omary RA, Wang Y, Ganger DR, Wang E, Rao S, Levitsky J. Magnetic resonance elastography and biomarkers to assess fibrosis from recurrent hepatitis C in liver transplant recipients. Transplantation. 2011;92(5):581–586. doi: 10.1097/TP.0b013e31822805fa. [DOI] [PubMed] [Google Scholar]
- 44.Mederacke I, Wursthorn K, Kirschner J, et al. Food intake increases liver stiffness in patients with chronic or resolved hepatitis C virus infection. Liver Int. 2009;29:1500–1506. doi: 10.1111/j.1478-3231.2009.02100.x. [DOI] [PubMed] [Google Scholar]
- 45.Yin M, Talwalkar JA, Glaser KJ, Venkatesh SK, Chen J, Manduca A, Ehman RL. Dynamic postprandial hepatic stiffness augmentation assessed with MR Elastography in patients with chronic liver disease. AJR Am J Roentgenol. 2011;197(1):64–70. doi: 10.2214/AJR.10.5989. [DOI] [PMC free article] [PubMed] [Google Scholar]
- 46.Venkatesh SK, Teo LLS, Ang BWL, Lim SG, Wee A, Ehman RL. European Congress of Radiology 2010. Vienna, Austria: European Society of Radiology; 2010. Effect of intravenous gadolinium on estimation of liver stiffness with MR elastography. (abstract 163) [Google Scholar]
- 47.Bensamoun SF, Wang L, Robert L, Charleux F, Latrive JP, Ho Ba Tho MC. Measurement of liver stiffness with two imaging techniques: magnetic resonance elastography and ultrasound elastometry. J Magn Reson Imaging. 2008;28:1287–1292. doi: 10.1002/jmri.21523. [DOI] [PubMed] [Google Scholar]
- 48.Chen J, Talwalkar JA, Yin M, Glaser KJ, Sanderson SO, Ehman RL. Early Detection of nonalcoholic steatohepatitis in patients with nonalcoholic fatty liver disease by using MR elastography. Radiology. 2011;259:749–756. doi: 10.1148/radiol.11101942. [DOI] [PMC free article] [PubMed] [Google Scholar]
- 49.Venkatesh S, Yin M, Glockner J, et al. MR elastography of liver tumors: preliminary results. AJR Am J Roentgenol. 2008;190:1534–1540. doi: 10.2214/AJR.07.3123. [DOI] [PMC free article] [PubMed] [Google Scholar]
- 50.Taouli B, Ehman R, Reeder S. Advanced MRI methods for assessment of chronic liver disease. AJR Am J Roentgenol. 2009;193:14–27. doi: 10.2214/AJR.09.2601. [DOI] [PMC free article] [PubMed] [Google Scholar]
- 51.Stanley DW, Glaser KJ, Yin M, Chen J, Ehman RL. Validity study of spin echo epi based hepatic MR elastography at 3.0T. Proceedings of the 18th Annual Meeting of ISMRM; Montreal. 2010. (abstract 629) [Google Scholar]
- 52.Hoganson DD, Chen J, Ehman RL, Talwalkar JA, Michet CJ, Yin M, et al. Magnetic resonance elastography for the evaluation of liver fibrosis in patients with rheumatoid arthritis receiving methotrexate. Arthritis Rheum. 2010;62(Suppl 10):129. [abstract] [Google Scholar]


