

Abstract
A disintegrin and metalloproteinase 17 (ADAM17) is a metalloprotease that is overexpressed in many cancer types, including renal cancers. However, the regulatory mechanisms of ADAM17 in cancer development and progression are poorly understood. In the present work, we provide evidence using overexpression and inhibition of microRNA 145 (miR-145) that miR-145 negatively regulates ADAM17 expression. Furthermore, we show that ADAM17 negatively regulates miR-145 through tumor necrosis factor-α, resulting in a reciprocal negative feedback loop. In this study, the expression of ADAM17 and miR-145 correlated negatively in renal cancer tumor tissues and cell lines, suggesting an important regulatory mechanism. Additionally, we showed that the regulation of ADAM17 is partly involved in the effects of miR-145 on proliferation and migration, whereas no involvement in chemosensitivity was observed. Importantly, in the healthy kidney, miR-145 was detected in different cell types including tubular cells, which are considered the origin of renal cancer. In renal cancer cell lines, miR-145 expression was strongly suppressed by methylation. In summary, miR-145 is downregulated in renal cancer patients, which leads to the up-regulation of ADAM17 in renal cancer. Importantly, miR-145 and ADAM17 are regulated in a reciprocal negative feedback loop.
Introduction
Renal cell carcinoma (RCC) originates from renal tubules and is the most common cancer of the kidney, accounting for 90% to 95% of all renal tumors in adults [1]. Importantly, 60% of all affected patients develop metastases. Only 10% of RCC patients with metastases survive longer than 5 years, whereas 80% of RCC patients with non-metastatic disease survive 5 years or longer [2]. Given the scarce number of therapeutic regimens, alternative approaches are urgently needed to prolong patient survival.
An interesting potential target molecule is the metalloprotease a disintegrin and metalloproteinase 17 (ADAM17), which is overexpressed in several types of cancer, including renal cancer [3–11]. ADAM17 was originally identified as the protease of the tumor necrosis factor-α (TNF-α), which is important during inflammation and for the cancer microenvironment [12,13].
In RCC, ADAM17 expression increases with the degree of malignancy and it is essential to form xenograft tumors [11,14]. Importantly, more than 70 cellular substrates have been identified for ADAM17, including TNF-α, transforming growth factor-α, and epidermal growth factor receptor (EGFR) ligands [15]. Interestingly, the expression levels of members of the ADAM family can be regulated by small non-coding microRNAs (miRNAs) [16–18]. Furthermore, miRNAs were shown to have an important role in the regulation of gene networks, including those that are essential for cancer development [19–21].
miRNA 145 (miR-145) plays a crucial role in the differentiation of smooth muscle cells (SMCs) [22–24]. miR-145 is downregulated in many tumors, including hematopoietic tumors and solid tumors of the breast, ovary, head and neck, prostate, skin, lung, bladder, and cervix [25–28]. Furthermore, the ectopic expression of miR-145 in cancer cells led to a loss in cell viability and induced cell death [26,29,30]. It has been considered that the down-regulation of miR-145 is an early event in many cancers, suggesting an important role in several cancer-related pathways [31,32]. A number of genes that are important in different cancer pathways have been identified and validated as target genes of miR-145, including plasminogen activator inhibitor-1 (PAI-1), octamer-binding transcription factor 4 (Oct-4), sex determining region Y (SRY)-box 2 (Sox-2), c-Myc, and p70S6K1 [33–36]. miR-145 is downregulated by promoter hypermethylation in many cancers [37–39]. Additionally, the tumor suppressor gene p53, which is inactive in about 50% of all cancers, upregulates miR-145 expression, whereas, in contrast, the Ras oncogene represses miR-145 expression [37,40]. It has been implicated by Gregersen et al. that ADAM17 may be a target of miR-145 [41].
In this study, we identified miR-145 as an miRNA that is down-regulated in the majority of renal cell cancers by methylation. Furthermore, we provide evidence that miR-145 decreases proliferation and invasion by directly targeting the 3′ untranslated region (3′UTR) of ADAM17 mRNA. Additionally, we show that ADAM17 negatively regulates miR-145 expression through TNF-α, leading to a reciprocal negative feedback loop. Importantly, we found a negative correlation of miR-145 and ADAM17 expression in renal cancer samples, suggesting that these molecules could be promising targets for further treatment approaches.
Materials and Methods
Substances and Antibodies
To detect ADAM17 protein expression, we used the polyclonal antibody from Santa Cruz Biotechnology (Heidelberg, Germany; sc-13973). A β-actin antibody from Sigma-Aldrich (Taufkirchen, Germany) was used as a loading control. The metalloprotease inhibitors TAPI-0 and TAPI-2 were obtained from Calbiochem (Darmstadt, Germany). Recombinant human TNF-α was purchased from Peprotech (London, United Kingdom). Phorbol 12-myristate 13-acetate (PMA) and 5-aza-2′-deoxycytidine (AZA) were obtained from Sigma (St Louis, MO) and cisplatin from Teva (Radebeul, Germany).
Cell Culture
The renal carcinoma cell line A498 was obtained from Dr K. Joehrer (Innsbruck Medical University, Innsbruck, Austria), whereas the renal carcinoma cell line Foehn was a kind gift from Prof. Altevogt (German Cancer Research Center, Heidelberg, Germany). The renal carcinoma cell lines RCC4 and 786-0 were obtained from Prof. Krek (ETH Zurich, Zürich, Switzerland). Protein isolation and Western blot analyses were performed as previously described [42].
cDNA Synthesis and Polymerase Chain Reaction Analysis
RNA from cultured cells was isolated using the RNA Easy Kit according to the manufacturer's protocol (Qiagen, Hilden, Germany). Equal amounts of total cellular RNA (1 µg) were reverse transcribed with random primer by the use of M-MuLV Reverse Transcriptase (Fermentas, St Leon-Rot, Germany). Transcribed cDNAs were used for polymerase chain reaction (PCR) with specific primers for ADAM17 (435 bp, 5′-GCATTCTCAAGTCTCCACAAG-3′ and 5′-CCTCATTCGGGGCACATTCTG-3′), PAI-1 (183 bp, 5′-GAGGTGCCTCTCTCTGCCCTCACCAACATT-3′and 5′-AGCCTGAAACTGTCTGAACATGTCG-3′), c-Myc (478 bp, 5′-TACCCTCTCAACGACAGCAG-3′ and 5′-TCTTGACATTCTCCTCGGTG-3′), β-actin (234 bp, 5′-GGACTTCGAGCAAGAGATGG-3′ and 5′-AGCACTGTGTTGGCGTACAG-3′), and pri-miR-145 (73 bp, 5′-TGGATTTGCCTCCTTCCCA-3′ and 5′-TTGAACCCTCATCCT GTGAGCC-3′). The method described by Chen et al. was followed for stem-loop reverse transcription of mature miRNAs [43]. For miR-145, the stem-loop primer 5′-GTCGTATCCAGTGCAGGGTCCGAGGTATTCGCACTGGATACGACAGGGAT-3′ was used, and for U48, the stem-loop primer 5′-GTTGGCTCTGGTGCAGGGTCCGAGGT-ATTCGCACCAGAGCCAACGGTCAG-3′ was used. For miR-143, the commercially available primers from Exiqon (Vedbaek, Denmark) were used (#204190). The reverse transcribed product of miR-145 was then amplified by PCR with specific primers (5′-CGGCGTCCAGTTTTCCCAGG-3′ and 5′-GTGCAGGGTCCGAGGT-3′, and for U48, 5′-CGACGAGTGATGATGAC-3′ and 5′-GTGCAGGGTCCGAGGT-3′).
Real-time PCR
Real-time PCR was performed as described in the protocol from the Absolute Blue QPCR SYBR Green Low ROX Kit (Thermo Scientific, Hilden, Germany). The same primers as for the conventional PCR were also used for the real-time PCR. The CT values of analyzed RNA levels were normalized to the CT values of β-actin for mRNA and for miR-145 to U48 (housekeeping miRNA) within the same sample.
Luciferase Constructs
To construct luciferase reporter plasmids, we inserted various target fragments into multiple cloning site (MCS; XhoI and NotI) downstream of the Renilla luciferase reporter gene in the psiCHECK-2 promoter vector (Promega, Madison, WI). 5′ Modified primers carrying restriction sites for either XhoI or NotI were used (sequence printed in bold). The sequence from 3075 to 3082 (5′-AACTGGAA-3′) in the human ADAM17 mRNA (NM_003183.4) was termed miR-145 binding site.
The 761-nt fragment of the ADAM173′UTR (2613-3373, NM_003183.4) was generated using the following primer set: forward, 5′-atactcgagACTGCAGCGTCAGAATCGTGTTGA-3′ and reverse, 5′-atagcggccgcCCCAGCAAATCAGGGCCCTAAACA-3′.
Site-directed mutagenesis of the miR-145 binding site in the ADAM17 3′UTR was carried out with the QuickChange Site-Directed Mutagenesis Kit (Stratagene, La Jolla, CA), using the following primers: 5′-GAGGCATTTGGCATTTATTTGTGATGACAgcagaaATAGTTTTTTT-3′ and 5′-AAAAAAACTATttctgcTGTCATCACAAATAAATGCCAAATGCCTC-3′.
A fragment containing the perfect matching sequence with the mature miR-145, 5′-atactcgagAGGGATTCCTGGGAAAACTGGACgcggccgcata-3′ (the matching sequence is underlined), was cloned (psiCHECK-2-p145). All constructs were sequenced.
Luciferase Assay
Human embryonic kidney 293 (HEK293) cells (3 x 10⁵ per six-well plate) were transfected using the Lipofectamine 2000 transfection reagent (Invitrogen, Carlsbad, CA). Control RNA (20 nM) or miR145 was co-transfected with 400 ng of appropriate plasmids and lysed for luciferase assay 24 hours after transfection. Luciferase assays were performed using a Dual-Luciferase Reporter Assay System (Promega) according to the manufacturer's protocol. Firefly luciferase was used for normalization.
Oligonucleotide Transfection
The following siRNA duplexes (MWG Biotech AG, Ebersberg, Germany) were used for down-regulation of the corresponding protein expression: ADAM17-siRNA, 5′-GAGAAGCUUGAUUCUUUGCTT-3′. The transfection of miR-145 mimic (10 nM), miR-145 inhibitor (10 nM; both Qiagen), and miR-143 locked nucleic acid (LNA; Exiqon) inhibitors was performed in the same manner. As negative controls, unspecific AllStars negative control RNA from Qiagen or LNA control from Exiqon was used. Twenty-four hours before transfection, 0.4 x 10⁵ cells were seeded in six-well plates. Transfection of siRNA was carried out using Oligofectamine (Invitrogen, Karlsruhe, Germany) together with 10 nM siRNA duplex per well as previously described [44].
Immunohistochemistry and In Situ Hybridization
The in situ hybridization was performed with a 3′ and 5′ double DIG-labeled LNA miR-145 probe (Exiqon). The hybridization protocol has been described in detail by Jorgensen et al. [45]. After miR-145 staining, development and immunohistochemistry staining, starting with the first antibody, was continued with the same slide. Immunohistochemistry has been previously described [46].
Cell Cycle Analysis
Seventy-two hours after transfection, cells were trypsinized, washed in phosphate-buffered saline, and fixed with 70% ethanol at -20°C. After centrifugation, cells were incubated in hypotonic solution containing 50 µg/ml propidium iodide, 0.1% sodium citrate, 0.1% Triton X-100, and 20 µg/ml DNase-free RNaseA for 30 minutes at 37°C. Finally, cells were analyzed using flow cytometry in a linear mode. Each assay was performed in triplicates and repeated at least three times.
Patient Material
Tumor specimens and adjacent normal kidney tissues were collected from a total of 15 patients undergoing nephrectomy for RCC. All specimens were obtained on the basis of their availability for research purpose and under a protocol approved by the local medical ethics committee of Goethe University Frankfurt. Written consent was obtained from the patients in the study.
Cell Invasion Assay
The cell migration assay has been described earlier [47].
Proliferation Assay
The proliferation assay has been previously described [48].
Statistical Analysis
If not otherwise indicated in the Figure legends, Student's t test was used for statistical analyses.
Results
miR-145 Downregulates ADAM17 Protein Expression in Renal Cancer Cell Lines
The computational algorithms TargetScan, PicTar, and miRANDA were used to identify miRNAs that could potentially regulate ADAM17 expression [49–51]. These programs search for miRNAs that target evolutionary conserved sequences in the 3′UTR of the mRNA of the molecule of interest. miR-145 was one of two miRNAs predicted by all three programs to bind to the ADAM17 3′UTR (Figure 1, A and B). Importantly, it was shown in three microarray studies by miRNA profiling of renal cancer patients that miR-145 is regulated in cancer tissue [52–54].
Figure 1.
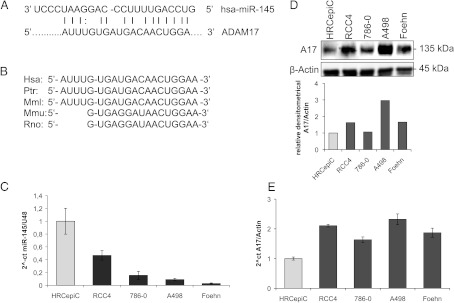
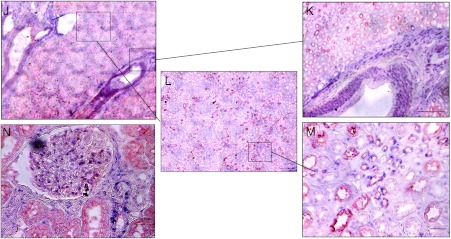
miR-145 regulates ADAM17 expression in renal cancer cell line. (A) Predicted duplex formation between human miR-145 (hsamiR-145; top) and human ADAM17 3′UTR (bottom). (B) Sequence of the miR-145 binding site within the ADAM17 3′UTR of human (Hsa), chimpanzee (Ptr), Rhesus macaque (Mml), mouse (Mmu), and rat (Rno). (C) Relative real-time PCR of miR-145 expression in relation to U48 expression in HRCepiC, RCC4, 786-0, A498, and Foehn cells. (D) Western blot analysis for ADAM17 (A17) of total lysates of HRCepiC, RCC4, 786-0, A498, and Foehn cells. β-Actin antibody was used as a loading control. The densitometrical analysis of the ADAM17 expression to β-actin is additionally depicted. (E) Relative real-time PCR of ADAM17 mRNA expression in relation to β-actin expression in HRCepiC, RCC4, 786-0, A498, and Foehn cells. (F) Real-time PCR of miR-145 expression relative to U48 expression in RCC tissue compared to normal renal tissue of 15 renal cancer patients (bright gray bars) and real-time PCR of ADAM17 expression in RCC tumor samples compared to normal renal tissue of the same patients (dark gray bars). The values were evaluated with the Δ-Δ CT method. Correlations were calculated with Student's t test, normal tissue against tumor tissue for miR-145 and ADAM17. (G) Plot of fold change of miR-145 related to fold change of ADAM17 for each patient; r, Pearson correlation coefficient; a, regression line. (H) Plot of fold change of miR-145 related to fold change of c-Myc for each patient. (I) Plot of fold change of miR-145 related to fold change of PAI-1 for each patient. (J) Overview of a tissue section of a normal kidney stained by in situ hybridization for miR-145 (blue) and by immunohistochemistry with an aquaporin-1 (red)-specific antibody. Scale bar represents 300 µm. (K) Enlarged picture of J showing the miR-145-expressing blood vessel. Scale bar represents 300 µm. (L) Enlarged picture of J. Scale bar represents 300 µm. (M) Enlarged picture of I showing miR-145-expressing (blue) and aquaporin-1 (red)-expressing tubular cells. Scale bar represents 50 µm. (N) Section of a glomerulus of a normal kidney stained by in situ hybridization for miR-145 (blue) and by immunohistochemical analysis for aquaporin-1 (red). Scale bar represents 50 µm.
Next, we investigated the miR-145 levels in a primary renal tubular cell line and in four renal cancer cell lines. The primary renal tubular cell line HRCepiC expressed higher levels of miR-145 than the renal cancer cell lines RCC4, 786-0, A498, and Foehn (Figure 1C). In contrast, the tubular cell line HRCepiC expressed the lowest amounts of ADAM17 protein and mRNA when compared to renal cancer cell lines (Figure 1, D and E).
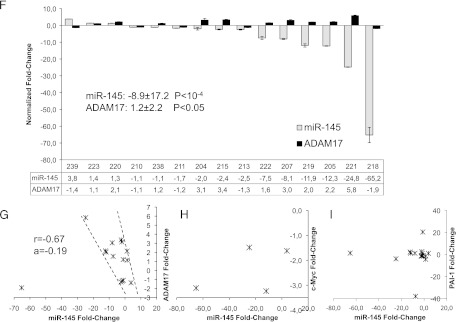
To analyze the miR-145 and ADAM17 expression in renal cancer patients, we isolated renal cell cancer and corresponding normal kidney RNA from 15 patients and analyzed the expression levels by real-time PCR (Figure 1F). Interestingly, in only one tumor specimen, miR-145 was moderately upregulated (+3.8); in four renal cancer tissues, it was virtually unchanged (+1.4 to -1.1), while in 10 renal cancer tissues, it was downregulated, ranging from 1.7-fold to more than 65-fold down-regulation, with an overall average of 8.9-fold down-regulation (P < 10-4). In contrast, only one patient displayed a decrease in ADAM17 expression (1.9), whereas six displayed almost no change (+1.2 to -1.4) and eight showed an up-regulation (+1.6 to +5.8) in tumor tissue compared to normal tissue with an overall average of 1.2-fold increase (P < .05).
The expression of miR-145 was further plotted versus the mRNA expression of ADAM17 for every individual patient (Figure 1G). Interestingly, all patient values were plotted in a small corridor, with the exception of patient number 218 that displayed the strongest decrease in miR-145 (-65.2) and ADAM17 (-1.9) expression. When analyzing the values in the marked corridor (14 of 15 patients), miR-145 and ADAM17 showed a significant negative correlation (K = -0.67), providing evidence for the regulation of ADAM17 by miR-145 in vivo. In contrast, when analyzing the known genes c-Myc and PAI-1, which have been described as miR-145 target genes, we could not find a correlation (Figure 1, H and I).
To determine the localization of miR-145 in normal human renal tissue, we performed in situ hybridization with miR-145-specific probes, followed by immunohistochemical staining with an antibody against aquaporin-1, which is known as a marker of proximal tubules [55]. miR-145 was strongly expressed in SMCs of blood vessels and inside the glomerulus (Figure 1, I, K, and N). Additionally, tubules adjacent to glomeruli and small tubules displayed distinct miR-145 expression (Figure 1, M and N).
miR-145 Regulates ADAM17 Expression through Direct Binding to the 3′UTR
Next, we evaluated the ability to inhibit or overexpress miR-145 using a commercial miR-145 inhibitor or mimic in the renal cancer cell lines A498 and Foehn. The cells were transfected with miR-145 inhibitor, the miR-145 mimic, or a control RNA. Transfection efficiency was measured by reverse transcription-PCR, which demonstrated that the miR-145 levels were efficiently changed (Figure W1, A and B). The reduction of miR-145 after inhibitor transfection indicates a degradation of mature miR-145 [56]. Importantly, in A498 and Foehn cells, the transfection of miR-145 mimic led to a strong reduction in ADAM17 protein expression, whereas the transfection with the miR-145 inhibitor increased ADAM17 protein expression in both cell lines (Figure 2, A and B).
Figure 2.

miR-145 binds directly to the 3′UTR of ADAM17 mRNA. (A) Western blot analysis for ADAM17 of total lysates of Foehn cells transfected with control RNA (ctrl RNA), miR-145 mimic (miR-145), miR-145 inhibitor (miR-145 inh), or specific siRNA against ADAM17 (A17-siRNA). β-Actin was used to determine equal loading. The densitometrical analysis of the ADAM17 expression to β-actin is additionally depicted (n = 4). (B) Western blot analysis for ADAM17 of total lysates of A498 cells transfected with control RNA (ctrl RNA), miR-145 mimic (miR-145), miR-145 inhibitor (miR-145 inh), or specific siRNA against ADAM17 (A17-siRNA). β-Actin was used to determine equal loading. The densitometrical analysis of the ADAM17 expression to β-actin is additionally depicted (n = 3). (C) Luciferase assays with reporter constructs containing either ADAM17 3′UTR with the predicted miR-145 binding site or the mutated binding site. Furthermore, a reporter construct carrying the complement sequence of the mature form of miR-145 was transfected as positive control. The Renilla luciferase activity for each construct was normalized with firefly luciferase activities. Fold change = (Srenilla/Sfirefly)/(Crenilla/Cfirefly).
To investigate whether miR-145 represses ADAM17 expression through direct binding on the ADAM17 3′UTR, we introduced the predicted miR-145 binding site into the 3′UTR of a luciferase reporter gene. We found that the transfection of HEK293 cells with miR-145 mimics reduced the luciferase activity significantly, whereas it had no effects on the mutated binding site (Figure 2C).
Taken together, we observed that miR-145 regulates the protein expression of ADAM17, which might be due to the direct interaction of miR-145 with the 3′UTR of ADAM17 mRNA.
Inhibition of miR-143 Reduces ADAM17 Expression in Renal Cancer Cells
Because miR-145 is transcribed in a cluster with miR-143, and both have been shown to work synergistically in several cell models, we analyzed the expression of miR-143 in our renal cancer cell model. When comparing different renal cancer cell lines, the A498 cell line had the highest, whereas Foehn cells had the lowest expression of miR-143 (Figure 3A). The transfection of the Foehn cells with miR-145 mimic leads to an increase in miR-143 levels, whereas in the A498 cells this leads to a decrease of miR-143 expression (Figure 3, B and C). Interestingly, when we transfected the A498 cells with an miR-143 inhibitor, it led to a decrease in miR-145 expression (Figure 3D). Surprisingly, the inhibition of miR-143 led to a reduction of ADAM17 protein expression but showed that miR-143 and miR-145 do not regulate ADAM17 synergistically (Figure 3E).
Figure 3.

Inhibition of miR-143 reduces ADAM17 expression. (A) Relative real-time PCR of miR-143 expression in relation to U48 expression in RCC4, Foehn, and A498 cells. (B) Relative real-time PCR of miR-143 expression in relation to U48 expression in Foehn cells that were transfected with control RNA (ctrl RNA) or miR-145 mimic (miR-145). (C) Relative real-time PCR of miR-143 expression in relation to U48 expression in A498 cells that were transfected with control RNA (ctrl RNA) or miR-145 mimic (miR-145). (D) Relative real-time PCR of miR-143 and miR-145 expression in relation to U48 expression in A498 cells that were transfected with control LNA (ctrl LNA) or miR-143 LNA. (E) Western blot analysis for ADAM17 (A17) of total lysates of D. β-Actin antibody was used as a loading control.
ADAM17 Is Involved in the Effects of miR-145 on Proliferation and Invasion
To assess the functional role of miR-145 in renal cancer cells, we transfected Foehn cells with the miR-145 inhibitor and proliferation was measured (Figure 4A). Interestingly, miR-145 inhibitor-treated cells proliferated faster than control cells, whereas transfection with the miR-145 mimic led to a significant reduction in cell proliferation (Figure 4B). A cell cycle analysis was performed to determine the role of miR-145 in the regulation of the cell cycle. Importantly, the miR-145 mimic led to a 65% increase in cells in sub-G1/G0, whereas the miR-145 inhibitor led to a significant reduction of cells in sub-G1/G0 (Figure 4C). The sub-G1/G0 phase represents cells that harbor a fragmented nucleus, which is an early event during apoptosis in which endonucleases start to cleave the genomic DNA [57].
Figure 4.

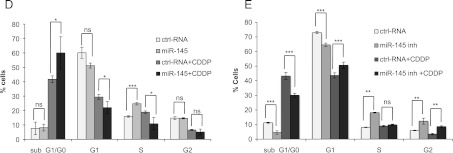

miR-145 reduces proliferation by induction of apoptosis. (A) Foehn cells were transfected with control RNA (ctrl RNA) or miR-145 inhibitor (miR-145 inh). Twenty-four hours after RNA transfection, anchorage-dependent cell growth was measured at the time points 24, 48, and 72 hours after RNA transfection using a 3-(4,5-dimethylthiazol-2-yl)-2,5-diphenyltetrazolium bromide (MTT) assay (n = 3). (B) Foehn cells were transfected with control RNA (ctrl RNA) or miR-145 mimic (miR-145). Twenty-four hours after RNA transfection, anchorage-dependent cell growth was measured at the time points 24, 48, and 72 hours after siRNA transfection using an MTT assay (n = 3). (C) Foehn cells were transfected with control RNA (ctrl RNA), miR-145 mimic (miR-145), or miR-145 inhibitor (miR-145 inh). Cell cycle analysis was performed as described in Materials and Methods section. The percentages of Foehn cells in the sub-G1/G0 (apoptosis), G1 (haploid genome), S (DNA synthesis), or G2 (diploid genome) phase are depicted (n = 3). (D) RCC4 cells were transfected with control RNA (ctrl RNA) or miR-145 mimic (miR-145). Forty-eight hours after transfection, 10 µg/ml cisplatin (CDDP) was added to the cells for 24 hours. Cells were harvested and measured by cell cycle analysis as described in Materials and Methods section. The percentage of cells in the sub-G1/G0 (apoptosis), G1 (haploid genome), S (DNA synthesis), or G2 (diploid genome) phase is displayed in a graph (n = 3). (E) RCC4 cells were transfected with control RNA (ctrl RNA) or miR-145 inhibitor (miR-145 inh). Forty-eight hours after transfection, 10 µg/ml CDDP was added to the cells for 24 hours. Cells were harvested and measured by cell cycle analysis as described in Materials and Methods section. The percentage of cells in the sub-G1/G0 (apoptosis), G1 (haploid genome), S (DNA synthesis), or G2 (diploid genome) phase is displayed (n = 3). (F) RCC4 cells were transfected with control RNA (ctrl RNA), miR-145 inhibitor (miR-145 inh), or miR-145 inhibitor with ADAM17 siRNA (miR-145 inh + A17si). Twenty-four hours after RNA transfection, anchorage-dependent cell growth was measured at the time points 24, 48, and 72 hours after RNA transfection using an MTT assay. (G) RCC4 cells were transfected with control RNA (ctrl RNA), miR-145 inhibitor (miR-145 inh), or ADAM17 siRNA together with miR-145 inhibitor (miR-145 inh + A17si). Invasion assay was performed using matrigelcoated transwell chambers. (H) RCC4 cells were transfected with control RNA (ctrl RNA), miR-145 inhibitor (miR-145 inh), or ADAM17 siRNA together with miR-145 inhibitor (miR-145 inh + A17si). The percentage of cells in the sub-G1/G0 (apoptosis) phase is displayed in a graph. (I) RCC4 cells were transfected with control RNA (ctrl RNA), miR-145 inhibitor (miR-145 inh), or ADAM17 siRNA together with miR-145 inhibitor (miR-145 inh + A17si). Cell lysates were investigated by Western blot using antibodies against ADAM17 (A17) and β-actin as a loading control. The densitometrical analysis of the ADAM17 expression to β-actin is additionally depicted. *P < .05, **P < .01, and P < .001 are considered statistically significant. ns, not significant.
We further observed that the amount of S-phase cells decreased after miR-145 transfection and increased significantly after transfection with miR-145 inhibitor. Because the S-phase represents cells during genome duplication, it can be used as an indirect measurement of cell proliferation (Figure 4C). Similar effects on cell cycle and proliferation were observed in A498 cells (Figure W2, A and B).
The role of miR-145 was further analyzed in RCC4 cells, which expressed the highest miR-145 levels. The transfection of RCC4 cells with miR-145 mimic and inhibitor was assessed by real-time PCR (Figure W1C). Interestingly, in contrast to Foehn and A498 cells, the transfection of miR-145 did not induce apoptosis in RCC4 cells (Figure 4D). Although no direct influence on cell death was observed, the role of miR-145 in the resistance of renal cancer cells against the chemotherapeutic reagent cisplatin (CDDP) was further investigated. Transfection of miR-145 mimic significantly increased the amount of apoptotic cells after the treatment with CDDP (Figure 4D). In contrast, the transfection with miR-145 inhibitor significantly reduced the number of cells in sub-G1/G0 CDDP treated and untreated (Figure 4E).
To investigate whether ADAM17 is involved in miR-145-regulated proliferation, RCC4 cells were transfected with miR-145 inhibitor and additionally with ADAM17 siRNA. The induced proliferation rate after transfection with miR-145 inhibitor was partially inhibited when ADAM17 was also silenced (Figure 4F). Similarly, increased invasion after miR-145 inhibition was partly abrogated by the down-regulation of ADAM17 (Figure 4G). In contrast, miR-145 inhibitor together with ADAM17 siRNA did not change the chemoresistance of RCC4 cells against CDDP when compared to the transfection of miR-145 inhibitor alone (Figure 4H). The down-regulation of ADAM17 by miR-145 in RCC4 cells was confirmed by Western blot analysis (Figure 3I). ADAM17 siRNA alone had no effect on proliferation or invasion in RCC4 cells (Figure W3, A and B).
ADAM17 Regulates miR-145 in a Reciprocal Negative Feedback Loop
Because it has been demonstrated that various miRNAs, including miR-145, can be regulated by positive or negative feedback loops, we analyzed whether also ADAM17 is able to regulate miR-145 expression [30,58,59].
Importantly, the down-regulation of ADAM17 led to a seven-fold induction of miR-145 expression (Figure 5A). One of the most prominent substrates of ADAM17 is TNF-α. To analyze whether the increase of miR-145 expression was mediated through the reduced cleavage of TNF-α, we treated the cells with recombinant TNF-α for 1 day, 48 hours after siRNA transfection. Importantly, TNF-α reduced the expression of miR-145 in the control transfected cells to about 40% (Figure 5A). In contrast, the seven-fold induction of miR-145 expression after ADAM17 down-regulation was abrogated by the addition of recombinant TNF-α (Figure 5A). These results suggest that the reduced cleavage of TNF-α after ADAM17 down-regulation leads subsequently to the up-regulation of miR-145.
Figure 5.
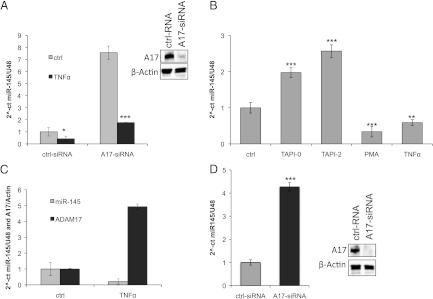
ADAM17 regulates miR-145 expression by cleavage of TNF-α. (A) Real-time PCR of miR-145 relative to U48 expression in RCC4 cells after transfection with either control RNA (ctrl RNA) or specific ADAM17 siRNA (A17-siRNA). Forty-eight hours after transfection, the cells were treated with control vehicle (bright bars) or with 10 nM TNF-α (dark bars). The Western blot analysis for ADAM17 (A17) of total lysates to control the efficient down-regulation is additionally depicted. β-Actin antibody was used as a loading control. (B) Real-time PCR of miR-145 expression relative to U48 expression in RCC4 cells after treatment for 24 hours with either control vehicle (ctrl), PMA (100 ng/ml), TNF-α (10 nM), or the metalloprotease inhibitors TAPI-0 and TAPI-2 (both 10 µM). *P < .05, **P < .01, and ***P < .001 are considered statistically significant. (C) Real-time PCR of miR-145 expression relative to U48 expression (gray bars) and ADAM17 expression to β-actin expression (black bars) in RCC4 cells after treatment for 24 hours with either control vehicle (ctrl) or TNF-α (10 nM). (D) Real-time PCR of miR-145 expression relative to U48 expression in Foehn cells after transfection with either control RNA (ctrl RNA, bright bars) or specific ADAM17 siRNA (A17-siRNA, dark bars). The Western blot analysis for ADAM17 (A17) of total lysates to control the efficient down-regulation is additionally depicted. β-Actin antibody was used as a loading control.
To substantiate this hypothesis, we treated the cells with the metalloprotease inhibitor TAPI-2 or the ADAM17-specific inhibitor TAPI-0, and miR-145 expression was assessed. Importantly, TAPI-0 and TAPI-2 increased the miR-145 expression about two-fold (Figure 5B). In contrast, TNF-α and PMA stimulation, which activates the shedding of ADAM17 substrates, lead to the reduction of miR-145 expression. Interestingly, when analyzing both the miR-145 and ADAM17 expression after the treatment with TNF-α, the ADAM17 expression increases five-fold in contrast to miR-145 expression (Figure 5C). Therefore, our data suggest that the soluble factors cleaved by ADAM17 could be major regulators of miR-145 expression. The regulation of miR-145 by ADAM17 was further validated in Foehn cells (Figure 5D).
miR-145 Is Downregulated by Promoter Methylation
Because it is known from prostate cancer that miR-145 is down-regulated by methylation, we examined whether methylation could also regulate miR-145 expression in renal cancer cells [37]. To test this hypothesis, we treated the cell lines A498, RCC4, and Foehn with AZA for 4 days. AZA leads to the demethylation of the DNA by inhibiting the DNA methyltransferase. AZA treatment resulted in an approximately 10-fold increase of mature miR-145 in A498 cells and a more than 40-fold increase in RCC4 and Foehn cells (Figure 6A). Because the increase should be reflected by an increase of the primary transcript, we measured the pri-miR-145, which shows no difference in A498 cells but a three-fold up-regulation in RCC4 and a six-fold up-regulation in Foehn cells (Figure 6B). In contrast, mature miR-143 expression, which is transcribed in a cluster with miR-145, showed no change in these cell lines (Figure 6C).
Figure 6.

miR-145 is downregulated by methylation in renal cancer cells. (A) Real-time PCR of miR-145 expression relative to U48 expression in A498, RCC4, and Foehn cells after treatment with either control vehicle (ctrl, bright bars) or AZA (10 µM, dark bars) for 72 hours. (B) Real-time PCR of pri-miR-145 expression relative to β-actin expression in A498, RCC4, and Foehn cells after treatment with either control vehicle (ctrl, bright bars) or AZA (10 µM, dark bars) for 72 hours. (C) Real-time PCR of miR-143 expression relative to U48 expression in A498, RCC4, and Foehn cells after treatment with either control vehicle (ctrl, bright bars) or AZA (10 µM, dark bars) for 72 hours. (D) A498, RCC4, and Foehn cells after treatment with either control vehicle (-) or AZA (10 µM, +) for 72 hours. Cell lysates were investigated by Western blot analysis with antibodies against ADAM17 and β-actin as a loading control.
To determine whether the increase of miR-145 after demethylation regulates also ADAM17 expression, we measured ADAM17 protein expression after AZA treatment. In line with the previous results, all tested renal cancer cell lines displayed a reduced ADAM17 expression after AZA treatment (Figures 6D and 7).
Figure 7.

Reciprocal negative feedback loop of miR-145 and ADAM17 is transmitted through TNF-α. (A) Endogenous expression of miR-145 in normal kidney cells leads to the down-regulation of ADAM17 expression. As a consequence, less substrates are released by ADAM17, leading to an even higher expression of miR-145. As a result, ADAM17 is weakly expressed, whereas the miR-145 expression is high. (B) miR-145 expression is suppressed in renal cancer cells by an initial event, like promoter methylation. This leads to an up-regulation of ADAM17 expression, resulting in an increase of ADAM17-mediated cleavage of substrates like TNF-α. The released substrates then further suppress the expression of miR-145, leading to a reciprocal negative feedback loop. As a result, ADAM17 expression is elevated in renal cancer patients, whereas miR-145 is downregulated.
Discussion
RCC is characterized by its resistance to current standard therapies [60]. Despite the rapid progress in the understanding of the molecular mechanisms of RCC, new treatment strategies are urgently needed.
In this context, ADAM metalloproteases are a promising family of proteins that are upregulated in several cancers [61]. miRNAs have been shown to be involved in the regulation of members of the ADAM family [16–18]. Furthermore, it has been demonstrated that the non-coding miRNAs have a versatile role for the regulation of genes during cancer development [62]. In the present study, miR-145 was identified as an miRNA that negatively regulates ADAM17. The binding was predicted by three different computational algorithms, providing a high probability that miR-145 would also regulate ADAM17 directly under physiological conditions. The binding has been additionally suggested by Gregersen et al. [41]. The regulation of ADAM17 by miR-145 was shown in different renal cancer cell lines by the transfection of miR-145 mimic as well as by inhibiting miR-145 expression. The overexpression of miR-145 led to massive reduction in ADAM17 protein expression, whereas the inhibition of miR-145 increased the amount of ADAM17, demonstrating the importance of miR-145 in the regulation of ADAM17. By performing mRNA reporter assay, we could show that miR-145 can directly bind to the predicted 3′UTR of ADAM17 mRNA.
The idea that miR-145 has also a role in the regulation of ADAM17 was supported by the finding that cancer cell lines have reduced miR-145 expression and increased ADAM17 expression when compared to renal tubular control cell line. Importantly, miR-145 is downregulated in many cancers, whereas different studies demonstrated that ADAM17 was upregulated in the same cancer types [3–11,25–28]. In this study, we could show that, in most renal cancer patients, miR-145 is down-regulated, whereas ADAM17 is upregulated. Moreover, the analysis of RCC patients revealed a significantly negative correlation of ADAM17 and miR-145, indicating that both genes are tightly regulated. Interestingly, the patient that was not included in the correlation had the worst clinical outcome with the highest number of metastases. This patient expressed the lowest relative amount of ADAM17 and miR-145, which could indicate that at this late stage ADAM17 might be downregulated by factors independent of miR-145. In agreement with our results, the down-regulation of miR-145 has been considered as an early event in other cancers, which has an influence on several tumor-promoting pathways [31,32].
miR-145 has been shown to be expressed in vascular SMCs, playing an essential role for smooth muscle development [22–24]. Similarly, we could detect strong miR-145 expression in vascular SMCs of the kidney. Additionally, we observed miR-145 expression in glomeruli and renal tubules, where the predominantly smaller tubules were positive for miR-145. In addition to the glomeruli, the Bowman's capsule and adjacent tubules expressed miR-145. These data suggest a role for miR-145 in normal adult glomeruli and renal tubules.
Our findings that miR-145 reduces proliferation and induces apoptotic cell death in renal cancer cells are in agreement with the results in other cancer types [36,58,63]. It was further demonstrated that ADAM17 is partially involved in the effects of miR-145 on proliferation and invasion, suggesting a role of additional target genes. Particularly, the regulation of the p53 repressor MDM2 by miR-145 could play a major role for the changes in cell cycle, chemoresistance, and proliferation [58]. Additionally, it was shown that miR-145 targets P70S6K1, which is important for the activation of the phosphatidylinositide 3-kinases (PI3K)/Akt pathway, resulting in reduced tumor growth [36].
We also demonstrated that not only miR-145 negatively regulates ADAM17 but ADAM17 also downregulates the miR-145 reciprocal negative feedback loop. Positive and negative feedback loops have been described for many miRNAs, including miR-145 [30,58,59]. Similarly to our work, Xu and colleagues observed a reciprocal negative feedback loop of miR-145 and Oct4, resulting either in pluripotent cells with low miR-145 expression or differentiated cells with high levels of miR-145 [35].
Reciprocal negative and positive feedback loops are often associated with a cell type switch that leads to a long-lasting cellular response [64,65].
Importantly, we showed that this regulation is transmitted by cleaved substrates of ADAM17, like TNF-α. TNF-α levels are often increased in the tumor microenvironment by tumor cells and by stroma cells, leading to a more tumorigenic tumor and increased metastasis. It would be interesting to investigate whether inhibition of the ADAM17 cleavage by specific inhibitors could reduce the cleaved substrates in the microenvironment and increase the miR-145 expression in tumor cells in vivo, thus resulting in better treatment options. Similar to our results, up-regulation of miR-145 in many cancer types induces antitumor properties like sensitivity toward chemotherapeutic treatment [26,29,30]. Moreover, we demonstrated that miR-145 is down-regulated by methylation, which is in agreement with studies in other cancer types [37–39]. The strong induction of miR-145 after the addition of the demethylation agent in three cell lines indicates a direct methylation of miR-145 and not a secondary effect through a secondary regulator. Interestingly, we observed an increase of mature miR-145 that was about 10 times higher than the amount of the primary transcript. It could be that the treatment with AZA also increases the processing of primary miR-145 to the mature form. In contrast, no strong differences in mature miR-143, which is transcribed as a cluster together with miR-145, were observed, and this might be due to differences in processing.
In the future, it would be important to analyze the methyla status of renal cancer patients. Given that, demethylation agents could be an important treatment option to increase miR-145 expression in renal cancer cells and thus sensitize renal cancer cells for therapy.
In summary, the data of the present work demonstrated that miR-145 is a tumor-suppressive miRNA in RCC that regulates the metalloprotease ADAM17. It could be a novel treatment strategy to increase the miR-145 expression by demethylation or by inhibiting the ADAM17 cleavage in renal cancer patients.
Supplementary Material
Acknowledgments
We thank Nicole Kämpfer-Kolb for her excellent technical assistance. We also thank Dario Alejandro Gutierrez for his great help and manuscript corrections.
Abbreviations
- ADAM
A disintegrin and metalloproteinase
- RCC
renal cell carcinoma
- TNF
tumor necrosis factor
Footnotes
This article refers to supplementary materials, which are designated by Figures W1 to W3 and are available online at www.neoplasia.com.
References
- 1.McLaughlin JK, Lipworth L. Epidemiologic aspects of renal cell cancer. Semin Oncol. 2000;27:115–123. [PubMed] [Google Scholar]
- 2.Campbell SC, Flanigan RC, Clark JI. Nephrectomy in metastatic renal cell carcinoma. Curr Treat Options Oncol. 2003;4:363–372. doi: 10.1007/s11864-003-0037-4. [DOI] [PubMed] [Google Scholar]
- 3.Lendeckel U, Kohl J, Arndt M, Carl-McGrath S, Donat H, Rocken C. Increased expression of ADAM family members in human breast cancer and breast cancer cell lines. J Cancer Res Clin Oncol. 2005;131:41–48. doi: 10.1007/s00432-004-0619-y. [DOI] [PMC free article] [PubMed] [Google Scholar]
- 4.Zheng X, Jiang F, Katakowski M, Kalkanis SN, Hong X, Zhang X, Zhang ZG, Yang H, Chopp M. Inhibition of ADAM17 reduces hypoxia-induced brain tumor cell invasiveness. Cancer Sci. 2007;98:674–684. doi: 10.1111/j.1349-7006.2007.00440.x. [DOI] [PMC free article] [PubMed] [Google Scholar]
- 5.Blanchot-Jossic F, Jarry A, Masson D, Bach-Ngohou K, Paineau J, Denis MG, Laboisse CL, Mosnier JF. Up-regulated expression of ADAM17 in human colon carcinoma: co-expression with EGFR in neoplastic and endothelial cells. J Pathol. 2005;207:156–163. doi: 10.1002/path.1814. [DOI] [PubMed] [Google Scholar]
- 6.Ding X, Yang LY, Huang GW, Wang W, Lu WQ. ADAM17 mRNA expression and pathological features of hepatocellular carcinoma. World J Gastroenterol. 2004;10:2735–2739. doi: 10.3748/wjg.v10.i18.2735. [DOI] [PMC free article] [PubMed] [Google Scholar]
- 7.Zhou BB, Peyton M, He B, Liu C, Girard L, Caudler E, Lo Y, Baribaud F, Mikami I, Reguart N, et al. Targeting ADAM-mediated ligand cleavage to inhibit HER3 and EGFR pathways in non-small cell lung cancer. Cancer Cell. 2006;10:39–50. doi: 10.1016/j.ccr.2006.05.024. [DOI] [PMC free article] [PubMed] [Google Scholar]
- 8.Tanaka Y, Miyamoto S, Suzuki SO, Oki E, Yagi H, Sonoda K, Yamazaki A, Mizushima H, Maehara Y, Mekada E, et al. Clinical significance of heparin-binding epidermal growth factor-like growth factor and a disintegrin and metalloprotease 17 expression in human ovarian cancer. Clin Cancer Res. 2005;11:4783–4792. doi: 10.1158/1078-0432.CCR-04-1426. [DOI] [PubMed] [Google Scholar]
- 9.Ringel J, Jesnowski R, Moniaux N, Luttges J, Choudhury A, Batra SK, Kloppel G, Lohr M. Aberrant expression of a disintegrin and metalloproteinase 17/tumor necrosis factor-α converting enzyme increases the malignant potential in human pancreatic ductal adenocarcinoma. Cancer Res. 2006;66:9045–9053. doi: 10.1158/0008-5472.CAN-05-3287. [DOI] [PubMed] [Google Scholar]
- 10.Sinnathamby G, Zerfass J, Hafner J, Block P, Nickens Z, Hobeika A, Secord AA, Lyerly HK, Morse MA, Philip R. ADAM metallopeptidase domain 17 (ADAM17) is naturally processed through major histocompatibility complex (MHC) class I molecules and is a potential immunotherapeutic target in breast, ovarian and prostate cancers. Clin Exp Immunol. 2011;163:324–332. doi: 10.1111/j.1365-2249.2010.04298.x. [DOI] [PMC free article] [PubMed] [Google Scholar]
- 11.Roemer A, Schwettmann L, Jung M, Stephan C, Roigas J, Kristiansen G, Loening SA, Lichtinghagen R, Jung K. The membrane proteases adams and hepsin are differentially expressed in renal cell carcinoma. Are they potential tumor markers? J Urol. 2004;172:2162–2166. doi: 10.1097/01.ju.0000144602.01322.49. [DOI] [PubMed] [Google Scholar]
- 12.Bell JH, Herrera AH, Li Y, Walcheck B. Role of ADAM17 in the ectodomain shedding of TNF-α and its receptors by neutrophils and macro-phages. J Leukoc Biol. 2007;82:173–176. doi: 10.1189/jlb.0307193. [DOI] [PubMed] [Google Scholar]
- 13.Arribas J, Esselens C. ADAM17 as a therapeutic target in multiple diseases. Curr Pharm Des. 2009;15:2319–2335. doi: 10.2174/138161209788682398. [DOI] [PubMed] [Google Scholar]
- 14.Franovic A, Robert I, Smith K, Kurban G, Pause A, Gunaratnam L, Lee S. Multiple acquired renal carcinoma tumor capabilities abolished upon silencing of ADAM17. Cancer Res. 2006;66:8083–8090. doi: 10.1158/0008-5472.CAN-06-1595. [DOI] [PubMed] [Google Scholar]
- 15.Scheller J, Chalaris A, Garbers C, Rose-John S. ADAM17: a molecular switch to control inflammation and tissue regeneration. Trends Immunol. 2011;32:380–387. doi: 10.1016/j.it.2011.05.005. [DOI] [PubMed] [Google Scholar]
- 16.Kim D, Song J, Kim S, Kang SS, Jin EJ. MicroRNA-142-3p regulates TGF-β3-mediated region-dependent chondrogenesis by regulating ADAM9. Biochem Biophys Res Commun. 2011;414:653–659. doi: 10.1016/j.bbrc.2011.09.104. [DOI] [PubMed] [Google Scholar]
- 17.Zhou C, Liu J, Li Y, Liu L, Zhang X, Ma CY, Hua SC, Yang M, Yuan Q. microRNA-1274a, a modulator of sorafenib induced a disintegrin and metalloproteinase 9 (ADAM9) down-regulation in hepatocellular carcinoma. FEBS Lett. 2011;585:1828–1834. doi: 10.1016/j.febslet.2011.04.040. [DOI] [PubMed] [Google Scholar]
- 18.Li H, Solomon E, Duhachek Muggy S, Sun D, Zolkiewska A. Metalloprotease-disintegrin ADAM12 expression is regulated by Notch signaling via microRNA-29. J Biol Chem. 2011;286:21500–21510. doi: 10.1074/jbc.M110.207951. [DOI] [PMC free article] [PubMed] [Google Scholar]
- 19.Lu PY, Xie F, Woodle MC. In vivo application of RNA interference: from functional genomics to therapeutics. Adv Genet. 2005;54:117–142. doi: 10.1016/S0065-2660(05)54006-9. [DOI] [PMC free article] [PubMed] [Google Scholar]
- 20.Ciafre SA, Galardi S, Mangiola A, Ferracin M, Liu CG, Sabatino G, Negrini M, Maira G, Croce CM, Farace MG. Extensive modulation of a set of microRNAs in primary glioblastoma. Biochem Biophys Res Commun. 2005;334:1351–1358. doi: 10.1016/j.bbrc.2005.07.030. [DOI] [PubMed] [Google Scholar]
- 21.Catto JW, Alcaraz A, Bjartell AS, De Vere White R, Evans CP, Fussel S, Hamdy FC, Kallioniemi O, Mengual L, Schlomm T, et al. MicroRNA in prostate, bladder, and kidney cancer: a systematic review. Eur Urol. 2011;59:671–681. doi: 10.1016/j.eururo.2011.01.044. [DOI] [PubMed] [Google Scholar]
- 22.Cordes KR, Sheehy NT, White MP, Berry EC, Morton SU, Muth AN, Lee TH, Miano JM, Ivey KN, Srivastava D. miR-145 and miR-143 regulate smooth muscle cell fate and plasticity. Nature. 2009;460:705–710. doi: 10.1038/nature08195. [DOI] [PMC free article] [PubMed] [Google Scholar]
- 23.Zhang C. MicroRNA-145 in vascular smooth muscle cell biology: a new therapeutic target for vascular disease. Cell Cycle. 2009;8:3469–3473. doi: 10.4161/cc.8.21.9837. [DOI] [PMC free article] [PubMed] [Google Scholar]
- 24.Cheng Y, Liu X, Yang J, Lin Y, Xu DZ, Lu Q, Deitch EA, Huo Y, Delphin ES, Zhang C. MicroRNA-145, a novel smooth muscle cell phenotypic marker and modulator, controls vascular neointimal lesion formation. Circ Res. 2009;105:158–166. doi: 10.1161/CIRCRESAHA.109.197517. [DOI] [PMC free article] [PubMed] [Google Scholar]
- 25.Volinia S, Calin GA, Liu CG, Ambs S, Cimmino A, Petrocca F, Visone R, Iorio M, Roldo C, Ferracin M, et al. A microRNA expression signature of human solid tumors defines cancer gene targets. Proc Natl Acad Sci USA. 2006;103:2257–2261. doi: 10.1073/pnas.0510565103. [DOI] [PMC free article] [PubMed] [Google Scholar]
- 26.Ostenfeld MS, Bramsen JB, Lamy P, Villadsen SB, Fristrup N, Sorensen KD, Ulhoi B, Borre M, Kjems J, Dyrskjot L, et al. miR-145 induces caspase-dependent and -independent cell death in urothelial cancer cell lines with targeting of an expression signature present in Ta bladder tumors. Oncogene. 2010;29:1073–1084. doi: 10.1038/onc.2009.395. [DOI] [PubMed] [Google Scholar]
- 27.Dyrskjot L, Ostenfeld MS, Bramsen JB, Silahtaroglu AN, Lamy P, Ramanathan R, Fristrup N, Jensen JL, Andersen CL, Zieger K, et al. Genomic profiling of microRNAs in bladder cancer: miR-129 is associated with poor outcome and promotes cell death in vitro. Cancer Res. 2009;69:4851–4860. doi: 10.1158/0008-5472.CAN-08-4043. [DOI] [PubMed] [Google Scholar]
- 28.Wang Y, Lee CG. MicroRNA and cancer—focus on apoptosis. J Cell Mol Med. 2009;13:12–23. doi: 10.1111/j.1582-4934.2008.00510.x. [DOI] [PMC free article] [PubMed] [Google Scholar]
- 29.Chiyomaru T, Enokida H, Tatarano S, Kawahara K, Uchida Y, Nishiyama K, Fujimura L, Kikkawa N, Seki N, Nakagawa M. miR-145 and miR-133a function as tumour suppressors and directly regulate FSCN1 expression in bladder cancer. Br J Cancer. 2010;102:883–891. doi: 10.1038/sj.bjc.6605570. [DOI] [PMC free article] [PubMed] [Google Scholar]
- 30.Spizzo R, Nicoloso MS, Lupini L, Lu Y, Fogarty J, Rossi S, Zagatti B, Fabbri M, Veronese A, Liu X, et al. miR-145 participates with TP53 in a death-promoting regulatory loop and targets estrogen receptor-α in human breast cancer cells. Cell Death Differ. 2010;17:246–254. doi: 10.1038/cdd.2009.117. [DOI] [PMC free article] [PubMed] [Google Scholar]
- 31.Michael MZ, O'Connor SM, van Holst Pellekaan NG, Young GP, James RJ. Reduced accumulation of specific microRNAs in colorectal neoplasia. Mol Cancer Res. 2003;1:882–891. [PubMed] [Google Scholar]
- 32.Sempere LF, Christensen M, Silahtaroglu A, Bak M, Heath CV, Schwartz G, Wells W, Kauppinen S, Cole CN. Altered microRNA expression confined to specific epithelial cell subpopulations in breast cancer. Cancer Res. 2007;67:11612–11620. doi: 10.1158/0008-5472.CAN-07-5019. [DOI] [PubMed] [Google Scholar]
- 33.Villadsen SB, Bramsen JB, Ostenfeld MS, Wiklund ED, Fristrup N, Gao S, Hansen TB, Jensen TI, Borre M, Orntoft TF, et al. The miR-143/-145 cluster regulates plasminogen activator inhibitor-1 in bladder cancer. Br J Cancer. 2012;106:366–374. doi: 10.1038/bjc.2011.520. [DOI] [PMC free article] [PubMed] [Google Scholar]
- 34.Chen Z, Zeng H, Guo Y, Liu P, Pan H, Deng A, Hu J. miRNA-145 inhibits non-small cell lung cancer cell proliferation by targeting c-Myc. J Exp Clin Cancer Res. 2010;29:151. doi: 10.1186/1756-9966-29-151. [DOI] [PMC free article] [PubMed] [Google Scholar]
- 35.Xu N, Papagiannakopoulos T, Pan G, Thomson JA, Kosik KS. MicroRNA-145 regulates OCT4, SOX2, and KLF4 and represses pluripotency in human embryonic stem cells. Cell. 2009;137:647–658. doi: 10.1016/j.cell.2009.02.038. [DOI] [PubMed] [Google Scholar]
- 36.Xu Q, Liu LZ, Qian X, Chen Q, Jiang Y, Li D, Lai L, Jiang BH. MiR-145 directly targets p70S6K1 in cancer cells to inhibit tumor growth and angiogenesis. Nucleic Acids Res. 2012;40:761–774. doi: 10.1093/nar/gkr730. [DOI] [PMC free article] [PubMed] [Google Scholar]
- 37.Suh SO, Chen Y, Zaman MS, Hirata H, Yamamura S, Shahryari V, Liu J, Tabatabai ZL, Kakar S, Deng G, et al. MicroRNA-145 is regulated by DNA methylation and p53 gene mutation in prostate cancer. Carcinogenesis. 2011;32:772–778. doi: 10.1093/carcin/bgr036. [DOI] [PMC free article] [PubMed] [Google Scholar]
- 38.Zaman MS, Chen Y, Deng G, Shahryari V, Suh SO, Saini S, Majid S, Liu J, Khatri G, Tanaka Y, et al. The functional significance of microRNA-145 in prostate cancer. Br J Cancer. 2010;103:256–264. doi: 10.1038/sj.bjc.6605742. [DOI] [PMC free article] [PubMed] [Google Scholar]
- 39.Iorio MV, Visone R, Di Leva G, Donati V, Petrocca F, Casalini P, Taccioli C, Volinia S, Liu CG, Alder H, et al. MicroRNA signatures in human ovarian cancer. Cancer Res. 2007;67:8699–8707. doi: 10.1158/0008-5472.CAN-07-1936. [DOI] [PubMed] [Google Scholar]
- 40.Kent OA, Chivukula RR, Mullendore M, Wentzel EA, Feldmann G, Lee KH, Liu S, Leach SD, Maitra A, Mendell JT. Repression of the miR-143/145 cluster by oncogenic Ras initiates a tumor-promoting feed-forward pathway. Genes Dev. 2010;24:2754–2759. doi: 10.1101/gad.1950610. [DOI] [PMC free article] [PubMed] [Google Scholar]
- 41.Gregersen LH, Jacobsen AB, Frankel LB, Wen J, Krogh A, Lund AH. MicroRNA-145 targets YES and STAT1 in colon cancer cells. PLoS One. 2010;5:e8836. doi: 10.1371/journal.pone.0008836. [DOI] [PMC free article] [PubMed] [Google Scholar]
- 42.Gutwein P, Schramme A, Abdel-Bakky MS, Doberstein K, Hauser IA, Ludwig A, Altevogt P, Gauer S, Hillmann A, Weide T, et al. ADAM10 is expressed in human podocytes and found in urinary vesicles of patients with glomerular kidney diseases. J Biomed Sci. 2010;17:3. doi: 10.1186/1423-0127-17-3. [DOI] [PMC free article] [PubMed] [Google Scholar]
- 43.Chen C, Ridzon DA, Broomer AJ, Zhou Z, Lee DH, Nguyen JT, Barbisin M, Xu NL, Mahuvakar VR, Andersen MR, et al. Real-time quantification of microRNAs by stem-loop RT-PCR. Nucleic Acids Res. 2005;33:e179. doi: 10.1093/nar/gni178. [DOI] [PMC free article] [PubMed] [Google Scholar]
- 44.Elbashir SM, Harborth J, Lendeckel W, Yalcin A, Weber K, Tuschl T. Duplexes of 21-nucleotide RNAs mediate RNA interference in cultured mammalian cells. Nature. 2001;411:494–498. doi: 10.1038/35078107. [DOI] [PubMed] [Google Scholar]
- 45.Jorgensen S, Baker A, Moller S, Nielsen BS. Robust one-day in situ hybridization protocol for detection of microRNAs in paraffin samples using LNA probes. Methods. 2010;52:375–381. doi: 10.1016/j.ymeth.2010.07.002. [DOI] [PubMed] [Google Scholar]
- 46.Gutwein P, Schramme A, Sinke N, Abdel-Bakky MS, Voss B, Obermuller N, Doberstein K, Koziolek M, Fritzsche F, Johannsen M, et al. Tumoural CXCL16 expression is a novel prognostic marker of longer survival times in renal cell cancer patients. Eur J Cancer. 2009;45:478–489. doi: 10.1016/j.ejca.2008.10.023. [DOI] [PubMed] [Google Scholar]
- 47.Mechtersheimer S, Gutwein P, Agmon-Levin N, Stoeck A, Oleszewski M, Riedle S, Postina R, Fahrenholz F, Fogel M, Lemmon V, et al. Ectodomain shedding of L1 adhesion molecule promotes cell migration by autocrine binding to integrins. J Cell Biol. 2001;155:661–673. doi: 10.1083/jcb.200101099. [DOI] [PMC free article] [PubMed] [Google Scholar]
- 48.Lee SB, Schramme A, Doberstein K, Dummer R, Abdel-Bakky MS, Keller S, Altevogt P, Oh ST, Reichrath J, Oxmann D, et al. ADAM10 is up-regulated in melanoma metastasis compared with primary melanoma. J Invest Dermatol. 2010;130:763–773. doi: 10.1038/jid.2009.335. [DOI] [PubMed] [Google Scholar]
- 49.Lewis BP, Burge CB, Bartel DP. Conserved seed pairing, often flanked by adenosines, indicates that thousands of human genes are microRNA targets. Cell. 2005;120:15–20. doi: 10.1016/j.cell.2004.12.035. [DOI] [PubMed] [Google Scholar]
- 50.Krek A, Grun D, Poy MN, Wolf R, Rosenberg L, Epstein EJ, MacMenamin P, da Piedade I, Gunsalus KC, Stoffel M, et al. Combinatorial microRNA target predictions. Nat Genet. 2005;37:495–500. doi: 10.1038/ng1536. [DOI] [PubMed] [Google Scholar]
- 51.Enright AJ, John B, Gaul U, Tuschl T, Sander C, Marks DS. MicroRNA targets in Drosophila. Genome Biol. 2003;5:R1. doi: 10.1186/gb-2003-5-1-r1. [DOI] [PMC free article] [PubMed] [Google Scholar]
- 52.Huang Y, Dai Y, Yang J, Chen T, Yin Y, Tang M, Hu C, Zhang L. Microarray analysis of microRNA expression in renal clear cell carcinoma. Eur J Surg Oncol. 2009;35:1119–1123. doi: 10.1016/j.ejso.2009.04.010. [DOI] [PubMed] [Google Scholar]
- 53.White NM, Khella HW, Grigull J, Adzovic S, Youssef YM, Honey RJ, Stewart R, Pace KT, Bjarnason GA, Jewett MA, et al. miRNA profiling in metastatic renal cell carcinoma reveals a tumour-suppressor effect for miR-215. Br J Cancer. 2011;105:1741–1749. doi: 10.1038/bjc.2011.401. [DOI] [PMC free article] [PubMed] [Google Scholar]
- 54.Wu X, Weng L, Li X, Guo C, Pal SK, Jin JM, Li Y, Nelson RA, Mu B, Onami SH, et al. Identification of a 4-microRNA signature for clear cell renal cell carcinoma metastasis and prognosis. PLoS One. 2012;7:e35661. doi: 10.1371/journal.pone.0035661. [DOI] [PMC free article] [PubMed] [Google Scholar]
- 55.Knepper MA. The aquaporin family of molecular water channels. Proc Natl Acad Sci USA. 1994;91:6255–6258. doi: 10.1073/pnas.91.14.6255. [DOI] [PMC free article] [PubMed] [Google Scholar]
- 56.Krutzfeldt J, Rajewsky N, Braich R, Rajeev KG, Tuschl T, Manoharan M, Stoffel M. Silencing of microRNAs in vivo with ‘antagomirs’. Nature. 2005;438:685–689. doi: 10.1038/nature04303. [DOI] [PubMed] [Google Scholar]
- 57.Nicoletti I, Migliorati G, Pagliacci MC, Grignani F, Riccardi C. A rapid and simple method for measuring thymocyte apoptosis by propidium iodide staining and flow cytometry. J Immunol Methods. 1991;139:271–279. doi: 10.1016/0022-1759(91)90198-o. [DOI] [PubMed] [Google Scholar]
- 58.Zhang J, Sun Q, Zhang Z, Ge S, Han ZG, Chen WT. Loss of microRNA-143/145 disturbs cellular growth and apoptosis of human epithelial cancers by impairing the MDM2-p53 feedback loop. Oncogene. 2012;32:61–69. doi: 10.1038/onc.2012.28. [DOI] [PubMed] [Google Scholar]
- 59.Ban J, Jug G, Mestdagh P, Schwentner R, Kauer M, Aryee DN, Schaefer KL, Nakatani F, Scotlandi K, Reiter M, et al. Hsa-mir-145 is the top EWS-FLI1-repressed microRNA involved in a positive feedback loop in Ewing's sarcoma. Oncogene. 2011;30:2173–2180. doi: 10.1038/onc.2010.581. [DOI] [PMC free article] [PubMed] [Google Scholar]
- 60.Cohen HT, McGovern FJ. Renal-cell carcinoma. N Engl J Med. 2005;353:2477–2490. doi: 10.1056/NEJMra043172. [DOI] [PubMed] [Google Scholar]
- 61.Mochizuki S, Okada Y. ADAMs in cancer cell proliferation and progression. Cancer Sci. 2007;98:621–628. doi: 10.1111/j.1349-7006.2007.00434.x. [DOI] [PMC free article] [PubMed] [Google Scholar]
- 62.Zhao L, Chen X, Cao Y. New role of microRNA: carcinogenesis and clinical application in cancer. Acta Biochim Biophys Sin (Shanghai) 2011;43:831–839. doi: 10.1093/abbs/gmr080. [DOI] [PubMed] [Google Scholar]
- 63.Yin R, Zhang S, Wu Y, Fan X, Jiang F, Zhang Z, Feng D, Guo X, Xu L. microRNA-145 suppresses lung adenocarcinoma-initiating cell proliferation by targeting OCT4. Oncol Rep. 2011;25:1747–1754. doi: 10.3892/or.2011.1252. [DOI] [PubMed] [Google Scholar]
- 64.Ferrell JE., Jr Self-perpetuating states in signal transduction: positive feedback, double-negative feedback and bistability. Curr Opin Cell Biol. 2002;14:140–148. doi: 10.1016/s0955-0674(02)00314-9. [DOI] [PubMed] [Google Scholar]
- 65.Pasquinelli AE. MicroRNAs and their targets: recognition, regulation and an emerging reciprocal relationship. Nat Rev Genet. 2012;13:271–282. doi: 10.1038/nrg3162. [DOI] [PubMed] [Google Scholar]
Associated Data
This section collects any data citations, data availability statements, or supplementary materials included in this article.