

Abstract
OBJECTIVE
To determine if prediabetes is associated with atherosclerosis of coronary arteries, we evaluated the degree of coronary atherosclerosis in nondiabetic, prediabetic, and diabetic patients by using coronary angioscopy to identify plaque vulnerability based on yellow color intensity.
RESEARCH DESIGN AND METHODS
Sixty-seven patients with coronary artery disease (CAD) underwent angioscopic observation of multiple main-trunk coronary arteries. According to the American Diabetes Association guidelines, patients were divided into nondiabetic (n = 16), prediabetic (n = 28), and diabetic (n = 23) groups. Plaque color grade was defined as 1 (light yellow), 2 (yellow), or 3 (intense yellow) based on angioscopic findings. The number of yellow plaques (NYPs) per vessel and maximum yellow grade (MYG) were compared among the groups.
RESULTS
Mean NYP and MYG differed significantly between the groups (P = 0.01 and P = 0.047, respectively). These indexes were higher in prediabetic than in nondiabetic patients (P = 0.02 and P = 0.04, respectively), but similar in prediabetic and diabetic patients (P = 0.44 and P = 0.21, respectively). Diabetes and prediabetes were independent predictors of multiple yellow plaques (NYPs ≥2) in multivariate logistic regression analysis (odds ratio [OR] 10.8 [95% CI 2.09–55.6], P = 0.005; and OR 4.13 [95% CI 1.01–17.0], P = 0.049, respectively).
CONCLUSIONS
Coronary atherosclerosis and plaque vulnerability were more advanced in prediabetic than in nondiabetic patients and comparable between prediabetic and diabetic patients. Slight or mild disorders in glucose metabolism, such as prediabetes, could be a risk factor for CAD, as is diabetes itself.
Diabetes mellitus is well known to be associated with an increased risk of mortality resulting from advanced systemic and cardiovascular atherosclerosis (1,2). In addition, there is growing evidence that nondiabetic levels of glucose metabolism, impaired fasting glucose (IFG), and impaired glucose tolerance (IGT) with a high risk for the development of diabetes are also related to an elevated risk of cardiovascular events and a poor prognosis (3,4). Recently, the American Diabetes Association (ADA) guidelines defined these categories, including IFG, IGT, or an HbA1c value in the range of 5.7–6.4%, as prediabetes (5). However, the morphology, vulnerability, and distribution of coronary atherosclerosis in prediabetic patients have not yet been fully validated. Coronary angioscopy is a useful imaging modality for assessing the characteristics of atherosclerotic plaques in vivo (6–11). Angioscopic yellow plaques are commonly identified in the culprit lesion in acute coronary syndromes (ACSs) (6–8), whereas the existence of multiple (≥2) yellow plaques (MYPs) per vessel has been found to be a risk factor for future cardiac events such as ACS (12). Therefore, angioscopic yellow plaques are considered to be vulnerable (13). The aim of this study was to evaluate and compare the degree of coronary atherosclerosis in patients with nondiabetes, prediabetes, and diabetes, according to the ADA classification, by using coronary angioscopy.
RESEARCH DESIGN AND METHODS
Patient population
Our institution has a database of angioscopic analysis at the beginning of introducing this technology. By using this system, data from 67 patients with coronary artery disease (CAD) who were observed by an angioscopic evaluation for multivessel CAD between September 2000 and July 2007 were retrospectively analyzed in this study. Patients were diagnosed as having stable angina pectoris if they had a positive stress test for myocardial ischemia and no change in the frequency, duration, or intensity of clinical symptoms within 4 weeks, including various combinations of chest, upper extremity, jaw, or epigastric discomfort or atypical symptoms (e.g., dyspnea or diaphoresis). Unstable angina pectoris was defined as new-onset severe angina, accelerated angina, or rest angina. Patients who did not have any of the above clinical symptoms were diagnosed as having silent myocardial ischemia. Patients diagnosed as having acute or recent (within 1 month from onset) myocardial infarction during this period were excluded. Based on the guidelines of the Japan Society for the Study of Obesity, obesity was defined as a BMI of ≥25 kg/m2. Blood samples were obtained from the antecubital vein in the fasting state and before each angioscopy procedure. The baseline diagnosis of glucose metabolism was based on the ADA guidelines (5). Diabetes was defined as a fasting plasma glucose (FPG) concentration of ≥126 mg/dL, self-reported clinician-diagnosed diabetes or an HbA1c level of ≥6.5% (National Glycohemoglobin Standardization Program). Prediabetes was defined as an FPG concentration of 100–125 mg/dL or an HbA1c level of 5.7–6.4%. Nondiabetes was defined as an FPG concentration of <100 mg/dL and an HbA1c level of ≤5.6%. The value of HbA1c (Japan Diabetes Society +0.4%) was estimated as a National Glycohemoglobin Standardization Program equivalent value calculated using the appropriate formula (14). The medical ethics committee at Nippon Medical School Chiba-Hokusoh Hospital approved this study protocol, and written informed consent was obtained from all patients before the catheterization procedures.
Angioscopic imaging and analysis
The coronary angioscopic procedure has been reported previously (6–11). Coronary arteries with proximal tortuosity, sharp angle, calcification, or ostial stenosis were not performed because of the expected difficulty in acquiring angioscopic images for the entire vessel. Before observation, the white balance was adjusted for color correction. The light power was adjusted to avoid reflection and obtain images with adequate brightness for determination of the plaque color. During angioscopic observations, an assistant adjusted the light power to maintain a constant brightness level on the target plaque. Angioscopic images and fluoroscopy during the angioscopic observations were recorded simultaneously on videotape for later analysis. The yellow grade was classified semiquantitatively according to the surface color as: 0, white; 1, light yellow; 2, yellow; and 3, intense yellow. Yellow plaque was defined simply as a yellow area on the luminal surface. The number of yellow plaques (NYPs) was determined for each vessel observed and averaged per vessel. The existence of MYPs was defined as NYPs ≥2 in at least one observed vessel. A ruptured plaque was considered to be a wall irregularity, including a tear, flap, or ulceration on the plaque surface. A thrombus was defined as a coalescent red superficial or protruding mass adhering to the vessel surface, but clearly a separate structure that remained after flushing with Ringer lactate. A representative case is shown in Fig. 1.
Figure 1.

Representative case with prediabetes diagnosis. No angiographic stenosis was observed in the right coronary artery (A), whereas an intramural red thrombus was observed at the proximal site (B), and three yellow plaques were identified on angioscopy (B–D). The yellow intensity of these plaques was defined as grades 1, 2, and 1, respectively. Significant stenosis was not observed in the left circumflex artery (E), whereas two yellow plaques were defined as grades 1 and 2, respectively (F and G). A 50% stenosis and a 90% stenosis were identified on angiography in the middle part of the left ascending artery (H). According to angioscopic findings, both these lesions were evaluated as grade 3 yellow plaques (I and J). In this case, the average NYP was 2.33 (seven yellow plaques in three vessels), and the MYG was 3.
Statistical analysis
All statistical analyses were performed using the SPSS software (version 11.0.1; SPSS Inc., Chicago, IL). Categorical variables are presented as frequencies, and these were compared using the Pearson χ2 test. Continuous quantitative data were presented as mean values ± SD. All variables were evaluated with ANOVA and the least significant difference statistical methods. Univariate logistic regression analysis was used to determine the clinical predictors (age, sex, other coronary risk factors, clinical presentation, medication, and laboratory data) for MYPs. Prediabetes and diabetes were categorized in each group as a reference of the nondiabetic group. Three values of prediabetes, diabetes, and LDL cholesterol (LDL-C) that achieved significant levels (P < 0.05) in a univariate logistic regression analysis were tested for their independent association with MYPs in a multivariate logistic regression model. All differences were evaluated at the 95% level of significance (P < 0.05).
RESULTS
Patient characteristics
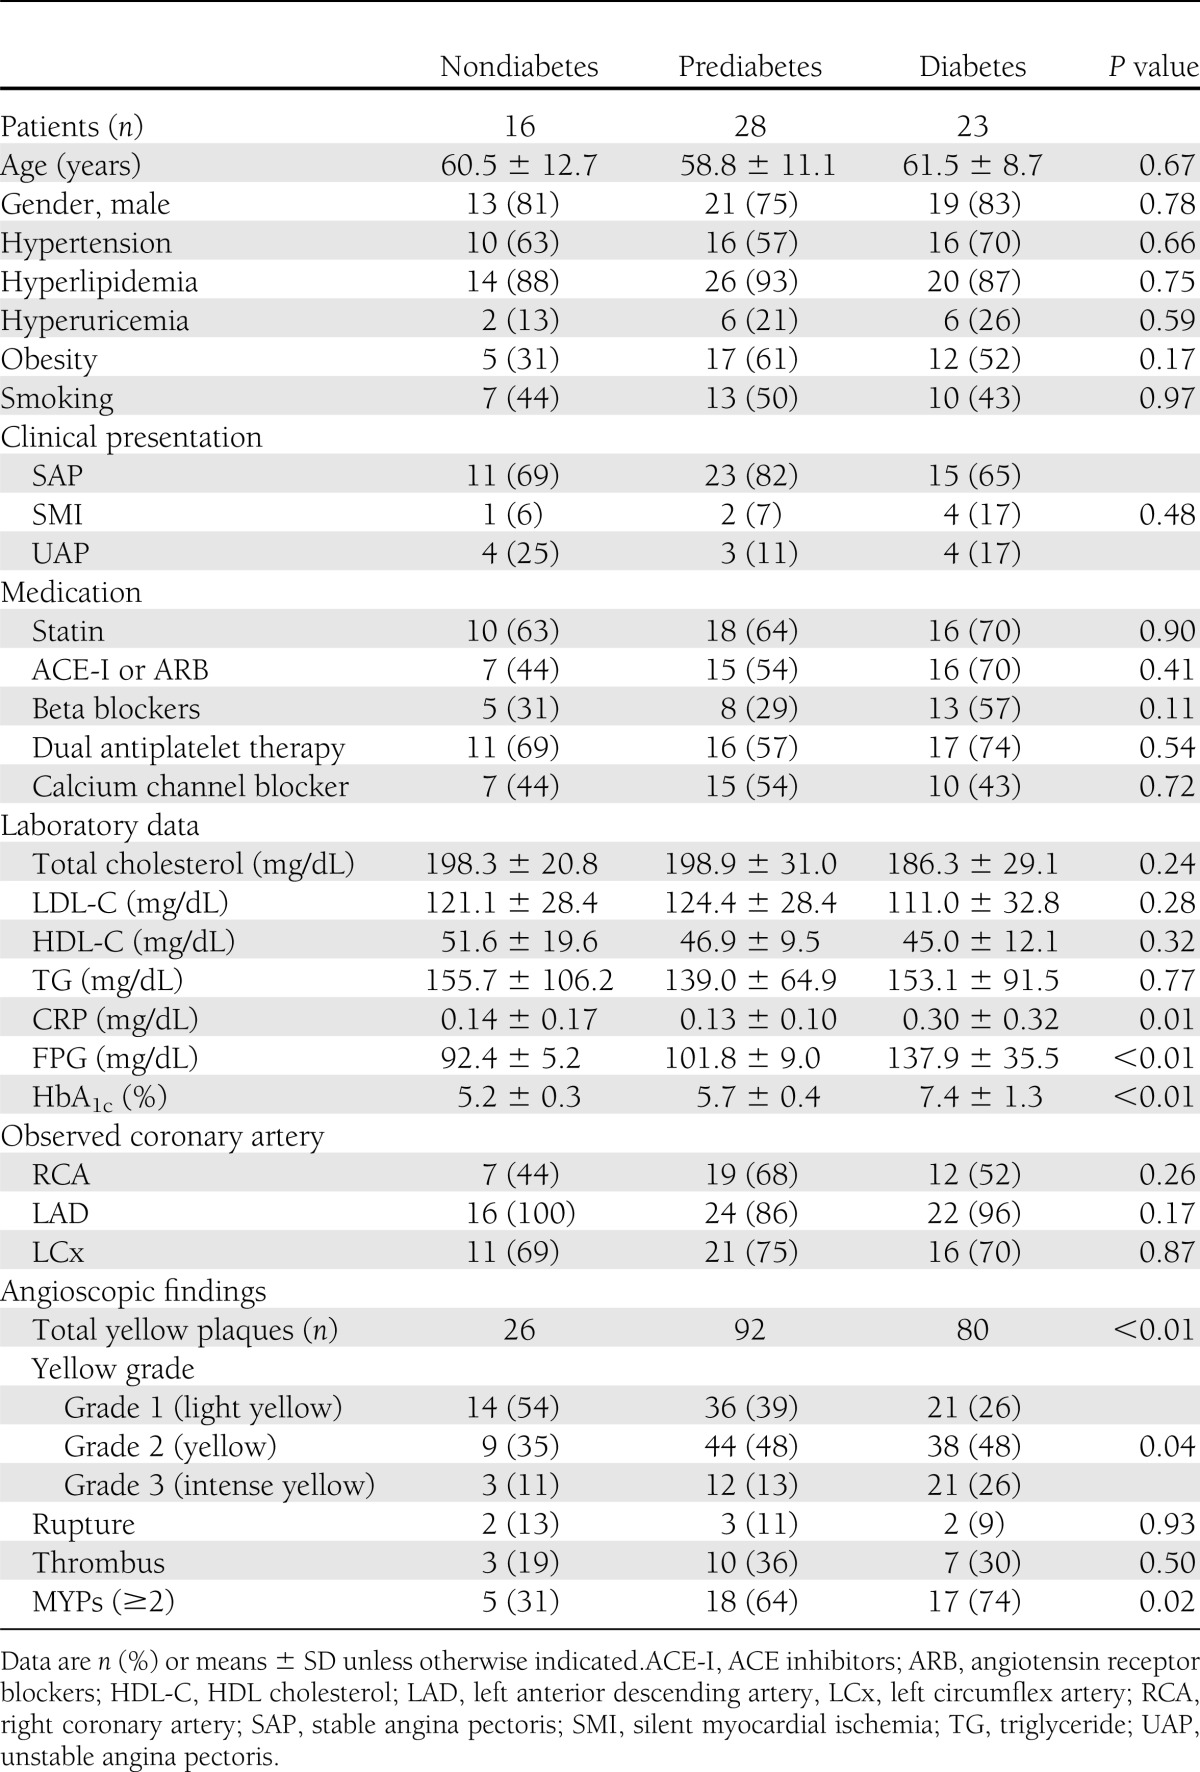
The clinical characteristics of the 67 patients are summarized in Table 1. Nondiabetes was diagnosed in 16 patients (24%), prediabetes in 28 patients (42%), and diabetes in 23 patients (34%). In the diabetic group, 2 patients (9%) were taking insulin and 14 (61%) oral hypoglycemic agents, whereas 7 patients (30%) were on diet therapy alone. Most parameters did not differ between the groups, the exceptions being serum FPG, HbA1c, and C-reactive protein (CRP) levels. Mean levels of FPG and HbA1c were higher in patients with prediabetes and diabetes than in nondiabetic patients (92 ± 5 vs. 102 ± 9 vs. 138 ± 36 mg/dL, P < 0.001; 5.2 ± 0.3 vs. 5.7 ± 0.4 vs. 7.4 ± 1.3%, P < 0.001; respectively). CRP levels were higher in the diabetic group than in the prediabetes and nondiabetic groups (0.14 ± 0.17 vs. 0.13 ± 0.10 vs. 0.30 ± 0.32 mg/dL; P = 0.012). Statins were prescribed equally in 63% of patients with nondiabetes, 64% of patients with prediabetes, and 70% of patients with diabetes (P = 0.90). As a result, mean levels of LDL-C were similar among the three groups (121 ± 28 vs. 124 ± 28 vs. 111 ± 33 mg/dL; P = 0.28).
Table 1.
Patient characteristics and angioscopic findings
Angioscopic findings
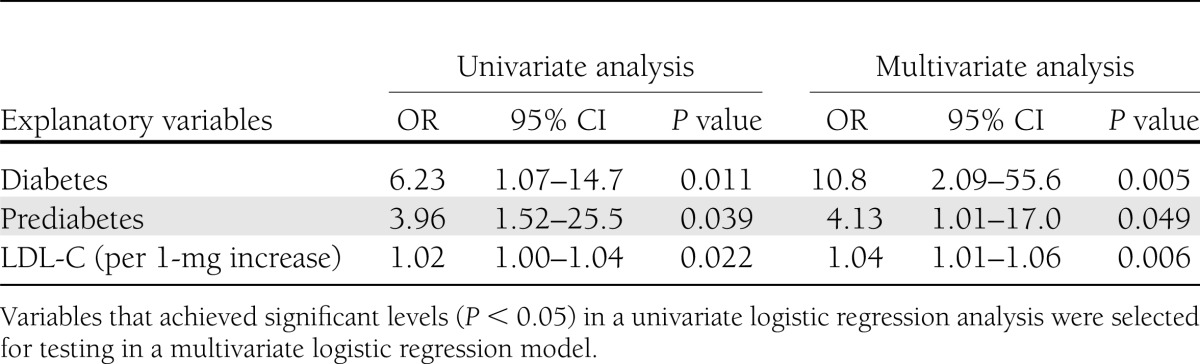
The angioscopic characteristics of the 67 patients at baseline are also shown in Table 1. The distributions of the coronary arteries observed were similar in the three groups. Total yellow plaque number and yellow intensity differed significantly among the three groups (P < 0.01 and P = 0.04, respectively). No significant differences were observed in the frequency of plaque rupture and thrombus (P = 0.89 and P = 0.50, respectively). MYPs were less prevalent in the nondiabetic group than in the prediabetes and diabetic groups (31 vs. 64 vs. 74%, respectively; P = 0.023). Both average NYPs per vessel and the maximum yellow grade (MYG) per coronary artery are shown in Fig. 2. These values also showed significant differences between the nondiabetes and the other two groups (0.80 ± 0.64 vs. 1.45 ± 0.81 vs. 1.63 ± 0.99, P = 0.011; and 1.44 ± 1.03 vs. 2.00 ± 0.86 vs. 2.30 ± 0.70, P = 0.047; respectively). More specifically, the NYP in the prediabetic group was greater than that in the nondiabetic group (P = 0.017), whereas it was similar to that in the diabetic group (P = 0.44). Similarly, the MYG in the prediabetic group was greater than that in the nondiabetic group (P = 0.040), whereas it was similar to that in the diabetic group (P = 0.21). Univariate logistic regression analysis (Table 2) showed that prediabetic, diabetic, and LDL-C levels were significantly associated with an increased risk of MYPs (P = 0.039, P = 0.011, and P = 0.022, respectively). These three variables were not attenuated in multivariate analysis (prediabetes: odds ratio [OR] 4.13 [95% CI 1.01–17.0], P = 0.049; diabetes: OR 10.8 [95% CI 2.09–55.6], P = 0.005; and LDL-C: OR 1.03 [95% CI 1.01–1.05], P = 0.006).
Figure 2.

Comparisons of angioscopic parameters among the three groups. The average NYP per vessel (A) and the average MYG per coronary artery (B). Coronary arteries in patients with prediabetes and diabetes had significantly more yellow plaques (0.80 ± 0.64 vs. 1.45 ± 0.81 vs. 1.63 ± 0.99; P = 0.011) and a significantly higher MYG (1.44 ± 1.03 vs. 2.00 ± 0.86 vs. 2.30 ± 0.70; P = 0.047) than those in patients without diabetes.
Table 2.
Logistic regression analysis for the predictors of MYPs
CONCLUSIONS
The current study revealed that the average NYP and MYG in prediabetic patients were greater than in those in nondiabetic patients, but similar to those in diabetic patients. Prediabetes and diabetes were significantly associated with the occurrence of MYPs inside the coronary arteries. These findings suggest that even prediabetic status is a sign that coronary atherosclerosis has already progressed to a degree similar to that seen in patients with diabetes and may entail an increased risk of CAD.
In general, patients with diabetes have accelerated coronary atherosclerosis, which aggravates the prognosis because of the high risk of a cardiovascular event (1,2). Prediabetic patients who subsequently develop diabetes are also considered to be high-risk subjects in terms of their cardiovascular mortality (3,4). Diabetes, hyperglycemia including prediabetes, free fatty acids, and insulin resistance provoke molecular mechanisms that alter the function and structure of blood vessels (15–17). These conditions affect vasoconstriction and inflammation and thereby promote coronary atherosclerosis starting in prediabetic status (18,19). Several investigations using coronary imaging modalities have already elucidated the specific features of advanced coronary atherosclerosis in patients with diabetes (20–23). In contrast, data concerning the relationship between prediabetes and the degree of coronary atherosclerosis using coronary imaging are limited. A clinical coronary angiography trial showed that coronary atherosclerosis developed not only in patients with diabetes but also in those with IGT (24). Another intravascular ultrasound study showed that patients with abnormal glucose regulation exhibited abundant lipid-rich plaques in their coronary lesions (25). The results of the current angioscopic study are consistent with these previous findings.
Postmortem pathological analysis has revealed that the main cause of ACS is plaque rupture following thrombus formation; a plaque that is prone to rupture is characterized by having an abundant necrotic core beneath a thin fibrous cap (26). In the human coronary artery, the plaques in ACS culprit lesions have been angioscopically identified as yellow (6–8). The relationship between fibrous cap thickness and yellow plaque intensity was investigated using multimodality coronary imaging in vivo (10,11). A fibrous cap thickness of <110 µm (as determined by optical coherence tomography) was considered as borderline; this determined whether the plaque color on coronary angioscopy was white or yellow (considered as a vulnerable plaque), and degree of yellow intensity was negatively correlated with the thickness of fibrous cap (10). Thus, the total NYPs represents the proliferation of coronary atherosclerosis overall, whereas the intensity of the yellow color reflects the plaque vulnerability. Because the average NYP and MYG were equivalent in both prediabetic and diabetic patients, patients with an early stage of glucose metabolism disorder may be likely to have advanced coronary atherosclerosis and be vulnerable to cardiovascular events. A pivotal prospective angioscopic investigation reported that the existence of MYPs (NYPs per vessel of ≥2) predicted future cardiac events (12). In our study, prediabetes, diabetes, and LDL-C were significant predictive factors for the existence of MYPs. Serum LDL-C concentration is known to affect the plaque component and volume (27,28). Lipid-lowering statin therapy has been found to reduce the intensity of the yellow plaque color, whereas the regression of the yellow intensity was positively correlated with the decrease in LDL-C on the basis of an angioscopic investigation (9). Consequently, patients with high values of LDL-C are likely to show many yellow plaques on angioscopy. Notably, not only diabetes but also prediabetes was a significant factor in the prediction of MYPs. The findings of a meta-analysis of randomized trials that enrolled a total of 23,152 patients with IGT and IFG are interesting (29). This study divided the population into two groups: aggressive medical treatment to prevent the progression of diabetes and no treatment. Then, they compared the clinical outcomes. Although the medical treatment group showed a significant reduction in future diabetes rates, the all-cause and cardiovascular mortalities were not reduced in comparison with controls. This result may be explained by our finding of equal atherosclerotic proliferation in the prediabetic and diabetic groups.
Limitations
The current study has several limitations. First, data comprise a retrospective analysis of patients in whom whole images of multivessel coronary arteries by angioscopy can be obtained. Second, the findings are from a single center and derived from a relatively small number of patients despite long-term study duration. Third, patients with ostial stenosis, proximally tortuous coronary arteries, or calcified lesions were excluded because of the difficulty in acquiring angioscopic images. Therefore, some selection bias is inevitable. Last, we were not able to determine any significant differences in the rates of all-cause death, myocardial death, and myocardial infarction among the three groups (data not shown). Because the event rates in all groups were quite low, it was not possible to examine the statistical significance in such a small sample.
In summary, the present angioscopic study indicates that the degree of coronary atherosclerosis is equivalent in patients with prediabetes and diabetes and that the former set of patients are therefore likely to be more vulnerable than individuals with normal glucose metabolism. Further clinical investigations will be required to create a basis for risk stratification and prevention of future cardiac events in patients with an early stage of glucose metabolism disorder.
Acknowledgments
No potential conflicts of interest relevant to this article were reported.
O.K. contributed to the study design and data collection, analyzed the collected data, and wrote the manuscript. M.T. contributed to the study design and data collection and wrote and revised the manuscript. M.Y. contributed to the study design and data collection, analyzed the collected data, and wrote and revised the manuscript. A.S., N.Ki. T.I., N.Ko., R.M., D.M., S.I., K.O., and T.O. contributed to data collection. C.I., N.H., Y.S., and K.M. revised the manuscript. All authors read the manuscript and approved the submission. M.T. is the guarantor of this work and, as such, had full access to all the data in the study and takes responsibility for the integrity of the data and the accuracy of the data analysis.
References
- 1.Stamler J, Vaccaro O, Neaton JD, Wentworth D. Diabetes, other risk factors, and 12-yr cardiovascular mortality for men screened in the Multiple Risk Factor Intervention Trial. Diabetes Care 1993;16:434–444 [DOI] [PubMed] [Google Scholar]
- 2.Haffner SM, Lehto S, Rönnemaa T, Pyörälä K, Laakso M. Mortality from coronary heart disease in subjects with type 2 diabetes and in nondiabetic subjects with and without prior myocardial infarction. N Engl J Med 1998;339:229–234 [DOI] [PubMed] [Google Scholar]
- 3.Unwin N, Shaw J, Zimmet P, Alberti KG. Impaired glucose tolerance and impaired fasting glycaemia: the current status on definition and intervention. Diabet Med 2002;19:708–723 [DOI] [PubMed] [Google Scholar]
- 4.Barr EL, Zimmet PZ, Welborn TA, et al. Risk of cardiovascular and all-cause mortality in individuals with diabetes mellitus, impaired fasting glucose, and impaired glucose tolerance: the Australian Diabetes, Obesity, and Lifestyle Study (AusDiab). Circulation 2007;116:151–157 [DOI] [PubMed] [Google Scholar]
- 5.American Diabetes Association Diagnosis and classification of diabetes mellitus. Diabetes Care 2010;33(Suppl. 1):S62–S69 [DOI] [PMC free article] [PubMed] [Google Scholar]
- 6.Mizuno K, Miyamoto A, Satomura K, et al. Angioscopic coronary macromorphology in patients with acute coronary disorders. Lancet 1991;337:809–812 [DOI] [PubMed] [Google Scholar]
- 7.Mizuno K, Satomura K, Miyamoto A, et al. Angioscopic evaluation of coronary-artery thrombi in acute coronary syndromes. N Engl J Med 1992;326:287–291 [DOI] [PubMed] [Google Scholar]
- 8.Okamatsu K, Takano M, Sakai S, et al. Elevated troponin T levels and lesion characteristics in non-ST-elevation acute coronary syndromes. Circulation 2004;109:465–470 [DOI] [PubMed] [Google Scholar]
- 9.Takano M, Mizuno K, Okamatsu K, Yokoyama S, Ohba T, Sakai S. Mechanical and structural characteristics of vulnerable plaques: analysis by coronary angioscopy and intravascular ultrasound. J Am Coll Cardiol 2001;38:99–104 [DOI] [PubMed] [Google Scholar]
- 10.Takano M, Jang IK, Inami S, et al. In vivo comparison of optical coherence tomography and angioscopy for the evaluation of coronary plaque characteristics. Am J Cardiol 2008;101:471–476 [DOI] [PubMed] [Google Scholar]
- 11.Yamamoto M, Takano M, Okamatsu K, et al. Relationship between thin cap fibroatheroma identified by virtual histology and angioscopic yellow plaque in quantitative analysis with colorimetry. Circ J 2009;73:497–502 [DOI] [PubMed] [Google Scholar]
- 12.Ohtani T, Ueda Y, Mizote I, et al. Number of yellow plaques detected in a coronary artery is associated with future risk of acute coronary syndrome: detection of vulnerable patients by angioscopy. J Am Coll Cardiol 2006;47:2194–2200 [DOI] [PubMed] [Google Scholar]
- 13.Naghavi M, Libby P, Falk E, et al. From vulnerable plaque to vulnerable patient: a call for new definitions and risk assessment strategies: Part I. Circulation 2003;108:1664–1672 [DOI] [PubMed] [Google Scholar]
- 14.The Committee of Japan Diabetes Society on the Diagnostic Criteria of Diabetes Mellitus Report of the Committee on the classification and diagnostic criteria of diabetes mellitus. J Japan Diab Soc 2010;53:460–467 [Google Scholar]
- 15.Brownlee M. Advanced protein glycosylation in diabetes and aging. Annu Rev Med 1995;46:223–234 [DOI] [PubMed] [Google Scholar]
- 16.Inoguchi T, Battan R, Handler E, Sportsman JR, Heath W, King GL. Preferential elevation of protein kinase C isoform beta II and diacylglycerol levels in the aorta and heart of diabetic rats: differential reversibility to glycemic control by islet cell transplantation. Proc Natl Acad Sci USA 1992;89:11059–11063 [DOI] [PMC free article] [PubMed] [Google Scholar]
- 17.Baynes JW. Role of oxidative stress in development of complications in diabetes. Diabetes 1991;40:405–412 [DOI] [PubMed] [Google Scholar]
- 18.Grundy SM. Pre-diabetes, metabolic syndrome, and cardiovascular risk. J Am Coll Cardiol 2012;59:635–643 [DOI] [PubMed] [Google Scholar]
- 19.Ferrannini E, Gastaldelli A, Iozzo P. Pathophysiology of prediabetes. Med Clin North Am 2011;95:327–339, vii–viii [DOI] [PubMed] [Google Scholar]
- 20.Schukro C, Syeda B, Yahya N, et al. Volumetric intravascular ultrasound imaging to illustrate the extent of coronary plaque burden in type 2 diabetic patients. J Diabetes Complications 2007;21:381–386 [DOI] [PubMed] [Google Scholar]
- 21.Marso SP, House JA, Klauss V, Lerman A, Margolis P, Leon MB, Global VH-IVUS Diabetes mellitus is associated with plaque classified as thin cap fibroatheroma: an intravascular ultrasound study. Diab Vasc Dis Res 2010;7:14–19 [DOI] [PubMed] [Google Scholar]
- 22.Lindsey JB, House JA, Kennedy KF, Marso SP. Diabetes duration is associated with increased thin-cap fibroatheroma detected by intravascular ultrasound with virtual histology. Circ Cardiovasc Interv 2009;2:543–548 [DOI] [PubMed] [Google Scholar]
- 23.Pundziute G, Schuijf JD, Jukema JW, et al. Type 2 diabetes is associated with more advanced coronary atherosclerosis on multislice computed tomography and virtual histology intravascular ultrasound. J Nucl Cardiol 2009;16:376–383 [DOI] [PubMed] [Google Scholar]
- 24.Kataoka Y, Yasuda S, Morii I, Otsuka Y, Kawamura A, Miyazaki S. Quantitative coronary angiographic studies of patients with angina pectoris and impaired glucose tolerance. Diabetes Care 2005;28:2217–2222 [DOI] [PubMed] [Google Scholar]
- 25.Amano T, Matsubara T, Uetani T, et al. Abnormal glucose regulation is associated with lipid-rich coronary plaque: relationship to insulin resistance. JACC Cardiovasc Imaging 2008;1:39–45 [DOI] [PubMed] [Google Scholar]
- 26.Virmani R, Burke AP, Farb A, Kolodgie FD. Pathology of the vulnerable plaque. J Am Coll Cardiol 2006;47(Suppl.):C13–C18 [DOI] [PubMed] [Google Scholar]
- 27.Cheng VY, Wolak A, Gutstein A, et al. Low-density lipoprotein and noncalcified coronary plaque composition in patients with newly diagnosed coronary artery disease on computed tomographic angiography. Am J Cardiol 2010;105:761–766 [DOI] [PubMed] [Google Scholar]
- 28.Hartmann M, von Birgelen C, Mintz GS, et al. Relation between plaque progression and low-density lipoprotein cholesterol during aging as assessed with serial long-term (> or =12 months) follow-up intravascular ultrasound of the left main coronary artery. Am J Cardiol 2006;98:1419–1423 [DOI] [PubMed] [Google Scholar]
- 29.Hopper I, Billah B, Skiba M, Krum H. Prevention of diabetes and reduction in major cardiovascular events in studies of subjects with prediabetes: meta-analysis of randomised controlled clinical trials. Eur J Cardiovasc Prev Rehabil 2011;18:813–823 [DOI] [PubMed] [Google Scholar]