

Abstract
Purpose
To demonstrate that hepatic tumor volume and enhancement pattern measurements can be obtained in a time efficient and reproducible manner on a voxel-by-voxel basis to provide a true 3D volumetric assessment.
Materials and Methods
Retrospective evaluation of MRI data obtained from 20 patients recruited for a single-institution prospective study. All patients carried a diagnosis of hepatocellular carcinoma (HCC) and underwent drug-eluting beads transcatheter arterial chemoembolization (DEB-TACE) for the first time. All patients had undergone contrast-enhanced MRI before and after DEB-TACE although poor image quality excluded 3 resulting in a final count of 17 patients. vRECIST and qEASL were measured and segmentation and processing times were recorded.
Results
Thirty-four scans were analyzed. The time for semi-automatic segmentation was 65±33 seconds with a range of 40–200 seconds. vRECIST and qEASL of each tumor were then computed less than one minute for each.
Conclusion
Semi-automatic quantitative tumor enhancement (qEASL) and volume (vRECIST) assessment is feasible in a workflow efficient time frame. Clinical correlation is necessary, but vRECIST and qEASL could become part of the assessment of intra-arterial therapy for interventional radiologists.
INTRODUCTION
Multi-phasic contrast-enhanced MRI is accepted as a gold standard for diagnosing liver tumors and assessing treatment response after locoregional therapy, especially following Transcatheter Arterial Chemo-Embolization (TACE) (1, 2). Measuring changes in tumor size (Response Evaluation Criteria in Solid Tumors, RECIST), enhancement (European Association for the Study of the Liver, EASL), and tumor enhancement size (modified RECIST, mRECIST) on MRI are the three accepted methods to assess response to TACE (3).
The first, RECIST, evaluates response to treatment based on changes in tumor size (RECIST 1.0 & 1.1 criteria) (1, 4), whereas the second, EASL (5), evaluates response to treatment based on changes in tumor enhancement, and the third, mRECIST, evaluates response based on changes in size of tumor enhancement (6). Although these three methods are widely used, they have some limitations when applied to TACE. TACE results in inhomogeneous tumor necrosis, and as a result, tumor enhancement becomes heterogeneous and changes in tumor size are inhomogeneous (7). This makes current methods of tumor response assessment difficult after TACE.
Furthermore, RECIST, mRECIST, and EASL are applied to one representative axial slice of the tumor (1, 5, 6). As a result, different slice selection can lead to different response assessments. Additionally, in the case of RECIST, the measurements comprise the longest diameter on the specified slice without accounting for the volume of the tumor (1). For EASL, the percent enhancement of the tumor area is made based on visual inspection and grouped into brackets. At our institution, these are quartile brackets (3). This assessment can be particularly inaccurate if the enhancement percentage is at the threshold between two quartiles. Recently, mRECIST has been described as a better criteria to assess tumor response because it takes into account the size of the enhancing tumor (a mix between RECIST and EASL) (8). However, like EASL and RECIST, it also does not take into account the entire tumor volume.
Our hypothesis was to demonstrate that hepatic tumor volume and enhancement pattern measurements in a time efficient and reproducible manner on a voxel-by-voxel basis are possible, giving a true 3D volumetric assessment. To our knowledge, no previous work has demonstrated all of these features. This was accomplished by using semi-automatic tumor segmentation to 1) determine tumor volumes, 2) determine enhancement for the entire tumor volume, and 3) determine the percentage of enhancing tumor volume. We propose that these measures be called quantitative EASL (qEASL) and volumetric RECIST (vRECIST).
MATERIALS AND METHODS
To ensure consistency in reporting of results, this manuscript follows the Society of Interventional Radiology Reporting Standards on transcatheter therapy for hepatic malignancy (9).
Study Cohort
This was a single-institution prospective study (Health Insurance Portability and Accountability Act – HIPPA compliant and Institutional Review Board – IRB approved) where the analysis was retrospectively performed. The prospective study was a single-center phase II trial of drug-eluting beads TACE (DEB-TACE) for patients with HCC (10). All patients provided written informed consent before inclusion in this study. Detailed information on the eligibility criteria for performing DEB-TACE and the procedure protocol can be found in Reyes et. al.’s work (10). Specific to this study, our study group included all patients who had undergone dynamic contrast-enhanced MR imaging before and 1 month after DEB-TACE. From November 1, 2005 to February 8, 2008, 20 patients fulfilled the inclusion criteria. Patients with poor MRI image quality (n = 3) because of severe image artifacts (i.e. breathing motion) were excluded, resulting in a final count of 17 patients who were included for this study. The tumor segmentation software (described below), which is the basis of this study, was created and made available recently.
MR Imaging Technique
All patients underwent baseline (within 6 weeks prior to initial DEB-TACE) and follow-up (approximately 1 month after the procedure) MR imaging using a 1.5-T MR unit (CV/I, GE Medical Systems, Milwaukee, WI, USA) and a phased-array torso coil. All scans within the pre- and post-DEB-TACE were performed sequentially in the same imaging session. The imaging protocol included axial breath-hold unenhanced and contrast-enhanced (0.1 mmol/kg IV of gadodiamide, Omniscan, General Electric, Princeton, NJ) T1-weighted 3D fat-suppressed spoiled gradient-echo images (TR/TE, 5.1/1.2 msec; field of view, 320–400 mm2; matrix size, 192 × 160; slice thickness, 4–6mm consecutive slices; receiver bandwidth, 64-kHz; flip angle, 15°) in the arterial and portal venous phases (20 and 70 seconds after intravenous contrast administration, respectively).
Semi-automatic Tumor Segmentation
Semi-automatic 3D volume segmentation was performed by an experienced interventional radiologist (___ 9 years of experience), who did not perform the DEB-TACE procedures, on the 20 second pre- and post-DEB-TACE contrast-enhanced MRIs to segment the tumors. Briefly, this in-house software (Philips Healthcare, Suresnes, France, potential release to the market in <5 years) is inspired by non-Euclidean geometry and theory of radial basis functions and allows for segmentations that follow 3D image features including straight edges and corners (11, 12). The algorithm used is based on the linear combination of image dependent shapes. Each shape is built based on image features located in a 3D region whose center and size are specified by the user (interactively, this information is recovered by a mouse click followed by a mouse drag). The combination of the segmentation shape construction is done through the optimization of an image-based criterion (e.g. maximizing the gradient flow through the boundary of the combination). In practice, the user identifies an initial control point. From there, the user can interactively expand or contract the 3D region of interest. Additional segmentations can be included by placing more control points. Corrections are made in the same volumetric way. This method can accurately segment in 3D, yet needs minimal user interaction (13). Manual segmentation requires a high level of expertise and incorporates an expert’s knowledge to make accurate segmentations. This semi-automatic method provides similar results but only at a fraction of user interaction time. For this study, the segmentation time was recorded.
Imaging Data Evaluation – Volumetric RECIST (vRECIST)
The main advantage of vRECIST is that the calculation of volume eliminates potential variability in the assessment based on slice selection. vRECIST was calculated as follows:
A semi-automatic 3D tumor segmentation using non-Euclidean radial basis functions was performed as described above on the 20 second contrast enhanced MR scan.
The volume was directly calculated based on this segmentation. Specifically, the number of voxels in the segmentation was multiplied by the voxel dimensions.
The vRECIST therapy response was calculated as the pre- minus post-vRECIST values, so a positive change value in vRECIST indicated a decrease in tumor volume after DEB-TACE. A percent change was also calculated as (pre- minus post-vRECIST) divided by pre-vRECIST. The processing time for vRECIST was recorded.
Imaging Data Evaluation – Quantitative EASL (qEASL)
qEASL was calculated as follows:
A semi-automatic 3D tumor segmentation was performed as described above on the 20 second contrast enhanced MR scan.
The pre-contrast MR scan was subtracted from the 20 second scan to remove background enhancement as in (14, 15).
The 3D segmented volume region from #1 was applied to #2.
From #2, average enhancement values were obtained from a region of interest (ROIs) formed by 10×10×10 voxels identified as normal liver parenchyma.
Viable tumor was defined as areas in #3 where the enhancement was more than that of the normal parenchyma ROI found in #4.
Based on #5, the volume of viable tumor (a subset of what was found for vRECIST total tumor volume) was measured and expressed as qEASL in cm3.
The viable tumor was also defined as a % of the total tumor volume and expressed as qEASL in %.
A color map was overlayed on the 20 second MR scan to show volumetric and regional tumor enhancement heterogeneity. Colored regions of the segmented tumor indicate enhancement beyond that of healthy liver tissue. The color map for each patient was normalized to the maximum enhancement in the entire tumor of the pre-DEB-TACE scan. This ensured that the post-treatment color map used the same scale for comparison with the pre-treatment color bar. In the color bar, red represented maximum enhancement (viable tumor) and blue represented minimum enhancement (treated/non-viable tumor). The qEASL therapy responses were calculated as the pre- minus post-qEASL values for viable tumor volume and % enhancement. A positive change value in qEASL indicated a decrease in viable tumor volume or % tumor enhancement after DEB-TACE. A percent change was also calculated as (pre- minus post-qEASL) divided by pre-qEASL. The processing time for qEASL was recorded.
RESULTS
Patient Demographics
Seventeen patients with unresectable HCC (11 male; 6 female; mean age 61.2 years ±12.8 [range, 40–84 years]) were included in this study. All patients successfully completed both baseline pre- and post-DEB-TACE MRI (34 total MRI examinations). Each patient underwent one selective DEB-TACE session between the pre- and post-MRI. All procedures were performed successfully, without immediate complications. Table 1 summarizes the demographic data for this 17-patient cohort. The majority of these HCC patients had preserved underlying liver function (Child-Pugh class A (13/17, 76.5%)). Most patients (14/17, 82.4%) had cirrhosis, and 64.7% were classified as Barcelona Clinic Liver Cancer (BCLC) grade C (A/B/C/D: 2/4/11/0).
Table 1.
Patient Demographics Baseline characteristics of patients with hepatocellular carcinoma prior to treatment
| Baseline Characteristics | Value (n or mean ± SD) |
|---|---|
| Demographics | |
| No. patients | 17 |
| Age (Year) | 61.2 ± 12.8 [range 40–84] |
| Sex ratio (Male/Female) | 11/6 |
| Race (White/African-American/Hispanic) | 12/4/1 |
| Etiology (Alcohol/HCV/HBV/NASH/Hemochromatosis/Unknown) | 2/6/5/1/1/5 |
| ECOG performance status (0/1/2/3) | 7/9/1 |
| Cirrhosis (Present/Absent) | 14/3 |
| Type (Unifocal/Multifocal/Diffuse) | 11/6/0 |
| Portal vein thrombosis (Yes/No) | 3/14 |
| Tumor size* (mm) | 7.1 ± 3.8 [range 2.8–16.2] |
| HCC staging | |
| Child-Pugh class (A/B/C) | 13/4/0 |
| BCLC stage (A/B/C/D) | 2/4/11/0 |
| Okuda stage (I/II/III) | 11/6/0 |
| Serum tests | |
| Basal AFP (ng/mL) | 701±1151 [range 2–4189] |
| <10 | 2 |
| 10–200 | 6 |
| >200 | 9 |
| Albumin (g/dL) | 3.5±0.6 [range 2.6–4.6] |
| Total bilirubin (mg/dL) | 1.0±0.3 [range 0.6–1.6] |
| AST (U/L) | 66.4±30.4 [range 20–125] |
| ALT (U/L) | 66.2±35.3 [range 13–125] |
| Alkaline phosphatase (U/L) | 170.2±74.2 [range 73–305] |
| INR | 1.1±0.1 [range 1–1.3] |
Note.–HCV, Hepatitis C Virus; HBV, Hepatitis B Virus; NASH, Non-Alcoholic Steato-Hepatitis; ECOG, Eastern Cooperative Oncology Group; HCC, Hepatocellular Carcinoma; BCLC, Barcelona Clinic Liver Cancer; AFP, Alpha-Feto-Protein; AST, Aspartate Aminotransferase; ALT, Alanine Aminotransferase; INR, International Normalized Ratio.
One-dimensional measure of the longest dimension as measured by MRI.
Semi-automatic Tumor Segmentation
The average time it took to segment each of the 34 MRI examinations (17 pre- and 17-post-DEB-TACE) was 65±33 seconds with a range of 40–200 seconds. As seen in the vRECIST and qEASL figures 1–3, the segmented volumes visually match the tumor boundaries very well.
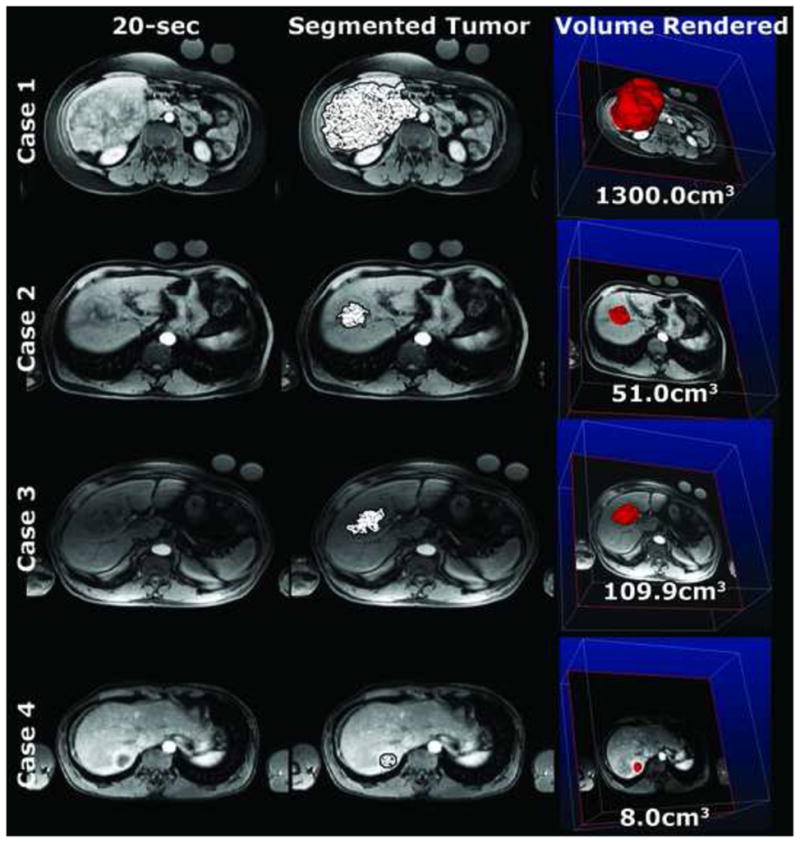
Figure 1.

vRECIST pre-DEB-TACE. Note how the semi-automatic tumor segmentation (patterned overlay) aligns well with the actual tumor borders. The quantitative volumes are of the entire segmented tumor.
Figure 3.
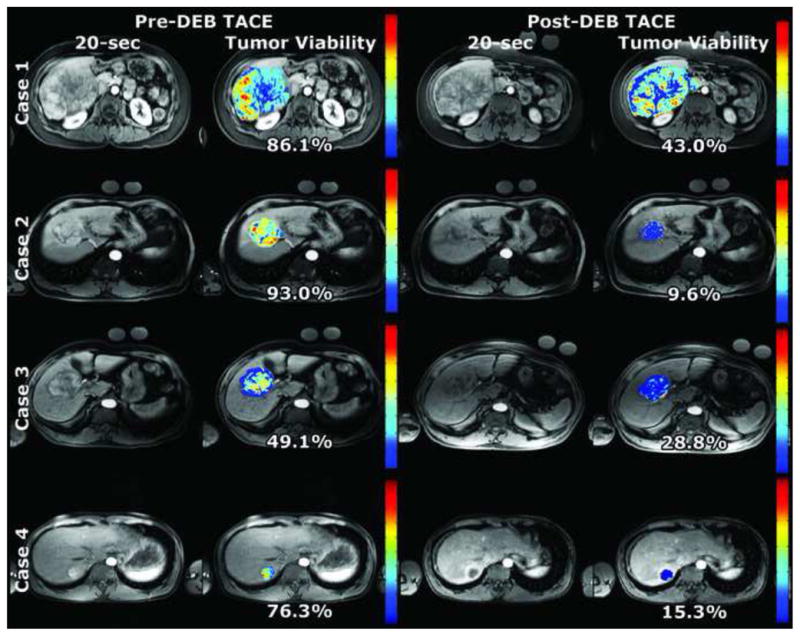
qEASL pre- and post-DEB-TACE. Note the heterogeneity in tumor enhancement as seen on the color maps. Much of the viable tumor (yellow and red) became less enhanced after DEB-TACE and appears as blue in the post-treatment color map. The tumor viability % is a specific quantitative value representing the percent of the entire tumor volume showing enhancement more than healthy liver tissue. The color bar per patient case is normalized to the maximum enhancement measured in the pre-DEB-TACE tumor volume.
Volumetric RECIST (vRECIST)
Four representative patients, 8 MRI examinations total (4 pre-DEB-TACE, Figure 1 and 4 post-DEB-TACE, Figure 2), were used to visualize the segmented tumor with a patterned overlay on a representative axial slice from the 20-second scan. The 3D segmentation allowed for a volume rendering of the tumor (right most column). The average time it took for segmenting these 8 MRI examinations was 82±53 seconds (range 40–200 seconds). For these cases, the tumor volumes (vRECIST) were found to be in the range of 15.9–952.0cm3 and 8.0–1300.0 cm3 for pre- and post-DEB-TACE, respectively. Specific vRECIST values for these four patient cases (boxed in the table) and the 13 others are shown in Table 2. In 9 (53%) patients, the change in vRECIST after DEB-TACE was found to be a decreasing tumor volume (positive change in vRECIST value), indicative of successful early therapy response. Eight (47%) patients did show an increase in tumor volume (negative change in vRECIST value), which is likely due to edema following TACE. The computation time for each patient case to process vRECIST was < 1 minute.
Figure 4.
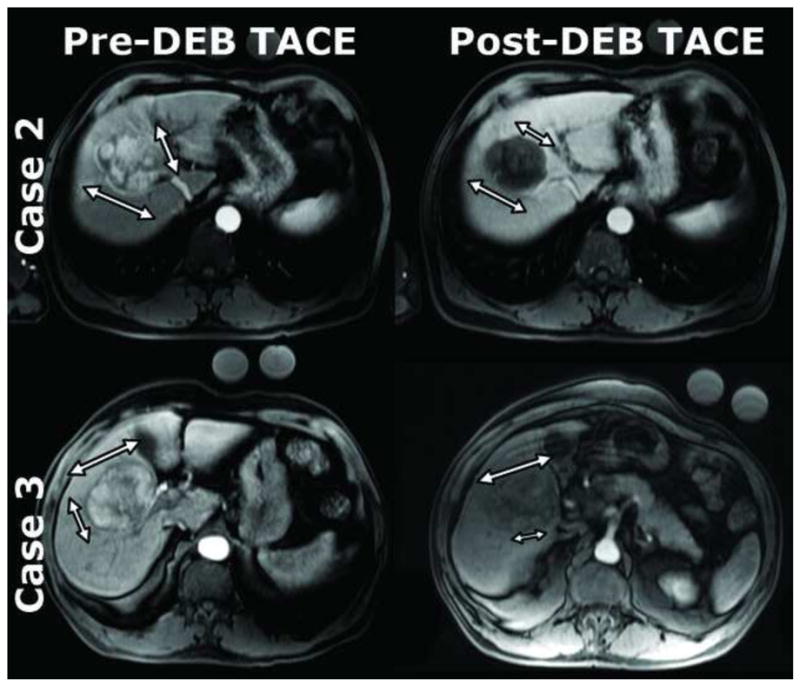
Two representative cases of the same patients in the prior figures (case 2 and 3) that exemplify limitations of current methods. The mRECIST measurements (smaller arrows in each pane) and EASL measurements were confounded by tumor enhancement heterogeneity. RECIST measurements (large arrow in each pane) largely remained the same though there was substantial tumor enhancement change after DEB-TACE. Case 2 – RECIST (pre-DEB-TACE: 5.7cm × 6.2cm; post-DEB-TACE: 5.3cm × 5.2cm), mRECIST (pre-DEB-TACE: 5.1cm; post-DEB-TACE: 3.5cm), EASL (pre-DEB-TACE: 75–100%; post-DEB-TACE: 0–25%). Case 3 – RECIST (pre-DEB-TACE: 5.0cm × 6.8cm; post-DEB-TACE: 6.3cm × 4.4cm), mRECIST (pre-DEB-TACE: 4.0cm; post-DEB-TACE: 3.0cm), EASL (pre-DEB-TACE: 75–100%; post-DEB-TACE: 25–50%).
Figure 2.
vRECIST post-DEB-TACE of the same patients as in Figure 1 at similar slice levels. The quantitative volumes are of the entire segmented tumor.
Table 2.
Tumor segmentation time, vRECIST, and qEASL results of 17 patients before and after DEB-TACE. Images are shown of representative patient cases 1–4 (boxed above).
| Patient | Segmentation Time (sec) | vRECIST (cm3) | qEASL | Therapy Response | |||
|---|---|---|---|---|---|---|---|
| (cm3) | (%) | vRECIST | qEASL | ||||
| 1-Pre | 200 | 952.0 | 819.9 | 86.1 | −348.0cm3 | 261.0cm3 | 43.1% |
| -Post | 90 | 1300.0 | 558.9 | 43.0 | −36.6% change | 31.8% change | 50.1% change |
|
| |||||||
| 2-Pre | 90 | 124.2 | 115.5 | 93.0 | 73.2cm3 | 110.6cm3 | 83.4% |
| -Post | 50 | 51.0 | 4.9 | 9.6 | 58.9% | 95.8% | 89.7% |
|
| |||||||
| 3-Pre | 90 | 197.8 | 97.1 | 49.1 | 87.9cm3 | 65.5cm3 | 20.3% |
| -Post | 50 | 109.9 | 31.6 | 28.8 | 44.4% | 67.5% | 41.3% |
|
| |||||||
| 4-Pre | 40 | 15.9 | 12.2 | 76.3 | 7.9cm3 | 11.0cm3 | 61.0% |
| -Post | 50 | 8.0 | 1.2 | 15.3 | 49.7% | 90.2% | 79.9% |
|
| |||||||
| 5-Pre | 90 | 1370.3 | 54.5 | 4.0 | −1075.1cm3 | −15.1cm3 | 1.2% |
| -Post | 80 | 2445.4 | 69.6 | 2.8 | −78.5% | −27.7% | 30.0% |
| 6-Pre | 40 | 336.4 | 201.4 | 59.9 | −16.6cm3 | −65.7cm3 | −15.8% |
| -Post | 50 | 353.0 | 267.1 | 75.7 | −4.9% | −32.6% | −26.4% |
| 7-Pre | 40 | 29.6 | 7.7 | 26.1 | −14.6cm3 | −10.9cm3 | −16.0% |
| -Post | 40 | 44.2 | 18.6 | 42.1 | −49.3% | −141.6% | −61.3% |
| 8-Pre | 50 | 52.1 | 21.2 | 40.6 | 20.8cm3 | 11.8cm3 | 10.5% |
| -Post | 50 | 31.3 | 9.4 | 30.1 | 39.9% | 55.7% | 25.9% |
| 9-Pre | 40 | 73.2 | 14.7 | 20.0 | 6.6cm3 | −47.3cm3 | −73.1% |
| -Post | 40 | 66.6 | 62.0 | 93.1 | 9.0% | −321.8% | −365.5% |
| 10-Pre | 40 | 419.4 | 407.0 | 97.0 | −157.8cm3 | −28.1cm3 | 21.6% |
| -Post | 45 | 577.2 | 435.1 | 75.4 | −37.6% | −6.9% | 22.3% |
| 11-Pre | 60 | 127.5 | 5.1 | 4.0 | −15.5cm3 | −5.3cm3 | −3.3% |
| -Post | 40 | 143.0 | 10.4 | 7.3 | −12.2% | −103.9% | −82.5% |
| 12-Pre | 40 | 16.5 | 1.7 | 10.2 | −145.3cm3 | −5.7cm3 | 5.6% |
| -Post | 60 | 161.8 | 7.4 | 4.6 | −880.6% | −335.3% | 54.9% |
| 13-Pre | 90 | 1278.4 | 370.0 | 28.9 | 523.9cm3 | 271.7cm3 | 15.9% |
| -Post | 120 | 754.5 | 98.3 | 13.0 | 41.0% | 73.4% | 55.0% |
| 14-Pre | 40 | 124.5 | 118.3 | 95.0 | 43.3cm3 | 101.2cm3 | 74.0% |
| -Post | 90 | 81.2 | 17.1 | 21.0 | 34.8% | 85.5% | 77.9% |
| 15-Pre | 40 | 33.7 | 19.2 | 56.9 | −11.5cm3 | −6.7cm3 | −0.3% |
| -Post | 80 | 45.2 | 25.9 | 57.2 | −34.1% | −34.9% | −0.5% |
| 16-Pre | 90 | 177.9 | 170.9 | 96.1 | 28.6cm3 | 88.0cm3 | 40.6% |
| -Post | 50 | 149.3 | 82.9 | 55.5 | 16.1% | 51.5% | 42.2% |
| 17-Pre | 90 | 892.8 | 429.8 | 48.1 | 234.6cm3 | 93.4cm3 | −3.0% |
| -Post | 70 | 658.2 | 336.4 | 51.1 | 26.3% | 21.7% | −6.2% |
Quantitative EASL (qEASL)
Using the same four representative patient cases as above, heterogeneity within tumors can be seen in quantitative color maps (Figure 3). The red areas show increased enhancement, while the blue areas demonstrate areas of decreased enhancement. The majority of the tumor volume for all pre-treatment MRI cases enhanced more than healthy liver tissue. This volumetric enhancement was expressed as a percentage of total tumor volume. For all patients, the pre-treatment cases showed on average 52.4±33.6% (range 4.0 – 97.0%) of the tumor enhancing more than the healthy background tissue. The post-treatment cases showed on average 36.8±27.8% (range 2.8 – 93.1%). qEASL values for specific patient cases are shown in Table 2. Change in qEASL after DEB-TACE that was found to be a decreasing % tumor enhancement (positive change in qEASL values) was indicative of embolization early technical success. The computation time for each patient case to process qEASL was < 1 minute.
DISCUSSION
The major finding of this feasibility study is that calculating tumor volume and enhancement pattern measurements in a time efficient manner (under 4 min) on a voxel by voxel basis are possible, giving a true 3D volumetric assessment. vRECIST was based on tumor volume size difference between pre- and post-treatment. qEASL was obtained by the enhancement value comparison of segmented tumor volume to the normal parenchymal liver enhancement. Comparison to previous MRI examinations is also possible.
An endpoint for assessing cancer treatments is often overall survival. Nonetheless, tumor responses as measured by RECIST (though one would not expect to see pure volume changes immediately after TACE), EASL, and time to progression (TTP) have been considered a surrogate marker of treatment efficacy. RECIST (1, 4), mRECIST (6), and EASL (5) have been especially designed for reporting study results in an effort to standardize the results of treatment and to allow comparison between different types of treatment. These guidelines are able to convert radiologic image observations into a quantitative and statistically trackable framework for measuring the response to therapy. But, in their current form, these methods analyze tumors in only the axial plane. Despite strict standardized rules, all these methods present numerous drawbacks. With post processing software now able to produce semi-automatic segmentation and measurement in a realistic time-frame, it is “time” to move from anatomic one-dimensional assessment of tumor burden to volumetric anatomical and quantitative assessment. Two papers in the recent literature illustrate the value of additional assessment of tumor response. In the first one, written by Bonekamp et al, changes in MR diffusion coefficient, enhancement, and volume were monitored after TACE (16). While the resulting color maps may seem similar between our study and their study, the imaging techniques, software, and goals are different. More specifically, we feel that our software is particularly useful for interventional oncologists when deciding whether future therapy is necessary. The second one by Galizia et al. used semi-automatic software to measure the volumetric amount of tumor necrosis after radioembolization (17). Though the treatment material, measurement objectives, and software were also different from our study, this study concluded that 3D tumor segmentation was more reproducible in measuring tumor necrosis proportions as compared to 2D measurements.
RECIST’s approach is based on assessing changes in tumor size as an indicator of treatment response. Targeted lesions are measured using a single linear summation, and specific attention is given to reproduce all measurements at the same tumor location during follow-up. Tumor enhancement or necrosis is not used to assess treatment efficacy. One of the crucial steps in RECIST is lesion measurement. While the numerical information tends to appear very precise and quantitative, one cannot determine exactly how they are obtained. In practice, RECIST is very subjective and numerous factors can play a significant role in lesion measurement; as such, it is subject to considerable inter- and intra-observer variability. Suzuki et al. (18) report up to 0.53 (95% CI 0.33 –0.72) inter-observer variability rate and intra-observer variation ranged between 0.76 –0.96 due to a some of the aforementioned reasons(19, 20).
Volumetric measurement is a logical solution because the change in tumor size is better assessed by a change in tumor volume measurement rather than a change in linear measurement (21, 22). Volumetric evaluation provides a more accurate depiction of tumor burden when compared with 1D and 2D measurements (23). Volumetric measurement is also able to depict tumor size changes earlier (24–26). This is a crucial point in patients’ follow-up. It has already been demonstrated that histopathologic tumor response correlates better with tumor volume than with axial measurements (27–29) and volumetric evaluation of treatment response is also associated with higher reproducibility (25, 30). Furthermore, tumor volume decrease after treatment has been found to be a predictor of survival (27, 31).
The EASL guidelines, first described in 2000 by the European Association for the Study of the Liver, proposed a more physiological approach to assessing hypervascular tumor response (5). Tumor necrosis is observed shortly after targeted therapies or TACE but before there is a decrease in lesion size (3, 32, 33). In taking into account tumor necrosis induced by treatment (5), estimation of tumor area viability must use contrast-enhanced radiologic imaging. This technique offers a better understanding of response to treatment, especially for hypervascular hepatic lesions, because the degree of enhancement beyond the background liver is related to the viability of the tumor (34). Treatment response is categorized on the basis of the percentage change in the necrotic area from the baseline study to follow-up study, and grouped into brackets from 0 to 100%. The measurement of lesions according to the EASL guidelines are more time consuming than that of RECIST because four perpendicular diameters need to be recorded to identify the viable or enhancing areas of a lesion. EASL also suffers from subjectivity because of heterogeneous enhancement in tumors after treatment and because measurements are performed on one axial slice. It has been shown that semi-automatic segmentation techniques and enhancement measurement allow for reliable and objective volumetric evaluation of liver lesions (35). Specifically for our work, the benefits of qEASL are: (1) A specific value of tumor enhancement is reported as a discrete number rather than in brackets, (2) quantification results represent the viable portion of the entire tumor volume rather than a single axial slice, and (3) tumor viability can be represented on a color map. qEASL eliminates the subjectivity of visual assessment and slice selection by assessing enhancement of the entire tumor volume quantitatively.
Because RECIST and EASL propose two parallel ways for one tumor evaluation, Lencioni et al. (6) proposed a combination especially for HCC evaluation called modified RECIST (mRECIST). The rationale to change assessment towards mRECIST were: (1) HCC is a hypervascular tumor, (2) all treatment used (including targeted therapies and TACE) act directly on tumor vascular supply, and (3) targeted therapies and TACE are able to induce necrosis first and then tumor shrinkage later. The mRECIST method is based on the measurement of a representative sample of viable tumor after treatment. This hypothesis implies that changes in tumor viability are homogenous throughout the entire tumor, which is likely true in those patients treated with systemic chemotherapy. Edeline J. et. al. has shown mRECIST is accurate in selecting good responders to sorafenib (8). However, when applying mRECIST criteria to patients treated with intra-arterial therapies, there are multiple limitations. Most importantly, changes in tumor viability are not homogeneous after intra-arterial therapy because tumors are fed by multiple arteries that are typically treated unequally. Moreover, using one single axial slice for assessment becomes inaccurate in those patients with inhomogeneous tumor enhancement, asymmetric regression, and multiple tumors (36, 37). In fact, Lencioni et. al.’s paper introducing mRECIST suggests 3D volumetric analysis as a priority in future research (6). In addition, performing the mRECIST measurement requires more time than EASL and RECIST. This is why Shim et. al. encouraged its application with only one dimensional measurement to simplify manual efforts (38). Figure 4 shows 2 selected cases (from the 17 cases in this study) in which mRECIST does not accurately represent how well the therapy worked. Our approaches (vRECIST and qEASL) eliminate these limitations by use of semi-automated whole tumor volume measurement in a realistic time frame.
There were some limitations to this study. It was a retrospective analysis on a select number of patients. However, we do not feel that this was a major limitation because the purpose of this paper was to describe the feasibility of using new treatment assessment techniques. An area of improving technology development is in MRI. Since the original scans in 2005–2008, the image quality and post-processing has improved and so we anticipate motion artifacts to be less of a concern. This study involved a well selected patient population that by chance did not include patients with infiltrative or multi-focal tumors and portal vein thrombosis. Therefore, application of vRECIST and qEASL to more challenging cases is warranted and will be assessed in future work. Though the segmentation software has already been shown to accurately segment in 3D, only one individual carried out the segmentation (13). While the semi-automatic nature of the software mitigates inter-user variability, a study is underway to further investigate these limits.
In conclusion, our study showed that a semiautomatic quantitative tumor enhancement (qEASL) and volume (vRECIST) assessment is feasible in a realistic time frame (all cases had tumors 3D segmented and qEASL or vRECIST processed under 4 minutes). This software can help the interventional radiologist plan future treatments by demonstrating the shape and location of residual tumor. Further studies are warranted to demonstrate the correlation between vRECIST, qEASL, and current metrics (RECIST, EASL, mRECIST) with overall survival.
Acknowledgments
Funding and Financial Support
This study was funded by NIH/NCI R01 CA160771, Philips Research North America, Briarcliff Manor, NY, USA and the French Society of Radiology (SFR).
Footnotes
SIR Annual Scientific Meeting
This work was presented at the 38th SIR Annual Scientific Meeting (San Francisco, March 24–29, 2012) – Interventional Oncology: Chemoembolization III Scientific Session 18, Abstract Presentations 241 and 242.
Publisher's Disclaimer: This is a PDF file of an unedited manuscript that has been accepted for publication. As a service to our customers we are providing this early version of the manuscript. The manuscript will undergo copyediting, typesetting, and review of the resulting proof before it is published in its final citable form. Please note that during the production process errors may be discovered which could affect the content, and all legal disclaimers that apply to the journal pertain.
References
- 1.Eisenhauer EA, Therasse P, Bogaerts J, et al. New response evaluation criteria in solid tumours: Revised RECIST guideline (version 1.1) European Journal of Cancer. 2009;45:228–247. doi: 10.1016/j.ejca.2008.10.026. [DOI] [PubMed] [Google Scholar]
- 2.Lee CH, Braga L, de Campos ROP, Semelka RC. Hepatic tumor response evaluation by MRI. NMR in Biomedicine. 2010;24:721–733. doi: 10.1002/nbm.1637. [DOI] [PubMed] [Google Scholar]
- 3.Kamel IR, Liapi E, Reyes DK, Zahurak M, Bluemke DA, Geschwind J-FoH. Unresectable Hepatocellular Carcinoma: Serial Early Vascular and Cellular Changes after Transarterial Chemoembolization as Detected with MR Imaging. Radiology. 2009;250:466–473. doi: 10.1148/radiol.2502072222. [DOI] [PMC free article] [PubMed] [Google Scholar]
- 4.Miller AB, Hoogstraten B, Staquet M, Winkler A. Reporting results of cancer treatment. Cancer. 1981;47:207–214. doi: 10.1002/1097-0142(19810101)47:1<207::aid-cncr2820470134>3.0.co;2-6. [DOI] [PubMed] [Google Scholar]
- 5.Bruix J, Sherman M, Llovet JM, et al. Clinical Management of Hepatocellular Carcinoma. Conclusions of the Barcelona-2000 EASL Conference. Journal of Hepatology. 2001;35:421–430. doi: 10.1016/s0168-8278(01)00130-1. [DOI] [PubMed] [Google Scholar]
- 6.Lencioni R, Llovet JM. Modified RECIST (mRECIST) Assessment for Hepatocellular Carcinoma. Semin Liver Dis. 2010;30:052, 060. doi: 10.1055/s-0030-1247132. [DOI] [PMC free article] [PubMed] [Google Scholar]
- 7.Lim HK, Han JK. Hepatocellular carcinoma: evaluation of therapeutic response to interventional procedures. Abdominal Imaging. 2002;27:168–179. doi: 10.1007/s00261-001-0093-9. [DOI] [PubMed] [Google Scholar]
- 8.Edeline J, Boucher E, Rolland Y, et al. Comparison of tumor response by Response Evaluation Criteria in Solid Tumors (RECIST) and modified RECIST in patients treated with sorafenib for hepatocellular carcinoma. Cancer. 2012;118:147–156. doi: 10.1002/cncr.26255. [DOI] [PubMed] [Google Scholar]
- 9.Brown DB, Gould JE, Gervais DA, et al. Transcatheter Therapy for Hepatic Malignancy: Standardization of Terminology and Reporting Criteria. Journal of vascular and interventional radiology : JVIR. 2009;20:S425–S434. doi: 10.1016/j.jvir.2009.04.021. [DOI] [PubMed] [Google Scholar]
- 10.Reyes DKBS, Vossen JAMDP, Kamel IRMDP, et al. Single-Center Phase II Trial of Transarterial Chemoembolization With Drug-Eluting Beads for Patients With Unresectable Hepatocellular Carcinoma: Initial Experience in the United States. Cancer Journal. 2009;15:526–532. doi: 10.1097/PPO.0b013e3181c5214b. [DOI] [PMC free article] [PubMed] [Google Scholar]
- 11.Gasnier A, Ardon R, Ciofolo-Veit C, Leen E, Correas JM. Assessing tumour vascularity with 3D contrast-enhanced ultrasound: A new semi-automated segmentation framework. Biomedical Imaging: From Nano to Macro; IEEE International Symposium on2010; 2010. pp. 300–303. [Google Scholar]
- 12.Mory B, Ardon R, Yezzi AJ, Thiran JP. Non-Euclidean Image-Adaptive Radial Basis Functions for 3D Interactive Segmentation; Twelfth IEEE International Conference on Computer Vision (ICCV); Kyoto, Japan. 2009. [Google Scholar]
- 13.Pellerin O, Lin M, Bhagat N, Ardon R, Mory B, Geschwind JF. Comparison of Semi-Automatic Volumetric Hepatic Tumor Segmentation from Cone Beam CT and Multi-detector CT with Histology in Rabbit Models. Academic Radiology. 2012 doi: 10.1016/j.acra.2012.07.011. Accepted. [DOI] [PMC free article] [PubMed] [Google Scholar]
- 14.Kim S, Mannelli L, Hajdu CH, et al. Hepatocellular carcinoma: Assessment of response to transarterial chemoembolization with image subtraction. Journal of Magnetic Resonance Imaging. 2010;31:348–355. doi: 10.1002/jmri.22038. [DOI] [PubMed] [Google Scholar]
- 15.Yu J-S, Rofsky NM. Dynamic Subtraction MR Imaging of the Liver: Advantages and Pitfalls. American Journal of Roentgenology. 2003;180:1351–1357. doi: 10.2214/ajr.180.5.1801351. [DOI] [PubMed] [Google Scholar]
- 16.Bonekamp S, Jolepalem P, Lazo M, Gulsun MA, Kiraly AP, Kamel IR. Hepatocellular Carcinoma: Response to TACE Assessed with Semiautomated Volumetric and Functional Analysis of Diffusion-weighted and Contrast-enhanced MR Imaging Data. Radiology. 2011;260:752–761. doi: 10.1148/radiol.11102330. [DOI] [PubMed] [Google Scholar]
- 17.Galizia MS, Töre HG, Chalian H, McCarthy R, Salem R, Yaghmai V. MDCT Necrosis Quantification in the Assessment of Hepatocellular Carcinoma Response to Yttrium 90 Radioembolization Therapy: Comparison of Two-dimensional and Volumetric Techniques. Academic Radiology. 2012;19:48–54. doi: 10.1016/j.acra.2011.09.005. [DOI] [PubMed] [Google Scholar]
- 18.Suzuki S, Yamaguchi I, Kidouchi T, Yamamoto A, Masumoto T, Ozaki Y. Evaluation of Effective Dose During Abdominal Three-Dimensional Imaging for Three Flat-Panel-Detector Angiography Systems. CardioVascular and Interventional Radiology. 2011;34:376–382. doi: 10.1007/s00270-010-9893-z. [DOI] [PubMed] [Google Scholar]
- 19.Belton AL, Saini S, Liebermann K, Boland GW, Halpern EF. Tumour Size Measurement in an Oncology Clinical Trial: Comparison Between Off-site and On-site Measurements. Clinical Radiology. 2003;58:311–314. doi: 10.1016/s0009-9260(02)00577-9. [DOI] [PubMed] [Google Scholar]
- 20.Obuchowski NA. How Many Observers Are Needed in Clinical Studies of Medical Imaging? American Journal of Roentgenology. 2004;182:867–869. doi: 10.2214/ajr.182.4.1820867. [DOI] [PubMed] [Google Scholar]
- 21.Bornemann L, Kuhnigk J-M, Dicken V, et al. New Tools for Computer Assistance in Thoracic CT Part 2. Therapy Monitoring of Pulmonary Metastases1. Radiographics. 2005;25:841–848. doi: 10.1148/rg.253045163. [DOI] [PubMed] [Google Scholar]
- 22.Cademartiri F, Luccichenti G, Maffei E, et al. Imaging for oncologic staging and follow-up: review of current methods and novel approaches. Acta Biomed. 2008;79:85–91. [PubMed] [Google Scholar]
- 23.Tran LN, Brown MS, Goldin JG, et al. Comparison of treatment response classifications between unidimensional, bidimensional, and volumetric measurements of metastatic lung lesions on chest computed tomography1. Academic radiology. 2004;11:1355–1360. doi: 10.1016/j.acra.2004.09.004. [DOI] [PubMed] [Google Scholar]
- 24.Curran SD, Muellner AU, Schwartz LH. Imaging response assessment in oncology. Cancer Imaging. 2006;6(SpecA):S126–130. doi: 10.1102/1470-7330.2006.9039. [DOI] [PMC free article] [PubMed] [Google Scholar]
- 25.Fabel M, Biederer J, Jochens A, et al. Semi-automated volumetric analysis of artificial lymph nodes in a phantom study. European Journal of Radiology. 2008;80:e451–e457. doi: 10.1016/j.ejrad.2010.10.019. [DOI] [PubMed] [Google Scholar]
- 26.Gwyther SJ, Schwartz LH. How to assess anti-tumour efficacy by imaging techniques. European Journal of Cancer. 2008;44:39–45. doi: 10.1016/j.ejca.2007.10.010. [DOI] [PubMed] [Google Scholar]
- 27.Baghi M, Bisdas S, Engels K, et al. Prognostic relevance of volumetric analysis in tumour specimens of hypopharyngeal cancer. Clinical Otolaryngology. 2007;32:372–377. doi: 10.1111/j.1749-4486.2007.01531.x. [DOI] [PubMed] [Google Scholar]
- 28.Beer AJ, Wieder HA, Lordick F, et al. Adenocarcinomas of Esophagogastric Junction: Multi-Detector Row CT to Evaluate Early Response to Neoadjuvant Chemotherapy. Radiology. 2006;239:472–480. doi: 10.1148/radiol.2391050043. [DOI] [PubMed] [Google Scholar]
- 29.Lee S, Kim S, Lee J, et al. Usefulness of CT volumetry for primary gastric lesions in predicting pathologic response to neoadjuvant chemotherapy in advanced gastric cancer. Abdominal Imaging. 2009;34:430–440. doi: 10.1007/s00261-008-9420-8. [DOI] [PubMed] [Google Scholar]
- 30.Zhao B, James LP, Moskowitz CS, et al. Evaluating Variability in Tumor Measurements from Same-day Repeat CT Scans of Patients with Non-Small Cell Lung Cancer. Radiology. 2009;252:263–272. doi: 10.1148/radiol.2522081593. [DOI] [PMC free article] [PubMed] [Google Scholar]
- 31.van den Broek GB, Rasch CRN, Pameijer FA, et al. Pretreatment probability model for predicting outcome after intraarterial chemoradiation for advanced head and neck carcinoma. Cancer. 2004;101:1809–1817. doi: 10.1002/cncr.20556. [DOI] [PubMed] [Google Scholar]
- 32.Miller FH, Keppke AL, Reddy D, et al. Response of Liver Metastases After Treatment with Yttrium-90 Microspheres: Role of Size, Necrosis, and PET. American Journal of Roentgenology. 2007;188:776–783. doi: 10.2214/AJR.06.0707. [DOI] [PubMed] [Google Scholar]
- 33.Spira D, Fenchel M, Lauer UM, et al. Comparison of Different Tumor Response Criteria in Patients with Hepatocellular Carcinoma After Systemic Therapy with the Multikinase Inhibitor Sorafenib. Academic radiology. 2011;18:89–96. doi: 10.1016/j.acra.2010.08.008. [DOI] [PubMed] [Google Scholar]
- 34.Bruix J, Sherman M. Management of hepatocellular carcinoma. Hepatology. 2005;42:1208–1236. doi: 10.1002/hep.20933. [DOI] [PubMed] [Google Scholar]
- 35.Keil S, Plumhans C, Behrendt FF, et al. Semi-Automated Quantification of Hepatic Lesions in a Phantom. Investigative Radiology. 2009;44:82–88. doi: 10.1097/RLI.0b013e3181911ffa. [DOI] [PubMed] [Google Scholar]
- 36.Forner A, Ayuso C, Varela M, et al. Evaluation of tumor response after locoregional therapies in hepatocellular carcinoma. Cancer. 2009;115:616–623. doi: 10.1002/cncr.24050. [DOI] [PubMed] [Google Scholar]
- 37.Monsky WL, Kim I, Loh S, et al. Semiautomated Segmentation for Volumetric Analysis of Intratumoral Ethiodol Uptake and Subsequent Tumor Necrosis After Chemoembolization. American Journal of Roentgenology. 2010;195:1220–1230. doi: 10.2214/AJR.09.3964. [DOI] [PubMed] [Google Scholar]
- 38.Shim JH, Lee HC, Kim S-O, et al. Which Response Criteria Best Help Predict Survival of Patients with Hepatocellular Carcinoma Following Chemoembolization? A Validation Study of Old and New Models. Radiology. 2012;262:708–718. doi: 10.1148/radiol.11110282. [DOI] [PubMed] [Google Scholar]