Abstract
Sulfite oxidizing enzymes (SOEs), including sulfite oxidase (SO) and bacterial sulfite dehydrogenase (SDH), catalyze the oxidation of sulfite (SO32−) to sulfate (SO42−). The active sites of SO and SDH are nearly identical, each having a 5-coordinate, pseudo-square-pyramidal Mo with an axial oxo ligand and three equatorial sulfur donor atoms. One sulfur is from a conserved Cys residue and two are from a pyranopterindithiolene (molybdopterin, MPT) cofactor. The identity of the remaining equatorial ligand, which is solvent-exposed, varies during the catalytic cycle. Numerous in vitro studies, particularly those involving electron paramagnetic resonance (EPR) spectroscopy of the Mo(V) states of SOEs, have shown that the identity and orientation of this exchangeable equatorial ligand depends on the buffer pH, the presence and concentration of certain anions in the buffer, as well as specific point mutations in the protein. Until very recently, however, EPR has not been a practical technique for directly probing specific structures in which the solvent-exposed, exchangeable ligand is an O, OH−, H2O, SO32−, or SO42− group, because the primary O and S isotopes (16O and 32S) are magnetically silent (I = 0). This review focuses on the recent advances in the use of isotopic labeling, variable-frequency high resolution pulsed EPR spectroscopy, synthetic model compounds, and DFT calculations to elucidate the roles of various anions, point mutations, and steric factors in the formation, stabilization, and transformation of SOE active site structures.
Keywords: Sulfite oxidase, Molybdenum enzymes, Electron paramagnetic resonance (EPR), Electron spin echo envelope modulation (ESEEM), Isotopic labeling, Density functional theory (DFT)
1. Introduction
Sulfite oxidizing enzymes, including sulfite oxidase (SO) and sulfite dehydrogenase (SDH), catalyze the physiologically essential two-electron oxidation of sulfite to sulfate (Eq. (1)) [1,2]. In plants and vertebrates, SO functions in the final metabolic degradation step of sulfur-containing compounds and serves to eliminate toxic sulfite from the organism [3]. The electrons from this process are ultimately passed on to either ferricytochrome c (cyt c) in vertebrates or to molecular oxygen in plants [4]. In contrast, certain bacteria use SDH to catalyze the oxidation of sulfite from thiosulfate, which they use as an energy source [5].
| (1) |
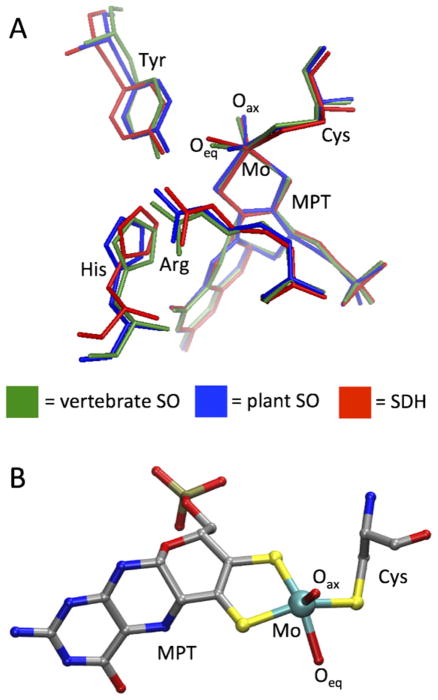
Although the tertiary structures of the SO [6,7] and SDH [8] proteins differ considerably from each other (Fig. 1), the active site structures of these enzymes, at least with respect to their catalytic Mo centers, are practically identical (Fig. 2a). In each case, Mo is coordinated by a total of five ligand donor atoms in the same pseudo-square pyramidal geometric arrangement: an axial oxo group (Oax), an equatorial sulfur from a conserved Cys residue, two sulfurs from a pyranopterindithiolene cofactor (molybdopterin, MPT), and an exchangeable equatorial ligand whose identity depends on the stage of the catalytic cycle, specific protein point mutations, and the buffer conditions in which the enzyme is prepared (Fig. 2b). In the fully oxidized Mo(VI) resting state of SOEs, this equatorial ligand is also an oxo group (Oeq) [9]. For the pathological R160Q mutant of human SO (hSO), it has been suggested that a nearby Gln residue (substituting the conserved non-coordinating Arg residue that is located immediately trans to Oax in the wt enzyme) also coordinates to form a 6-coordinate Mo center [10]. However, recent results obtained using pulsed electron paramagnetic resonance (EPR) techniques in conjunction with isotopic labeling and density functional theory (DFT) argue that the Mo center of this mutant remains five-coordinate in a pseudo-square-pyramidal geometry (vide infra) [11].
Fig. 1.

Representative wild-type protein structures of vertebrate SO, plant SO, and bacterial SDH. (A) Vertebrate SO (1.7 Å chicken liver SO; pdb ID = 1SOX) is a 110 kDa α2 -dimeric protein located in the mitochondrial intermembrane space. Each subunit consists of a b-type-heme domain and a Moco domain, which are connected to each other by a flexible tether that is disordered in the crystal structure. (B) Plant SO (2.6 Å A. thaliana SO; pdb ID = 1OGP) is a 90 kDa α2 -dimeric protein located in the peroxisome. In contrast to all other SOEs, plant SO contains no heme centers since molecular oxygen serves directly as the terminal electron acceptor in plants. (C) Bacterial SDH (1.8 Å S. novella SDH; pdb ID = 2BLF) is a 50 kDa αβ-dimeric protein located in the periplasm that consists of a Moco subunit and c-type-heme subunit. The metal cofactors and metal-coordinated amino acids in each structure are displayed as ball-and-stick figures for clarity.
Fig. 2.
The active site structure of SOEs. (A) Overlay view of the SO and SDH active sites, including selected nearby conserved residues. (B) Ball-and-stick representation of the fully oxidized Moco center, shown with the conserved Cys residue coordinated to Mo.
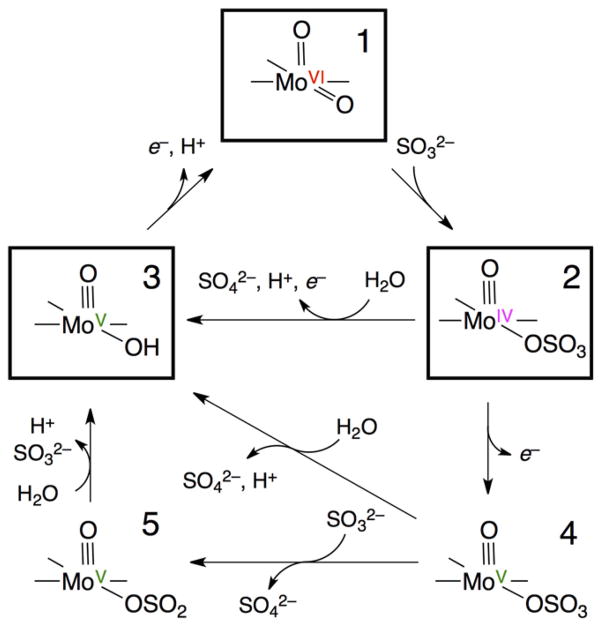
The boxes of Scheme 1 show a simplified catalytic cycle for the oxidation of sulfite by SOEs [1]. The initial reaction of sulfite with the dioxo-Mo center (1) reduces the fully oxidized Mo(VI) (d0) state to Mo(IV) (d2), forming the enzyme-product (EP) complex (2). Mo(IV) is reoxidized to the Mo(VI) resting state by two sequential one-electron oxidations, passing through the paramagnetic Mo(V) (d1) intermediate (3). In the vertebrate and bacterial enzymes these sequential one-electron oxidations involve intramolecular electron transfer (IET) to their integral heme centers [3].
Scheme 1.
The proposed catalytic cycle of SOEs. Boxes surround the principal chemical intermediates (1–3). The formation of the sulfite (5) and/or sulfate (4) Mo(V) species from the Mo(IV) enzyme-product complex (3) at low pH could be achieved as shown in the lower part of the scheme.
The exact order of IET and product release in going from 2 → 3 in Scheme 1 is still a matter of debate. A mechanism in which hydrolysis of the product, sulfate, occurs prior to any Mo(IV) oxidation step has been most frequently invoked [1]. However, pulsed EPR studies of the paramagnetic Mo(V) state of plant SO at low pH suggested that electron transfer from Mo(IV) could precede hydrolysis [12,13], as indicated by 2 → 4 in Scheme 1. The formation of this so-called “blocked” Mo(V) form (4) is also consistent with the fact that the enzyme turnover rates of SOEs are known to be much slower than their IET rates [3,14,15]. Because of the large excess of substrate (sulfite) present in the EPR studies, structure 5 with bound sulfite is another possible species that may be formed. Indeed, a sulfite-containing Mo(V) species was originally proposed in the early 1980s by Bray et al. [16]. Evidence for 4 and 5 is discussed in Section 3.
Historically, EPR has been an extremely important technique for probing the Mo(V) states of SOEs and for obtaining information about specific Mo(V) structures [16–19]. However, it can be difficult to distinguish among structures in which the solvent-exposed, exchangeable ligand is a O2−, OH−, H2O, SO32−, SO42−, or PO43− group since the primary O and S isotopes (16O and 32S) are magnetically silent (I = 0). Only those ligands that also contain magnetic nuclei (e.g., protons (1H, I = 1/2), deuterons (2H, I = 1), or phosphorus (31P, I = 1/2)) can provide the hyperfine interactions (hfi) or nuclear quadrupole interactions (nqi) needed for structure determination. Consequently, most of the early EPR spectroscopy of SOEs was centered on broad comparisons of the electronic g-values between different states of the enzymes prepared under a variety of conditions. Such studies provided the first valuable information about the specific structural or chemical differences at the Mo(V) centers that produced the various spectroscopic results (Fig. 3). For example, the CW EPR spectra of vertebrate SO prepared at relatively low pH values (pH ~ 6) show a strong hyperfine coupling with a single exchangeable proton, indicative of an OH ligand. In contrast, at relatively high pH values (pH ~ 9), the CW EPR spectra show no observable proton hfi, and somewhat different g-values are observed [17]. However, high-resolution pulsed EPR experiments at high pH indicate significant anisotropic hfi with the exchangeable proton from the OH ligand [20,21]. In the high-pH (hpH) form of the enzyme, it is now known that the OH ligand adopts orientations that allow only minimal overlap of the O H bond with the Mo(V) dxy orbital, which has the principal unpaired electron character. Thus, the isotropic hfi of the OH proton at high pH is extremely small, yet the anisotropic hfi is significant. For the “phosphate inhibited” (Pi) form, coupling to 31P (I = 1/2) was postulated from the third-derivative CW EPR spectra [22]. Subsequent pulsed EPR experiments provided definitive evidence for a coordinated phosphate in the place of the OH group [23,24]. More recently, the introduction of 33S and 17O labels (I = 3/2 and 5/2, respectively) has allowed additional exchangeable ligands of the Mo center to be directly probed [13,24,25]. More detailed structural determination from EPR measurements, however, relies on the comparison of the experimental spectroscopic parameters with those of analogous structurally defined model complexes and/or DFT computational models of the enzyme active sites.
Fig. 3.
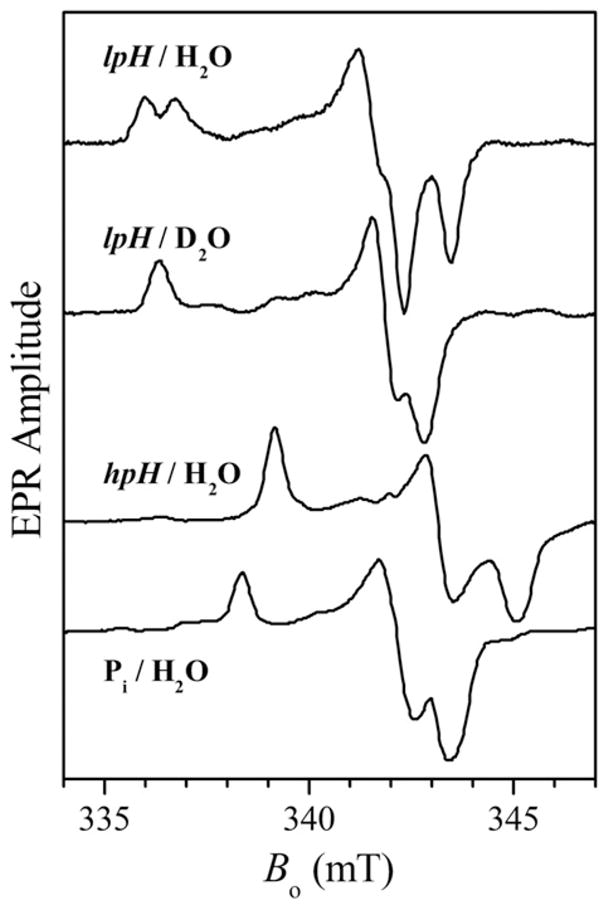
X-band CW EPR spectra of the lpH, hpH, and Pi forms of SO. Note that the lpH form shows resolved splittings from an exchangeable proton, which collapse in D2 O solution.
Based on the CW EPR results obtained for vertebrate SO in the 1980s, three general forms of the enzyme (SOEs) were identified: “high pH” (hpH); “low pH” (lpH); and “phosphate-inhibited” (Pi) [17]. Since then, complexes with other oxyanions, including arsenate [26] and sulfite [24], have also been prepared and identified. This review summarizes some recent advances in the use of isotopic labeling, variable-frequency high resolution pulsed EPR spectroscopy, synthetic model compounds, and DFT calculations to elucidate the roles of various anions, point mutations, and steric factors in the formation, stabilization, and transformation of SOE active site structures in each of these unique forms.
2. The high-pH form
Early CW EPR experiments on wt SOEs revealed that the spectra of the enzymes prepared in high pH buffers (pH ≥ 9) differ considerably from those obtained at neutral or slightly acidic pH values (Fig. 3). In addition to each of the principal g-values (gx, gy, and gz) of the spectra being smaller than the respective values at low pH, there are no resolved proton couplings at any of the hpH form EPR turning points. This observation was initially interpreted to simply reflect the deprotonation of the equatorial OH group at high pH. George, however, proposed that Mo OH could also be present at high pH, despite the lack of observable hfi [27]. Furthermore, some experimental support for the existence of the OH ligand in the hpH form had already been reported in a 17O (I = 5/2) study by Cramer et al., in which the 17O hfi was observed in the X-band CW EPR spectra for both the hpH and lpH forms and was assigned in both cases to a water-exchangeable oxygen-containing ligand, most likely OH, coordinated to Mo(V) [28]. Pulsed EPR experiments reveal two other unique 17O species, each of which has a much smaller hfi than the OH ligand [29]. These have been assigned to the axial oxo (Oax) and to an outer-sphere OH (or possibly sulfite/sulfate) that is hydrogen-bonded to the OH ligand. The very different exchange rates for the equatorial and axial oxo ligands provide a convenient method of “isolating” the contribution of the equatorial ligand when the enzymes are only briefly exposed to the 17O-enriched buffer before being reduced with sulfite [29].
As mentioned above, the observation of 17O hfi in the CW EPR spectra of hpH SO was the first indication of a possible OH ligand in the hpH form of SOEs. The assignment of the 17O signal to OH rather than to some other oxygen-containing ligand that could exchange with 17O-enriched buffer, however, could not be confirmed without detecting the OH proton directly. The detection of this proton was eventually accomplished through a series of pulsed EPR experiments [20,21].
Pulsed EPR spectroscopy has substantially higher resolution than CW EPR, and the Ka-band (~30 GHz) ESEEM experiments allowed the variation of the 17O hfi to be followed as a function of the EPR position, so that the isotropic and anisotropic parts of the hfi could be evaluated separately. The results of these 17O hfi measurements for several enzymes are presented in Fig. 4. We note that the hfi constants shown in Fig. 4 are significantly smaller (by 4νO ~ 25 MHz) than those presented in the original work [29]. The revised values are from later multifrequency ESEEM measurements (not shown) that, in contrast to the earlier work [29], attribute the distinct 17O-hydroxo feature of the ESEEM spectrum of hpH SO to the high-frequency (A/2 + νO) fundamental line rather than to the low-frequency (A/2 − νO) fundamental line.
Fig. 4.
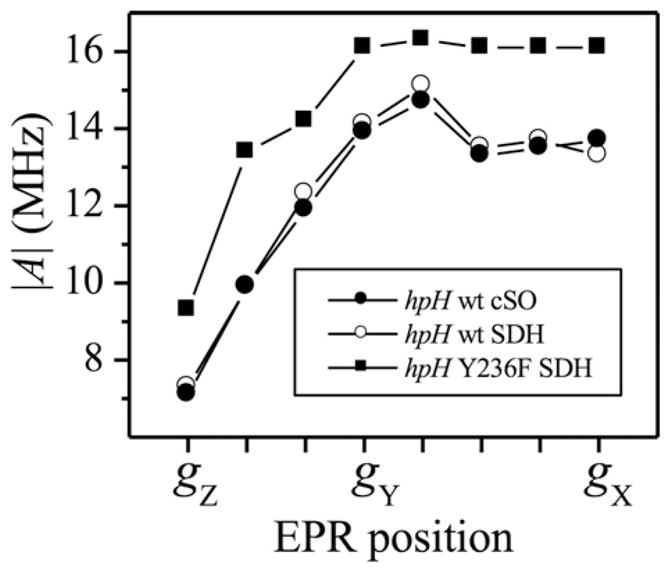
Total hyperfine constants (including the isotropic and anisotropic contributions) of the equatorial 17O ligand for several different hpH SOEs as a function of the EPR position, calculated from the position of the experimental fundamental line νβ as |A| = 2|(νβ − νO )|.
Fig. 5 compares the experimentally obtained hfi parameters of 1H and 17O (shown by horizontal shaded areas) with those calculated by DFT (shown by open circles) as a function of θOH (where θOH is a dihedral angle between the O Mo O(H) and Mo O H planes; θOH = 0° corresponds to the OH being coplanar with Mo O, θOH = 90° corresponds to OH being about parallel to Mo S(pterin), while θOH = 270° corresponds to OH being about parallel to Mo S(cysteine)). The vertical shaded areas show the ranges of θOH for hpH and lpH SO for which the experimental and calculated hfi constants are in agreement. Fig. 6 shows a schematic drawing of these orientations.
Fig. 5.
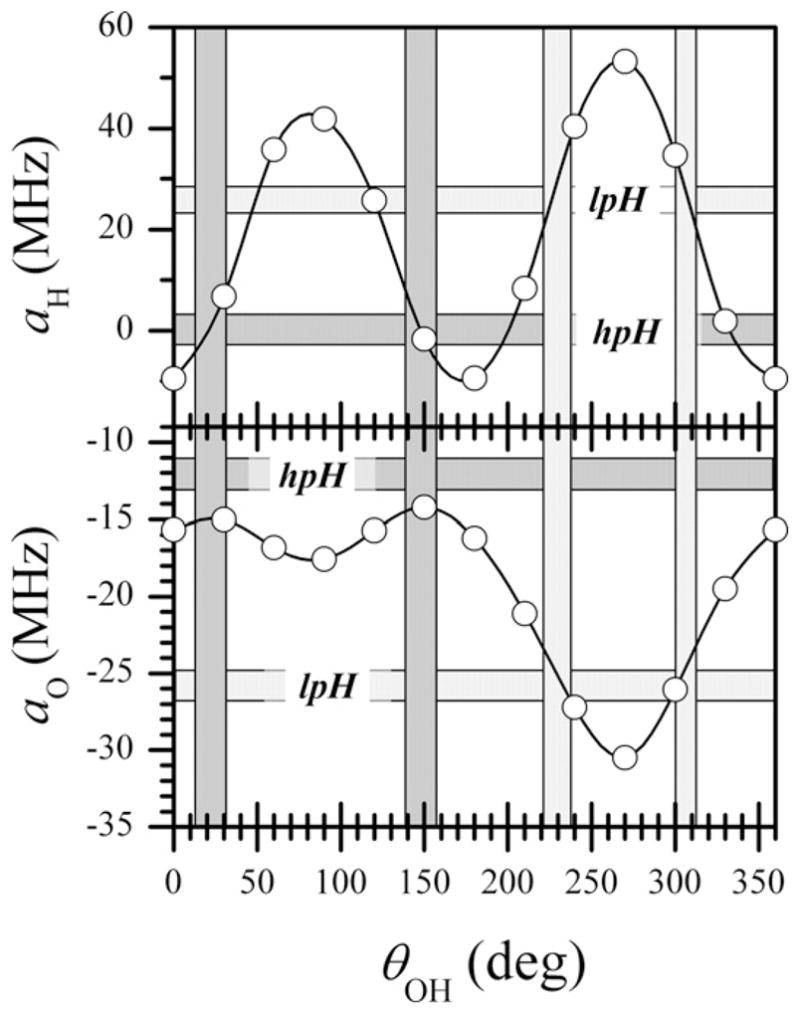
Open circles, 1H and 17O isotropic hfi constants calculated by DFT as a function of θOH, where θOH is a dihedral angle between the O Mo O(H) and Mo O H planes; θOH = 0° corresponds to Mo O H being exactly coplanar with O Mo O(H) and the OH proton being oriented toward Oax, θOH = ~90° corresponds to the OH proton being oriented away from S(cysteine), while θOH = ~270° corresponds to the OH proton being oriented toward S(cysteine). Horizontal dark shaded areas indicate the experimental hfi values for hpH SO; horizontal light shaded areas indicate the experimental hfi values for lpH SO. The vertical dark shaded areas show the ranges of θOH for which the experimental and calculated hfi constants are in agreement for hpH, and the vertical light shaded areas show the corresponding ranges of θOH for lpH SO.
Fig. 6.
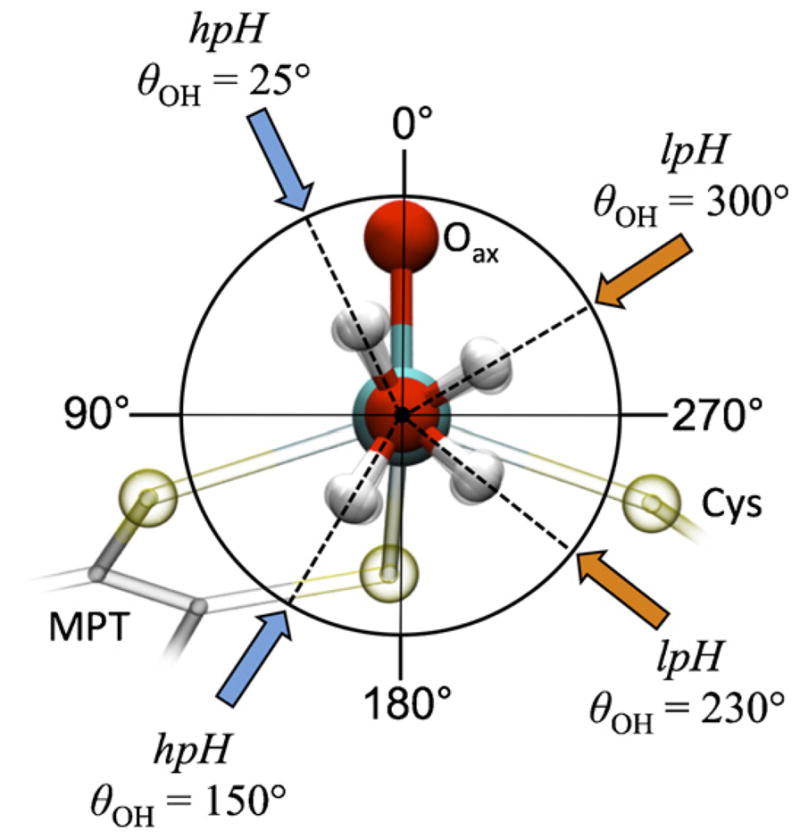
Projection along the equatorial Mo O(H) bond of SO, showing the possible orientations of the OH ligand in the hpH (blue arrows) and lpH (orange arrows) forms, as determined by the general agreement of the experimentally measured and DFT-calculated hfi values shown in Fig. 5. θOH is defined in Fig. 5 caption.
3. The low-pH form
Bray et al. observed that the CW EPR spectra of cSO are affected by the concentration of Cl− in the buffer, and they therefore proposed that chloride should be located near the Mo(V) center of the lpH form of cSO [18]. Extended X-ray absorption fine structure (EXAFS) experiments later provided some support for this idea, but the results were inconclusive since EXAFS is not capable of distinguishing between Cl and S nuclei [30]. Nonetheless, two possibilities could be envisioned for the interaction of the proposed Cl− with the active center of SOEs. One possibility is for the anion to directly coordinate the Mo at the open axial position of the Mo(V), trans to Oax. Alternatively, the anion could associate with the positively charged substrate binding pocket and interact with the metal center through a hydrogen bonding interaction with the equatorial OH. In CW EPR spectra of model oxo-Mo(V) compounds, a directly coordinated Cl− ligand that is cis to the terminal oxo group has isotropic and anisotropic hfi constants of ~10 MHz (for 35Cl, I = 3/2) [31]. This result suggested that for lpH SO, coordination of Cl− might also be directly detected by Cl hfi in the EPR spectra.
Using CW EPR, Doonan et al. revisited the question of Cl− coordination with lpH SO using buffers prepared with isotopically pure 35Cl− and 37Cl− (both I = 3/2) [32]. They reported extremely subtle differences between the CW EPR spectra of the pure isotopic preparations, suggesting at least some influence of the Cl− on the lpH form EPR spectra. From simulations of the spectrum of each isotopic preparation and the differences between the spectra, they estimated the Cl− hfi to be ~3.5 MHz. The CW EPR spectra of the lpH SO samples obtained in the presence of Br− and I− showed resolved Br and I hyperfine splittings that were ~4.5 times greater than those from Cl−. Based largely on the magnitude of the halide hfi values, the authors proposed that the lpH form of SO had direct coordination of Cl− to the Mo(V) in an axial position trans to the terminal oxo group. In our pulsed EPR experiments, the ESEEM of unknown origin observed for lpH cSO was also tentatively attributed to the hfi of a chlorine nucleus [31]. It was suggested [31] that the putative chloride should be coordinated to the Mo(V) (in the axial position trans to the oxo ligand) because it was assumed that the through-bond interaction with a more distant second-sphere Cl would result in extremely small hfi values.
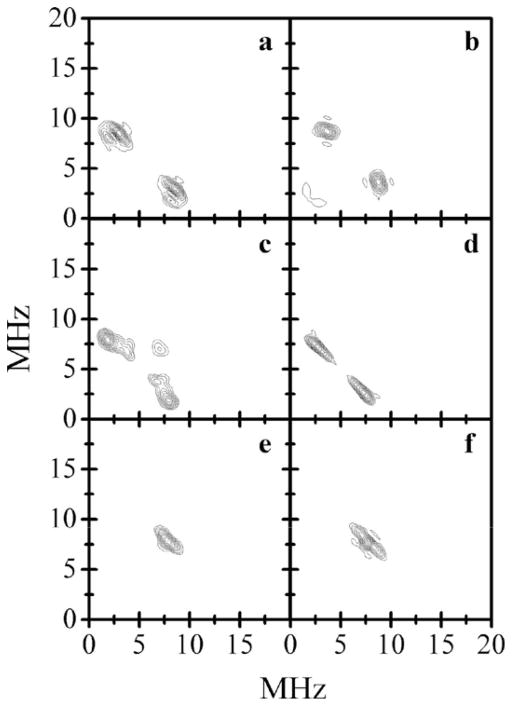
Additional pulsed EPR experiments performed by us very clearly demonstrated that the ESEEM spectra of lpH SO depend on the specific chloride isotope composition of the buffer [11]. The HYSCORE spectra of lpH samples prepared in Cl−, 35Cl−, and 37Cl− buffers (Cl-SO, 35Cl-SO, and 37Cl-SO, respectively) depend on the specific Cl isotope used in the preparation, as shown in Fig. 7. As expected, the spectrum of the sample containing the natural abundance of the chloride isotopes (Cl-SO) exhibits all of the cross-peaks that are observed in the combined spectra of the samples prepared separately with 35Cl and 37Cl. Detailed ESEEM experiments on 35Cl-SO allowed accurate estimates of both the hfi and nqi of the chloride to be made. From simulations of the spectra, the anisotropic hfi constant of 35Cl was estimated as |T⊥| = 0.2 ± 0.05 MHz, with aiso in the range of 4–5 MHz, and the nqi constant was estimated to be ~3 MHz. The determination of the nqi constant is important because this constant is sensitive to the electric field gradient created by the local electronic environment (bonds and charges) on the nucleus of interest, and it is often very useful for distinguishing between different structural possibilities (such as metal- vs. protein-coordinated Cl− in this case). Qualitatively, the small 35Cl nqi constant in the lpH SO spectra suggests a very symmetric electronic environment of the Cl− ion, which contradicts the model of Cl− coordinated to the highly positively charged Mo(V) ion.
Fig. 7.
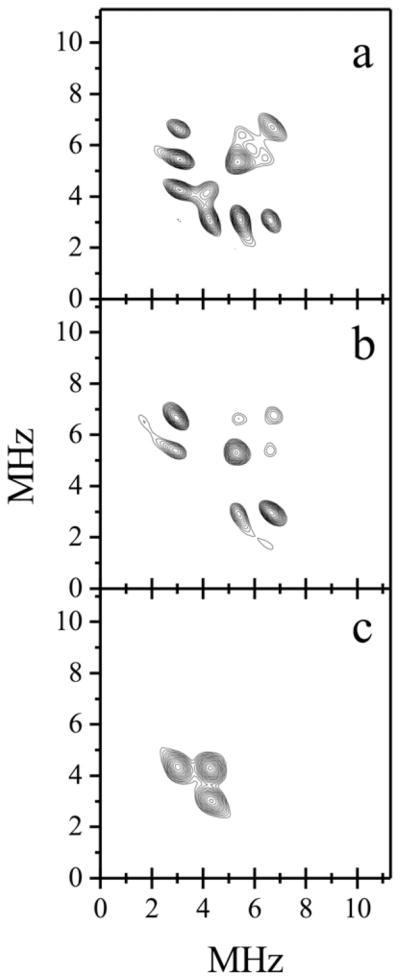
Panels a, b, and c, (++) quadrants of HYSCORE spectra of lpH Cl-SO, 35Cl-SO and 37Cl-SO, respectively. Experimental conditions: νmw = 29.562 GHz; Bo = 1075.6 mT (gy ); time interval between the first and second mw pulses, τ = 200 ns; mw pulses, 15, 15, 27, 15 ns; temperature, 21 K.
Source: Reprinted with permission from Ref. [11]. Copyright 2009 American Chemical Society.
In the absence of appropriate synthetic complexes of Mo(V) that could provide the magnetic resonance parameters for axially and equatorially coordinated Cl− and thereby allow direct comparisons to be made with the enzyme, the detailed interpretation of the available spectroscopic parameters (g-values and 35Cl, 17O, and 1H hfi and/or nqi parameters) in terms of structure was done using DFT calculations for a series of models accounting for both the inner- and outer-sphere coordination possibilities. The results of these calculations did not favor the possibility of axial coordination, in contrast to the conclusions of Doonan et al. [32]. Instead, the best overall agreement between the calculated and experimental parameters was achieved for a model that was derived directly from the X-ray crystal structure of recombinant cSO (PDB 2A99) [33], having a single Cl− that is hydrogen-bonded to the OH ligand in the equatorial plane of the 5-coordinate Mo(V) center (Fig. 8). In this case, the calculated nqi constant for the 35Cl atom corresponded to the experimental value, but the calculated hfi values were consistently underestimated compared to the experimental results. The underestimation of the hfi was attributed to some structural differences between the computational models and the actual Mo active site under the conditions of the EPR studies (low pH, 20 K). Steric considerations further disfavored the possibility of axial coordination, since coordination of any ligand in the position trans to Oax would require displacement of the conserved Arg residue occupying that area (R160 in hSO). Independent support for the assignment of the Cl− in the substrate binding pocket of the lpH form of SO, and not in the axial position, was later provided by EXAFS studies of the enzymes prepared in buffers containing I−, which in contrast to Cl− can easily be distinguished from sulfur. These EXAFS experiments showed a weak backscattering peak ~5 Å from the Mo, which was assigned to I− [34]. This distance is equivalent to the Mo···Cl distance found in the recombinant cSO structure (pdb 2A99) [33]. Molecular dynamics simulations of the iodide and protein movements also supported the assignment of the anion to the binding pocket in the equatorial plane, as found previously from the HYSCORE data and the DFT modeling for lpH SO containing Cl− [11].
Fig. 8.
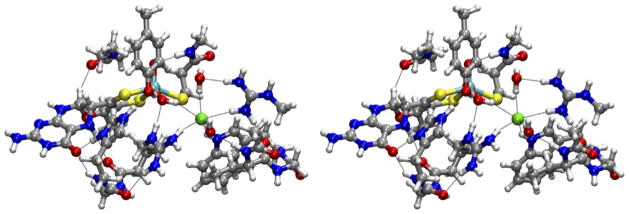
Stereo view (cross-eye) of the geometry-optimized computational model that was obtained from geometry optimization of the X-ray crystal coordinates from recombinant cSO with Cl− near the Mo center (PDB 2A99).
Source: Reprinted with permission from Ref. [11]. Copyright 2009 American Chemical Society.
For the equatorial OH ligand, the hfi of the 17O and 1H (2H) nuclei were readily determined by pulsed EPR experiments [20,35]. Fig. 5 presents the experimental isotropic hfi constants for these nuclei together with the values estimated from DFT calculations. As is evident from Fig. 5, these hfi parameters restrict the OH orientations to narrow ranges around θ ~ 230° and θ ~ 300°, and therefore severely constrain the possible geometry of the OH ligand. The schematic presentation in Fig. 6 clearly demonstrates the difference between the possible orientations of the equatorial OH ligand for the lpH and hpH forms of SO.
4. Oxyanion forms
4.1. The phosphate inhibited (Pi) form
The active sites of SOEs have a high binding affinity for oxyanions, and it was observed early on by CW EPR that the presence of phosphate in the buffer at low pH leads to the formation of the Pi form of SO with unique g-values [17]. In contrast to the usual lpH form, which has a very strong proton hfi as described above, no proton hfi is detected in the Pi form. These data were interpreted as indicative of the substitution of the equatorial OH ligand by phosphate. As noted above, however, no hfi with 31P (100% I = ½), which would confirm such a structure, was seen in the CW EPR, although the third-derivative spectrum provided some evidence for coupling to 31P [22].
In order to begin characterizing the structure of the Mo(V) center of the Pi form and to directly confirm the presence of phosphate as a ligand to Mo(V), Bray compared the EPR spectra of samples of cSO in 17O-labeled phosphate buffer with those in buffer containing regular phosphate [19]. An analysis of the differences between the spectra allowed phosphate coordination to Mo(V) to be inferred, but provided little additional information about the specifics of the phosphate interaction. The ESEEM experiments, on the other hand, provided the necessary resolution to detect the 31P hfi directly. Initially, due to the wide distribution of the hfi constant, it was only possible to evaluate that the 31P aiso could range from ~0 to ~20 MHz, which would be appropriate for the 31P of phosphate located in the proposed equatorial position [23]. Later, using 2D ESEEM techniques (Fig. 9), we were able to observe the 31P fundamental lines directly and confirm the initial estimate of the hfi. The direct detection of the 31P unequivocally confirmed the proposed PO43− coordination to the Mo center in the Pi form of SO [24].
Fig. 9.
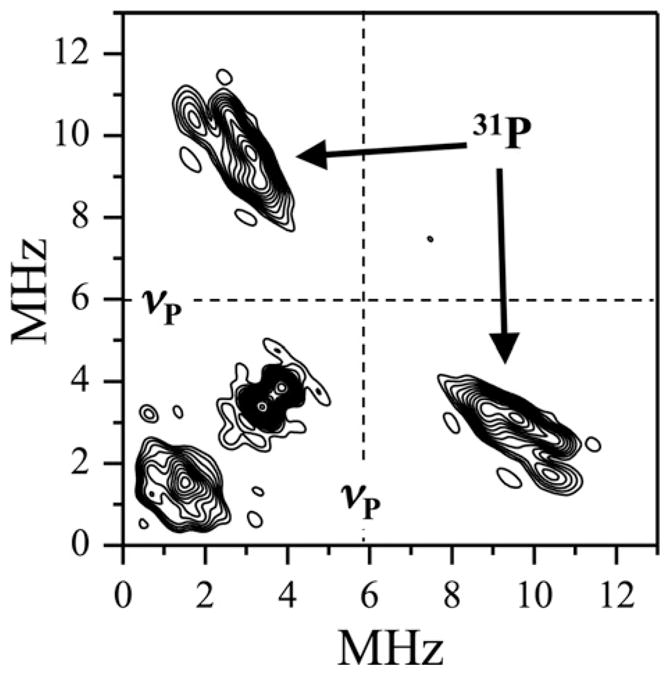
HYSCORE spectrum of the hSO Pi form collected at the gy position. Experimental conditions: mw frequency = 9.51 MHz; Bo = 344.8 mT; time interval between the 1st and 2nd pulses = 180 ns; mw pulses, 11, 11, 13, 11 ns; temperature, 21 K. The 31P Zeeman frequency, νp, is indicated by dashed lines. The 31 P cross peaks are marked by arrows, and the magnitude of hfi, evaluated from their position, spreads between 4 and 11 MHz.
4.2. The “blocked” form
Unlike vertebrate SO, plant SO contains no integral heme centers, and the type of EPR signal it produces depends on the method of reduction of the enzyme. Reduction of the fully oxidized plant enzyme using sulfite at low pH (followed by one-electron oxidation by ferricyanide to obtain the Mo(V) state), for example, produces an EPR signal that is different from the one obtained by one-electron reduction from Mo(VI) using titanium(III) citrate [12]. In the latter case, the regular lpH form is obtained that exhibits a strong proton coupling, indicative of an OH ligand. In the case of sulfite reduction, however, no proton splittings are observed, although the principal g-values are similar to those of the lpH form.
One explanation for the absence of a proton-containing ligand is that sulfate (product) is coordinated to the Mo(V) center in the place of OH, producing a “blocked” enzyme-product complex (4 in Scheme 1) [12]. Alternatively, the signal could also arise from the complex with equatorially coordinated sulfite (5 in Scheme 1), because the substrate (sulfite) is typically present in ~20-fold excess during the reduction. The formation of a sulfite form was previously proposed from the different EPR spectrum observed for cSO reduced by sulfite in Mes (4-morpholine-ethanesulphonic acid) buffer at pH 6.5–6.6 [16]. In contrast to the Pi form, however, the direct detection of a sulfite or sulfate ligand either by CW EPR or by pulsed methods is far more difficult. Sulfite exchanges its oxygen atoms with water very rapidly [36], therefore 17O labeling experiments would not be informative. Moreover, 32S (95%, I = 0) is magnetically silent. Direct spectroscopic evidence for a sulfur-containing ligand was initially obtained from pulsed EPR spectra of plant SO that had been reduced with 33S-labeled sulfite [13]. Subsequently it was shown (vide infra) that the pulsed EPR spectra of all forms of hSO [37], as well as SDH [38], exhibit coupling to 33S when reduced with labeled sulfite at low pH in the absence of chloride.
Conclusive assignment of the sulfur-containing ligand as either sulfite or sulfate required isotopic labeling with 33S (I = 3/2) and 17O (I = 5/2), variable frequency pulsed EPR spectroscopy, and a full comparative analysis of the 17O and 33S magnetic resonance parameters with those calculated for a series of DFT models for the sulfite and sulfate possibilities [24]. ESEEM studies of plant SO from Arabidopsis thaliana that had been reduced with sulfite labeled with 33S conclusively demonstrated the presence of a coordinated sulfur-containing ligand [13]. The 33S isotropic hfi constant determined in these experiments was small (aiso ~ 3 MHz), while the quadrupole coupling constant was large (e2Qq/h ~ 40 MHz). Reduction of the R160Q mutant of hSO with 33S-labeled sulfite also showed the presence of a sulfur-containing ligand, with aiso = 2.1 MHz and e2Qq/h = 36 MHz (Fig. 10) [25]. Subsequent investigations of wt hSO and several hSO mutants that had been reduced at low pH with 33S-labeled sulfite showed that a similar Mo(V) species with a sulfur-containing ligand was formed in all cases when the reduction was carried out in the strict absence of chloride [37]. Reduction of SDH under these conditions also resulted in a sulfur-containing ligand with similar values for aiso and the quadrupole coupling constant [38].
Fig. 10.
Panels a, c, and e, the (++) quadrants of the HYSCORE spectra of 33S-R160Q SO (Species 1) obtained at the gz, gy, and gx EPR turning points, respectively (Bo = 1060.8, 1078.8, and 1088.6 mT, respectively). The spectra shown represent sums of the spectra obtained at time intervals between the first and second mw pulses τ = 170 and 200 ns. Other experimental conditions: νmw = 29.650 GHz; mw pulses, 11, 11, 21, and 11 ns; temperature, 20 K. Panels b, d, and f, simulated HYSCORE spectra for gz, gy, and gx at the EPR turning points, respectively. Simulation parameters: aiso = 2.1 MHz, anisotropic hfi tensor in the principal axes system, (T11, T22, T33 ) = (−4.1, 2.5, 1.6) MHz; e2Qq/h = 36 MHz; η = 0.2; Euler angles for the orientation of the hfi tensor in the g-frame: ϕh = 20°, θh = 10°, Ψh = 20°; Euler angles for the orientation of the nqi tensor with respect to the g-frame: ϕq = 90°, θq = 90°, Ψq = 0°. The simulated spectra (as with the experimental ones) represent sums of the spectra calculated for τ = 170 and 200 ns.
Source: Reprinted with permission from Ref. [25]. Copyright 2008 American Chemical Society.
Initially, the 33S parameters were interpreted as arising from bound sulfate (product), 4 in Scheme 1. However, the observed quadrupole coupling constants (36–40 MHz) seemed unusually large for sulfur in a tetrahedral environment. Unfortunately, no model coordination compounds are available to provide benchmark hyperfine and quadrupole parameters for 33S in sulfate or sulfite ligands. Therefore, DFT calculations were used to determine the nature of the sulfur-containing ligand. Preliminary calculations on a truncated model suggested that sulfite better fits the pulsed EPR data than sulfate [39]. Sulfite ligation was verified by calculations on a much larger model (>250 atoms), shown in Table 1 and Fig. 11 [24].
Table 1.
Experimental magnetic resonance parameters for wt and mutant “blocked” forms of SO and DFT-calculated magnetic resonance parameters for sulfate- and sulfite-bound SO models.a
| Species |
hfi
|
nqi
|
Ref. | |||||
|---|---|---|---|---|---|---|---|---|
| aiso (MHz) | (T 11, T 22, T 33) (MHz) | e 2Qq/h (MHz) | h | |||||
| Blocked R160Q hSO |
|
33S | 2.1 | (1.6, 2.5, −4.1) | 36 | 0.2 | ||
| 17Ocoordinated | −9 | (5, 5, −10) | 7 | – | [24] | |||
| 17Oremote | −4.5 | (1.25, 1.25, −2.5) | 5 | – | ||||
| Blocked wt hSOb,c | 33S | 2.6 | (−0.3, −0.3, 0.6) | 36 | – | [37] | ||
| Blocked At-SO b | 33S | 3.3 | (1.3, 1.5, −2.8) | 40 | 0 | [13] | ||
| SO-sulfate (DFT) |
|
33S | 3.33 | (−0.53, −0.40, 0.92) | 4.4 | 0.7 | ||
| 17Ocoordinated | −9.56 | (6.06, 5.17, −11.22) | 10.9 | 0.3 | ||||
| 17Oremote |
|
−1.23 (a) | (1.18, 1.17, −2.35) | 10.6 | 0.1 | [24] | ||
| 0.02 (b) | (0.00, −0.36, 0.36) | 10.5 | 0.1 | |||||
| 0.01 (c) | (0.00, −0.27, 0.27) | 10.9 | 0.1 | |||||
| 17Ooxo | 3.26 | (−3.71, −2.34, 6.04) | 1.2 | 1.0 | ||||
| SO-sulfite (DFT) |
|
33S | 1.91 | (−0.69, −0.45, 1.14) | 27.9 | 0.2 | ||
| 17Ocoordinated | −11.09 | (9.34, 8.41, −17.75) | 9.6 | 0.4 | ||||
| 17Oremote |
|
−1.71 (a) | (1.66, 1.60, −3.26) | 9.5 | 0.3 | [24] | ||
| −0.10 (b) | (0.08, 0.45, −0.53) | 9.9 | 0.1 | |||||
| 17Ooxo | 3.61 | (−4.38, −0.24, 4.62) | 1.1 | 1.0 | ||||
Reprinted with permission from Ref. [24]. Copyright 2012 American Chemical Society.
The 17O magnetic resonance parameters for these species have not been fully evaluated.
The blocked form of this enzyme was obtained only under low-pH conditions in the strict absence of Cl−.
Fig. 11.
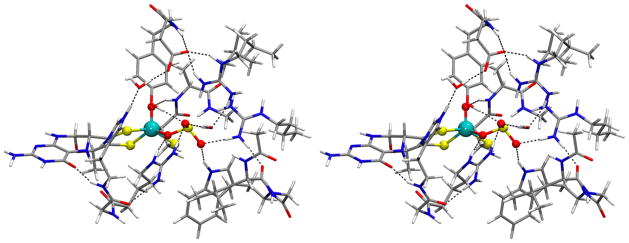
Stereo view (cross-eye) representation of the energy-minimized sulfite-bound SO model. The magnetic resonance parameters calculated for this model are provided in Table 1.
Source: Reprinted with permission from Ref. [24]. Copyright 2012 American Chemical Society.
The pulsed EPR spectra of the R160Q mutant of hSO in H217O have also been used to determine the structure of its Mo(V) center. Couplings to two types of 17O atoms were observed, and initially these were assigned to a coordinated 17O of the sulfur-containing ligand in the equatorial position and to the axial oxo ligand [25]. However, the quadrupole coupling constant for the presumed axial oxo group was substantially larger than the nqi constants in five-coordinate model oxo compounds [40] and in the hpH form of SO [41] (e2Qq/h ~ 5 MHz in R160Q SO vs. 1.5 MHz in hpH SO). This difference was tentatively explained as due to weak axial coordination of Gln 160 trans to the oxo ligand. This hypothesis was indirectly supported by an ESEEM study of a six-coordinate oxo-Mo(V) complex, for which a relatively large oxo-17O nqi constant (e2Qq/h ~ 3 MHz) was found [25]. Later studies have revealed, however, that the oxo ligand does not readily exchange at low pH, while sulfite rapidly exchanges its oxygen atoms in H2O [36]. Therefore, it was suggested that the two 17O signals arise from the coordinated and remote 17O atoms of the sulfur-containing ligand. This hypothesis was verified by showing that 17O peaks disappear upon addition of phosphate (Fig. 12), which displaces the sulfur-containing ligand (the oxygen atoms of phosphate do not exchange in H217O), and by the appearance of 31P features in the HYSCORE spectrum [24]. Interestingly, the 31P hfi constant in the Pi form of R160Q hSO (21–43 MHz [24]) is significantly larger than that of wt hSO (4–11 MHz, see Fig. 9). This is attributed to differences in the orientation of the phosphate ligand with respect to the Mo(V) dxy orbital in the two species, resulting in increased spin population on the phosphorus of the mutant enzyme compared to that of the wt enzyme. The experimental 17O parameters for R160Q hSO and the parameters calculated from DFT for sulfate and sulfite coordination are given in Table 1. The combined experimental and DFT results for R160Q hSO clearly demonstrate that reduction of SO with excess sulfite at low pH produces species 5 of Scheme 1, with bound sulfite as a ligand.
Fig. 12.
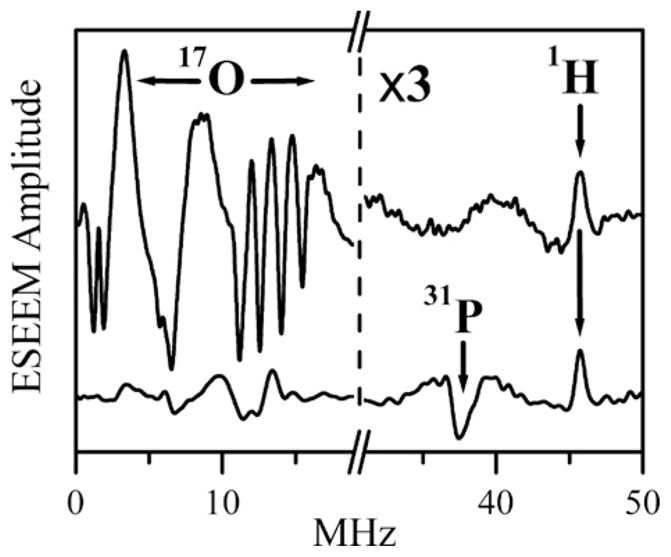
Ka -band two-pulse ESEEM spectra (cosine FT) of Species 1 (upper trace) and Species 1P (lower trace). Species 1P was prepared as described in reference 24 by adding a solution of phosphate (prepared with 17O-enriched water) to a solution of Species 1 (also in 17O-enriched water) at pH ~ 5.4 until the final concentration of phosphate in the solution was 700 mM. Experimental conditions: mw frequency = 30.068 GHz; Bo = 1074 mT; mw pulses, 2 × 12 ns; temperature, 21 K. For clarity, the modulation amplitudes to the right of the break in the x-axis have been magnified by a factor of 3. The proton matrix line is marked by the arrow labeled “1H” (at ~46 MHz, which corresponds to the 1H Larmor frequency, νH ). Likewise, the arrow labeled “31P” indicates the position of the sum combination line of 31P (νσ = ~37.5 MHz), which is close to double the Larmor frequency of 31 P at this magnetic field, 2νP ≈ 37.1 MHz.
Source: Reprinted with permission from Ref. [24]. Copyright 2012 American Chemical Society.
4.3. Other oxyanion forms
Addition of arsenate to sulfite-reduced hSO produced a complex CW EPR spectrum due to coupling with 75As (100% I = 3/2). The EPR evidence for coordinated arsenate was supported by the observation of a Mo···As peak of 3.20 Å in the Mo K-edge EXAFS [26]. This result is consistent with monodentate coordination of arsenate through an oxygen atom, as occurs for phosphate in the Pi form of SO, and suggests that this is also the mode of interaction of the product (sulfate) with the reduced Mo center (2 in Scheme 1).
5. Conclusions
The first CW EPR spectra for cSO were reported in 1971 [42], and the sensitivity of the spectra to pH and anions in the media led to early identification of the lpH, hpH, and Pi forms of vertebrate SOs [17]. The X-ray crystal structure of cSO [6] provided a framework for interpreting the EPR results as arising from a five-coordinate pseudo-square-pyramidal Mo with an axial oxo ligand, three equatorial sulfur donor atoms, and an exchangeable solvent-exposed equatorial ligand that varies during the catalytic cycle. However, determination of the structures of the various Mo(V) forms of SOEs has required combining variable-frequency pulsed EPR methods [43,44], isotopic labeling [13,25,41], synthesis of model compounds [25,40], and DFT calculations [11,24]. These combined integrated studies have revealed several specific features about SOEs:
The axial oxo ligand is exchangeable at high pH. The 17O hfi and nqi parameters of this ligand vary little among the various Mo(V) forms of SOEs.
The lpH form of vertebrate SOs has a chloride ion that is located in the 2nd coordination sphere, hydrogen-bonded to the equatorial OH ligand, and in a nearly spherical environment of water molecules and other hydrogen bond donors from side chains of the protein.
The hpH form of SOEs has a coordinated OH ligand that adopts an orientation with the OH bond nearly parallel with the Mo O bond; this leads to a very weak isotropic hfi of the OH proton, but the anisotropic hfi is relatively strong.
The Pi form has a monodentate phosphate ligand.
The “blocked” form is commonly formed for hSOs at low pH in the absence of chloride and contains a monodentate sulfite ligand.
Acknowledgments
We gratefully acknowledge support of this research by the National Institutes of Health (GM-037773 to JHE). We thank the NSF (DBI-0139459, DBI-9604939, BIR-9224431) and the NIH (S10RR020959, 1S10RR26416-01) for funds for the development of the pulsed EPR Facility at the University of Arizona. A portion of the research was performed using EMSL, a national scientific user facility sponsored by the Department of Energy’s Office of Biological and Environmental Research and located at Pacific Northwest National Laboratory.
Abbreviations
- SO
sulfite oxidase
- SDH
sulfite dehydrogenase
- SOE
sulfite oxidizing enzyme
- EPR
electron paramagnetic resonance
- ESEEM
electron spin echo envelope modulation
- IET
intramolecular electron transfer
- DFT
density functional theory
- hpH
high pH
- lpH
low pH
- Pi
phosphate inhibited
- hfi
hyperfine interaction
- nqi
nuclear quadrupole interaction
- HYSCORE
hyperfine sublevel correlation
- Moco
molybdenum cofactor
Footnotes
In celebration of the 65th birthday of Prof. Edward I. Solomon.
References
- 1.Hille R. Chem Rev. 1996;96:2757. doi: 10.1021/cr950061t. [DOI] [PubMed] [Google Scholar]
- 2.Kappler U. In: Microbial Sulfur Metabolism. Friedrich CG, Dahl C, editors. Springer; Berlin: 2008. pp. 151–169. [Google Scholar]
- 3.Feng C, Tollin G, Enemark JH. Biochim Biophys Acta. 2007;1774:527. doi: 10.1016/j.bbapap.2007.03.006. [DOI] [PMC free article] [PubMed] [Google Scholar]
- 4.Hänsch R, Lang C, Riebeseel E, Lindigkeit R, Gessler A, Rennenberg H, Mendel RR. J Biol Chem. 2006;281:6884. doi: 10.1074/jbc.M513054200. [DOI] [PubMed] [Google Scholar]
- 5.Kappler U, Friedrich CG, Truper HG, Dahl C. Arch Microbiol. 2001;175:102. doi: 10.1007/s002030000241. [DOI] [PubMed] [Google Scholar]
- 6.Kisker C, Schindelin H, Pacheco A, Wehbi WA, Garrett RM, Rajagopalan KV, Enemark JH, Rees DC. Cell. 1997;91:973. doi: 10.1016/s0092-8674(00)80488-2. [DOI] [PubMed] [Google Scholar]
- 7.Schrader N, Fischer K, Theis K, Mendel RR, Schwarz G, Kisker C. Structure. 2003;11:1251. doi: 10.1016/j.str.2003.09.001. [DOI] [PubMed] [Google Scholar]
- 8.Kappler U, Bailey S. J Biol Chem. 2005;280:24999. doi: 10.1074/jbc.M503237200. [DOI] [PubMed] [Google Scholar]
- 9.George GN, Pickering IJ, Kisker C. Inorg Chem. 1999;38:2539. [Google Scholar]
- 10.Doonan CJ, Wilson HL, Rajagopalan KV, Garrett RM, Bennett B, Prince RC, George GN. J Am Chem Soc. 2007;129:9421. doi: 10.1021/ja071402a. [DOI] [PubMed] [Google Scholar]
- 11.Klein EL, Astashkin AV, Ganyushin D, Riplinger C, Johnson-Winters K, Neese F, Enemark JH. Inorg Chem. 2009;48:4743. doi: 10.1021/ic801787s. [DOI] [PMC free article] [PubMed] [Google Scholar]
- 12.Astashkin AV, Hood BL, Feng CJ, Hille R, Mendel RR, Raitsimring AM, Enemark JH. Biochemistry. 2005;44:13274. doi: 10.1021/bi051220y. [DOI] [PubMed] [Google Scholar]
- 13.Astashkin AV, Johnson-Winters K, Klein EL, Byrne RS, Hille R, Raitsimring AM, Enemark JH. J Am Chem Soc. 2007;129:14800. doi: 10.1021/ja0704885. [DOI] [PMC free article] [PubMed] [Google Scholar]
- 14.Bailey S, Rapson T, Johnson-Winters K, Astashkin AV, Enemark JH, Kappler U. J Biol Chem. 2009;284:2053. doi: 10.1074/jbc.M807718200. [DOI] [PMC free article] [PubMed] [Google Scholar]
- 15.Emesh S, Rapson TD, Rajapakshe A, Kappler U, Bernhardt PV, Tollin G, Enemark JH. Biochemistry. 2009;48:2156. doi: 10.1021/bi801553q. [DOI] [PMC free article] [PubMed] [Google Scholar]
- 16.Bray RC, Lamy MT, Gutteridge S, Wilkinson T. Biochem J. 1982;201:241. doi: 10.1042/bj2010241. [DOI] [PMC free article] [PubMed] [Google Scholar]
- 17.Lamy MT, Gutteridge S, Bray RC. Biochem J. 1980;185:397. doi: 10.1042/bj1850397. [DOI] [PMC free article] [PubMed] [Google Scholar]
- 18.Bray RC, Gutteridge S, Lamy MT, Wilkinson T. Biochem J. 1983;211:227. doi: 10.1042/bj2110227. [DOI] [PMC free article] [PubMed] [Google Scholar]
- 19.Gutteridge S, Lamy MT, Bray RC. Biochem J. 1980;191:285. doi: 10.1042/bj1910285. [DOI] [PMC free article] [PubMed] [Google Scholar]
- 20.Raitsimring AM, Pacheco A, Enemark JH. J Am Chem Soc. 1998;120:11263. [Google Scholar]
- 21.Astashkin AV, Mader ML, Pacheco A, Enemark JH, Raitsimring AM. J Am Chem Soc. 2000;122:5294. [Google Scholar]
- 22.George GN, Prince RC, Kipke CA, Sunde RA, Enemark JH. Biochem J. 1988;256:307. doi: 10.1042/bj2560307. [DOI] [PMC free article] [PubMed] [Google Scholar]
- 23.Pacheco A, Basu P, Borbat P, Raitsimring AM, Enemark JH. Inorg Chem. 1996;35:7001. doi: 10.1021/ic9607806. [DOI] [PubMed] [Google Scholar]
- 24.Klein EL, Raitsimring AM, Astashkin AV, Rajapakshe A, Johnson-Winters K, Arnold AR, Potapov A, Goldfarb D, Enemark JH. Inorg Chem. 2012;51:1408. doi: 10.1021/ic201643t. [DOI] [PMC free article] [PubMed] [Google Scholar]
- 25.Astashkin AV, Johnson-Winters K, Klein EL, Feng CJ, Wilson HL, Rajagopalan KV, Raitsimring AK, Enemark JH. J Am Chem Soc. 2008;130:8471. doi: 10.1021/ja801406f. [DOI] [PMC free article] [PubMed] [Google Scholar]
- 26.George GN, Garrett RM, Graf T, Prince RC, Rajagopalan KV. J Am Chem Soc. 1998;120:4522. [Google Scholar]
- 27.George GN. J Magn Reson. 1985;64:384. [Google Scholar]
- 28.Cramer SP, Johnson JL, Rajagopalan KV, Sorrell TN. Biochem Biophys Res Commun. 1979;91:434. doi: 10.1016/0006-291x(79)91540-7. [DOI] [PubMed] [Google Scholar]
- 29.Astashkin AV, Klein EL, Ganyushin D, Johnson-Winters K, Neese F, Kappler U, Enemark JH. Phys Chem Chem Phys. 2009;11:6733. doi: 10.1039/b907029j. [DOI] [PMC free article] [PubMed] [Google Scholar]
- 30.George GN, Kipke CA, Prince RC, Sunde RA, Enemark JH, Cramer SP. Biochemistry. 1989;28:5075. doi: 10.1021/bi00438a026. [DOI] [PubMed] [Google Scholar]
- 31.Astashkin AV, Klein EL, Enemark JH. Inorg J Biochem. 2007;101:1623. doi: 10.1016/j.jinorgbio.2007.05.015. [DOI] [PubMed] [Google Scholar]
- 32.Doonan CJ, Wilson HL, Bennett B, Prince RC, Rajagopalan KV, George GN. Inorg Chem. 2008;47:2033. doi: 10.1021/ic7017083. [DOI] [PMC free article] [PubMed] [Google Scholar]
- 33.Karakas E, Wilson HL, Graf TN, Xiang S, Jaramillo-Busquets S, Rajagopalan KV, Kisker C. J Biol Chem. 2005;280:33506. doi: 10.1074/jbc.M505035200. [DOI] [PubMed] [Google Scholar]
- 34.Pushie MJ, Doonan CJ, Wison HL, Rajagopalan KV, George GN. Inorg Chem. 2011;50:9406. doi: 10.1021/ic201030u. [DOI] [PubMed] [Google Scholar]
- 35.Astashkin AV, Enemark JH, Raitsimring AM. Concepts Magn Reson B (Magn Reson Eng) 2006;29B:125. [Google Scholar]
- 36.Betts RH, Voss RH. Can J Chem. 1970;48:2035. [Google Scholar]
- 37.Rajapakshe A, Johnson-Winters K, Nordstrom AR, Meyers KT, Emesh S, Astashkin AV, Enemark JH. Biochemistry. 2010;49:5154. doi: 10.1021/bi902172n. [DOI] [PMC free article] [PubMed] [Google Scholar]
- 38.Rapson TD, Astashkin AV, Johnson-Winters K, Bernhardt PV, Kappler U, Raitsimring AM, Enemark JH. J Biol Inorg Chem. 2010;15:505. doi: 10.1007/s00775-009-0619-0. [DOI] [PMC free article] [PubMed] [Google Scholar]
- 39.Enemark JH, Raitsimring AM, Astashkin AV, Klein EL. Faraday Discuss. 2011;148:249. doi: 10.1039/c004404k. [DOI] [PMC free article] [PubMed] [Google Scholar]
- 40.Astashkin AV, Neese F, Raitsimring AM, Cooney JJA, Bultman E, Enemark JH. J Am Chem Soc. 2005;127:16713. doi: 10.1021/ja055472y. [DOI] [PubMed] [Google Scholar]
- 41.Astashkin AV, Feng C, Raitsimring AM, Enemark JH. J Am Chem Soc. 2005;127:502. doi: 10.1021/ja0461466. [DOI] [PubMed] [Google Scholar]
- 42.Cohen HJFI, Rajagopalan KV. J Biol Chem. 1971;246:374. [PubMed] [Google Scholar]
- 43.Enemark JH, Astashkin AV, Raitsimring AM. Dalton Trans. 2006:3501. doi: 10.1039/b602919a. [DOI] [PubMed] [Google Scholar]
- 44.Enemark JH, Astashkin AV, Raitsimring AM. High-resolution EPR spectroscopy of Mo enzymes. Sulfite oxidases: structural and functional implications. In: Hanson G, Berliner LJ, editors. Biological Magnetic Resonance. Vol. 29. Springer; New York: 2010. pp. 122–162. [DOI] [PMC free article] [PubMed] [Google Scholar]


