

Abstract
Oxidative stress is a common feature shared by many diseases, including neurodegenerative diseases. Factors that contribute to cellular oxidative stress include elevated levels of reactive oxygen species, diminished availability of detoxifying thiols, and the misregulation of metal ions (both redox-active iron and copper as well as non-redox active calcium and zinc). Deciphering how each of these components interacts to contribute to oxidative stress presents an interesting challenge. Fluorescent sensors can be powerful tools for detecting specific analytes within a complicated cellular environment. Reviewed here are several classes of small molecule fluorescent sensors designed to detect several molecular participants of oxidative stress. We focus our review on describing the design, function and application of probes to detect metal cations, reactive oxygen species, and intracellular thiol-containing compounds. In addition, we highlight the intricacies and complications that are often faced in sensor design and implementation.
Keywords: Oxidative stress, Fluorescent sensors, Metal ions, Thiol, Hydrogen peroxide, Reactive oxygen species
1. Components of oxidative stress and their implication in neurodegenerative disease
Neurodegenerative diseases have multifactorial causes and various pathological characteristics, but a common feature shared by many of these diseases is an elevation of oxidative stress [1-4]. Oxidative stress results from an imbalance in a cell’s production and detoxification of reactive oxygen species (ROS), a catch-all term that encompasses a diverse range of species, including superoxide radical (O2•−), hydrogen peroxide (H2O2), and hydroxyl radical (OH•), among others [2,5,6]. In addition to antioxidant enzymes like catalase, superoxide dismutase, and glutathione peroxidase, intracellular thiols like glutathione (GSH) help to maintain a healthy redox balance by scavenging superfluous oxidant species. Alterations in GSH concentration and antioxidant enzymes are markers for diseased systems where the cellular equilibrium favors an oxidative environment [7,8]. Under these conditions, levels of ROS are elevated and can produce irreparable cellular damage by degrading lipids, proteins, and nucleic acids [9,10].
The hydroxyl radical is the most reactive and damaging ROS, and its propagation is exacerbated by redox-active metal ions. Iron and copper notably undergo Fenton reactivity wherein reduced Cu+ or Fe2+ reacts with H2O2 to produce OH• and OH− and the corresponding oxidized metal center, either Cu2+ or Fe3+ [11]. Other variations of the classic Fenton reaction are also possible, although a key point is that redox cycling of the metal is requisite for catalytic production of damaging radicals and exacerbation of oxidative stress [11].
Metal ions that do not redox cycle, however, are also linked to oxidative stress. Zinc deficiency, for example, has been recognized for many years to cause an elevation in ROS [12]. Zinc is therefore sometimes referred to as an antioxidant, although its antioxidant properties cannot be the result of direct electron exchange between redox-inactive Zn2+ ions and oxidant species, but are rather mediated via indirect pathways. While zinc deficiency can be toxic, excessive cellular zinc, which may be released in response to oxidative stress, can also be toxic [13]. Similarly to Zn2+, Ca2+ does not directly interact with oxidants, yet fluxes in cellular Ca2+ concentrations appear to be regulated by oxidative stress via complex pathways in which Ca2+ networks and ROS networks may mutually influence each other [14,15]. Organisms therefore maintain highly coordinated and regulated pathways for acquiring, distributing, and recycling both redox-active and redox-inactive metal ions in order to maintain requisite metal levels for function without causing damage. Defects and breakdowns in metal homeostasis and trafficking are increasingly being linked to neurodegenerative diseases [16-26].
How all of these various components, ROS, thiols, and metal ions, interact and contribute to oxidative stress is a current area of intense research. Fluorescence imaging is one tool that enables interrogation of the connections and implications arising from the misregulation of each of these factors, provided that the limitations of the probes are taken into account [27,28]. This review article provides an overview of small molecule fluorescent sensors designed to detect factors associated with oxidative stress and neurodegenerative disease, in particular metal ions, ROS, and intracellular thiols, as well as advanced multifunctional sensors that respond to multiple stimuli.
2. Introduction of small molecule fluorescent sensors
Fluorescence detection is a highly sensitive analytical tool and an obvious choice for visualizing cellular function through the use of fluorescent small molecules engineered to respond specifically to a cellular event or analyte. Upon excitation, a fluorescent molecule or sensor emits a bright signal that is measured against a dark background. This response allows for easy visualization of the molecule within cell culture or tissue samples even at low concentrations. High sensitivity is a key requirement for studying cellular environments where the concentration of a particular analyte may be in the low nanomolar or picomolar range. In addition, most fluorescence imaging techniques display precise spatial and temporal resolution, as demonstrated by the fact that confocal and widefield microscopy can resolve cellular organelles as small as one micrometer and acquire images on the millisecond timescale [29].
Numerous small molecule fluorescent sensors have been designed for a variety of purposes, including labeling of cellular organelles and membranes, indication of pH, assessment of cell viability, and detection of metal cations and small molecules. In some examples, a fluorophore is modified with a recognition component that enables the dye to localize and therefore image a specific area of the cell [30]. In other designs, the sensor’s recognition site explicitly reacts with an intracellular small molecule, as with the pH and metal indicators, to elicit a change in its fluorescence emission [30]. It is the latter of these two examples that will be the focus of this review.
3. Requirements for an effective fluorescent sensor
In order to successfully utilize small molecules as fluorescent sensors for cellular processes, several criteria must be considered. In general, they should be water soluble, cell-permeable and non-toxic. In some cases, cell-permeability can be achieved by esterifying a functional group (e.g. carboxylate) to eliminate any charged species. The neutral molecule is more likely to pass through the cellular membrane where internal esterases transform the sensor to its charged form usually trapping it inside the cell. Ideally, the subcellular localization of the probe should be understood.
In addition, the sensor should be specific for the analyte of interest in order to limit off-target effects. In the case of metal ion sensors, selectivity implies that the sensor binds to one metal over a host of others commonly found in a cellular system. To ensure the binding is specific, the ligand denticity and geometry, the hardness or softness of the donor atoms, and the size of the metal ion must be considered. In addition, the chelating ligand should possess a dissociation constant (Kd) that is within the same order of magnitude as the concentration of the metal ion of interest within a particular cellular location. A chelator with a binding affinity that is too strong for a given area may disrupt the metal cation’s intracellular equilibrium by removing it from storage proteins or essential enzymes. Likewise, a chelator with a weak binding affinity might not chelate any of the available metal cation. In both scenarios, the sensor would provide a false report on the intracellular metal concentration.
In the case of ROS sensors, specificity implies that the probe gives a unique response to specific species of ROS. This is a difficult challenge that is not often met by most probes. Rather, it is important to know what species may react with the probe in different conditions, what the relative rates are of those reactions, whether the reactions are catalyzed, and how the products of those reactions might influence the fluorescent response [6,27,28].
Cells exhibit some natural fluorescence or autofluorescence from several highly conjugated intrinsic molecules, making it difficult to distinguish weak fluorescence intensities from the background. To overcome this obstacle, dyes should be used that contain high extinction coefficients and quantum yields and excitation and emission wavelengths in the visible range. By definition, compounds with large extinction coefficients strongly absorb light at a given wavelength. If the same molecule has a large quantum yield, it can efficiently convert these absorbed photons into emitted photons; therefore, the closer a molecule’s quantum yield is to unity, the brighter its emission [31]. Autofluorescence is more pronounced when UV-light is used for excitation because several cellular components absorb in this range [31]; therefore, fluorophores with visible-light excitation and emission wavelengths are preferred. Additionally, the photostability of the fluorophore to constant illumination must be considered to avoid photobleaching effects.
In general, sensors that exhibit an increased emission signal (“turn-on” effect) or a shift in their excitation or emission profile (ratiometric response) are better suited for use as intracellular probes than sensors that undergo emission quenching (“turn-off”). Not only is it harder to quantitatively measure a diminished fluorescence signal, but probes that exhibit a turn-on or ratiometric response to an analyte allow for high spatial resolution. Ratiometric sensors are particularly useful for calculating the concentration of an analyte by finding the ratio of the sensor’s fluorescent signal before and after reaction. Because the ratio of the intensities at two wavelengths is measured, any background interference is normalized and errors due to photobleaching or variation in probe concentration are minimized.
Most sensors described throughout the literature do not fulfill all of the criteria described above, which highlights the difficulty encountered with developing optimal probes and points to the ongoing need to prepare probes with improved properties.
4. Fluorescent sensors for metal cations
4.1. Fluorescent calcium sensors
The first fluorescent metal ion sensors were developed in the 1980s for the purpose of studying intracellular calcium [32]. The availability of these probes is credited as a major technological advance that enabled an explosion in understanding calcium signals [14]. Intracellular calcium concentrations are tightly regulated at low levels, but fluxes of Ca2+ ions through various channels, pumps and exchangers from the extracellular environment or from intracellular stores are responsible for controlling a host of physiological processes. Not only are disturbances in Ca2+ signaling linked to neurodegenerative diseases [26], but the channels, pumps and exchangers that control Ca2+ fluctuations are highly susceptible to oxidative stress [14].
Many of the basic principles for developing all kinds of metal sensors derive from the foundational calcium sensor molecules, which were designed by tagging a fluorophore onto the backbone of a metal chelator in order to elicit a metal-dependent fluorescence response. The chelating backbone of most calcium sensors resembles BAPTA (1,2-bis(o-aminophenoxy)ethane-N,N,N′,N′-tetraacetic acid), Fig. 1. The BAPTA-chelating moiety includes two aromatic groups, which lower the nitrogen pKas to 5–6 rendering the probe insensitive to physiological pH while maintaining the size and selectivity of the binding site [32]. Additionally, the calcium binding affinity of BAPTA can be tuned by incorporating electronwithdrawing or donating groups onto the aromatic rings. To date, calcium probes have affinities ranging from low μM to high pM, allowing for calcium detection in a variety of intracellular systems [33]. The aromatic rings provide an easy handle for the addition of various fluorescent molecules onto the BAPTA backbone, which leads to fluorescent sensors with excitation and emission wavelengths that span the UV and visible spectrum. Calcium sensors have become widely used for visualizing calcium signaling and studying its role in cellular processes. Notable here are examples where calcium indicators detect transient increases in intracellular Ca2+ in response to an oxidative stress insult, as has been observed in astrocytes exposed to the amyloid beta peptide [14,34].
Fig. 1.
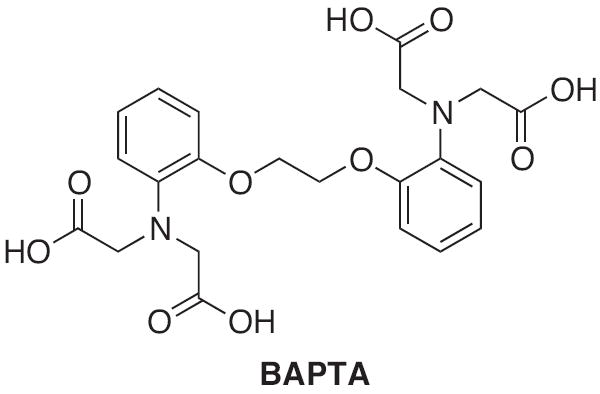
Structure of BAPTA.
4.1.1. Ca2+ sensors excited with UV light
Fura-2 and Indo-1 (Fig. 2) were originally developed by Tsien and coworkers and are now commercially available ratiometric calcium sensors that are excitable with UV light [35]. Both probes utilize the BAPTA chelator backbone but contain fluorescent moieties that respond differently to UV excitation. The binding of Ca2+ to Fura-2, which occurs with a 145 nM (Kd) affinity, induces a shift in the maximum absorbance wavelength from 360 nm to 330 nm while the emission wavelength remains constant at 510 nm but with a 30-fold increase in intensity [31,35]. By taking the ratio of Fura-2s emission intensities after excitation at the optimum wavelengths for the free and bound forms, the concentration of free Ca2+ in solution can be calculated [35,36].
Fig. 2.
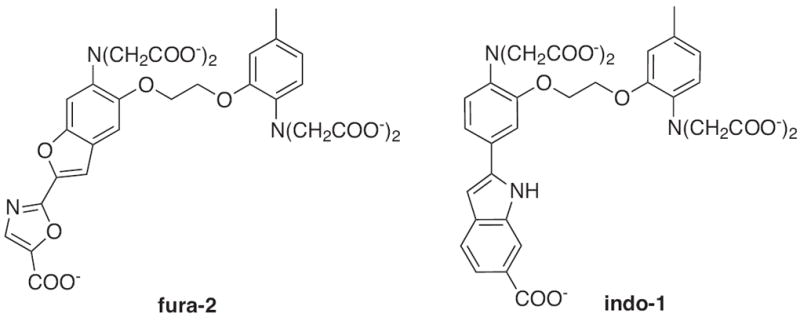
Structures of ratiometric calcium sensors: Fura-2 and Indo-1.
In contrast, Indo-1 binds calcium with a weaker affinity of 230 nM and shows a calcium-induced emission wavelength shift from 482 nm to 398 nm rather than a shift in the excitation wavelength. Like Fura-2, Indo-1 shows an equally impressive fluorescence calcium dependent turn-on response. Due to the shift in the emission maximum upon metal complexation, Indo-1 is more useful for flow cytometry experiments where a single laser is used for excitation and two emission wavelengths can be monitored [37]. Indo-1 is also useful for determining intracellular Ca2+ concentrations with laser scanning microscopy [38]. A disadvantage of Fura-2 and Indo-1 is their required UV light excitation, which causes damage to cell culture samples and cellular autofluorescence.
4.1.2. Ca2+ sensors excited with visible light
Fluo-3 and Calcium Green-1 (Fig. 3) are two examples of calcium sensors with excitation and emission wavelengths in the visible range that overcome the problems with UV excitations required by earlier designs [39,40]. Fluo-3 has a 325 nM affinity for Ca2+, and Calcium Green-1 has a slightly higher affinity of 190 nM [33]. Both sensors utilize fluorescein as the fluorescent tag with excitation and emission wavelengths near 505 nm and 530 nm, respectively, with 40-fold (Fluo-3) and 100-fold (Calcium Green-1) increases in emission intensity upon Ca2+ binding [31,39]. However, ratiometric measurements cannot be used with either probe because calcium binding does not shift their emission or excitation wavelengths. These sensors, unlike their UV lightexcitable counterparts, can be utilized in confocal laser-scanning microscopy, laser-based flow cytometry, two-photon excitation microscopy, and total internal reflection microscopy. In addition, recent advances have led to the in vivo use of calcium probes to further elucidate the function of calcium signaling. For example, two-photon laser scanning microscopy now allows for longer wavelength calcium probes, such as Calcium Green-1, to be imaged with high-resolution within living mammalian brains [41,42].
Fig. 3.
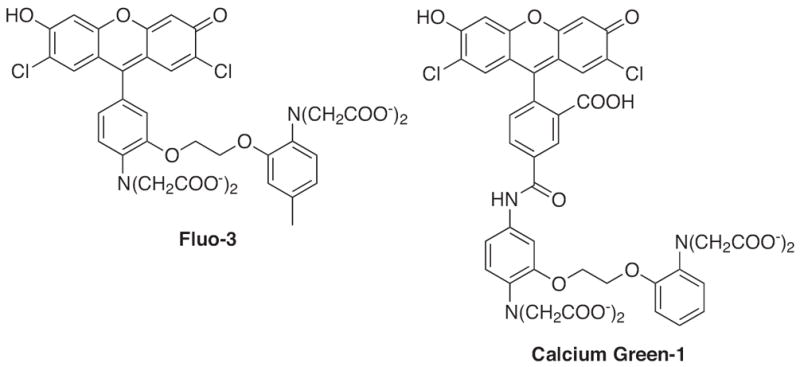
Structures of calcium sensors: Fluo-3 and Calcium Green-1.
4.1.3. Intricacies and complications: metal selectivity
While the carboxylate-rich BAPTA framework provides an excellent receptor for Ca2+, it does not provide an exclusive binding site, and other oxophilic ions can indeed coordinate to these molecules. Particularly problematic is Zn2+, which actually binds more avidly than Ca2+ to most calcium sensors and also induces a turn-on fluorescence response, making it difficult to discriminate these two metal ions by this method alone [43-45]. Dynamic fluxes of both Ca2+ and Zn2+ are implicated in neurological signaling and in neurodegenerative disease, so differentially visualizing both ions is becoming increasingly desirable [45]. The advent of zinc probes that are built on frameworks having little affinity for Ca2+ (see below) now provides options for cross-validating a particular response as calcium or zinc dependent. In any case, the cross-reactivity of Ca2+ and Zn2+ in the carboxylate-based probes provides a cautionary reminder about the limitations of a “metal-specific” probe and highlights the importance of having multiple agents with varying properties and metal preferences.
4.2. Fluorescent zinc sensors
As the second most abundant transition metal in the body, zinc plays an extraordinary role in many biological processes including brain function, gene transcription and immune function, as well as in diseases such as Alzheimer’s, epilepsy and ischemic stroke [46-50]. The link between low zinc levels and oxidative stress may be mediated via several factors, including decreased activity of important zinc-dependent enzymes like superoxide dismutase, low expression of metallothionein, and decreased competition with redox active metals like Cu and Fe, among other hypotheses [12]. However, many of the specifics about zinc function are not fully understood. Fluorescent zinc sensors offer a way to track and visualize zinc within living systems. Described below are a handful of sensors chosen as representation of a substantial number of zinc sensors that have been introduced over the last two decades. Numerous other examples have been extensively reviewed [51-55].
4.2.1. High affinity Zn2+ sensors
The Zinpyr and ZnAF families of compounds represent two prominent classes of high affinity sensors used in applications where only trace amounts of chelatable Zn2+ are expected. Both contain similar zinc-binding motifs and exhibit a zinc-specific fluorescence turn-on response via a fluorescein moiety. In addition, both utilize a photo-induced electron transfer (PET) mechanism to detect the zinc cations. In each case, the apo-sensor’s fluorescence is quenched by an electron-rich receptor that donates its electron density to the fluorophore. The PET-induced quenching is interrupted by metal-complexation and fluorescence is restored.
The basis for the Zinpyr family of sensors consists of a fluorescein core with two di-2-picolylamine (DPA) metal-chelating moieties attached to the top of its xanthene ring. Zinpyr-1 was the first member in the long list of compounds, several of which are shown in Fig. 4. The cell-permeable Zinpyr-1 gives a modest 2.2-fold fluorescence increase upon a tight 1:1 interaction with Zn2+, where the Kd was 0.7 nM [56]. To optimize the fluorescence signal, subsequent analogs Zinpyr-3 and Zinpyr-4 were prepared that lowered the pKa values of the tertiary amines in order to prohibit proton-interference of the PET and thereby decrease the background signal of the Zn-free probes [57,58]. These initial members of the Zinpyr family have been utilized in the investigation of Zn2+ release at hippocampal mossy fiber synapses [59] and in the intracellular labeling of Zn2+ within damaged neurons [60].
Fig. 4.
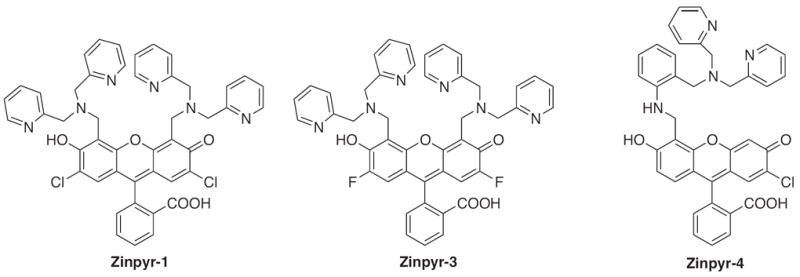
Structures of zinc sensors: Zinpyr family.
Members of the ZnAF family of Zn2+ sensors also contain a DPA chelating unit attached to a fluorescein molecule, with the main structural difference from Zinpyr being the placement of DPA to the bottom aryl ring of fluorescein (Fig. 5) [61]. Although their fluorescence enhancement exceeds those of the Zinpyr class, the final emission intensities of ZnAF-1 and ZnAF-2 are lower. Fluorinating the xanthene rings to give ZnAF-1F and ZnAF-2F results in probes with greater than 60-fold turn-on responses, making them easier to visualize in cellular systems [61]. All derivatives of the ZnAF family have low nanomolar affinities for zinc. Addition of acetyl esters to the fluorescein of each ZnAF species makes them membrane-permeable. In this form, they have been used to image labile Zn2+ pools and study the spatio-temporal dynamics of Zn2+ in acute rat hippocampal slices [61,62], as well as to study the pH dependence of Zn2+ influx in erythroleukemia cells [63].
Fig. 5.
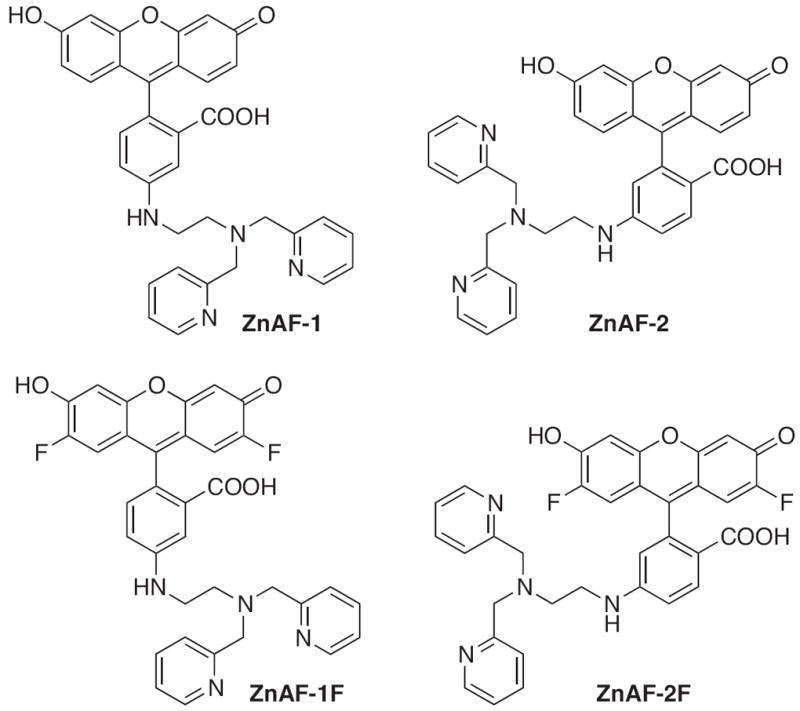
Structures of zinc sensors: ZnAF family.
4.2.2. Moderate affinity Zn2+ sensors
As a prominent biological metal cation, zinc is located in multiple areas of the body with varying concentrations ranging from low nanomolar to millimolar. Because of this wide range of concentrations, Zn2+ sensors need to have a similar range of binding affinities. Zn2+ sensors with moderate binding affinities are useful for the study of areas with dynamic changes in Zn2+ concentrations, such as in firing neurons, where a lower affinity probe would allow for easy reversibility of the Zn2+ complex formation. Two examples of such probes are FluoZin-1 and FluoZin-2 (Fig. 6), which have zinc binding affinities of 7.8 and 2.1 μM, respectively [64]. The structure of both probes employs a fluorescein derivative attached to a chelating component that is equivalent in structure to half of BAPTA. FluoZin-1 expresses a 200-fold increase in fluorescence emission when bound to zinc, but FluoZin-2 has a slightly weaker turn-on effect showing only a 12-fold change. Although they display ideal characteristics, the applications of these probes have been limited to the characterization of Zn2+-binding proteins [65,66].
Fig. 6.
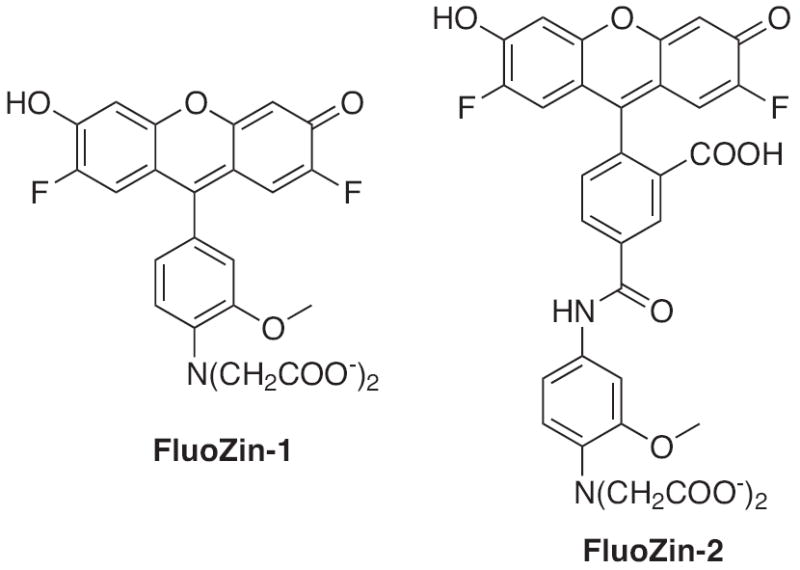
Structures of zinc sensors: FluoZin-1 and FluoZin-2.
Other examples of moderate affinity zinc sensors include variations of the Zinpyr and ZnAF families (Fig. 7). Substitution of the pyridine donor from DPA by a thioether or thiophene donor produces members of the Zinspy family, which exhibit low micromolar Zn2+ affinities and 2–5-fold increases in fluorescence emission [67,68]. Likewise, the binding affinity of ZnAF can be modulated by replacing DPA with ligands that vary the steric demands, chelate ring size and number of donor atoms [69]. The ZnAF probes still maintain a greater turn-on effect, near 200-fold, due to their extremely low quantum yields in the apo form [69]. Members of each family have been utilized in different ways to monitor Zn2+ release in dentate gyrus neurons. Zinspy imaged Zn2+ release from native proteins triggered by S-nitrosocysteine activation [67] whereas weaker and higher affinity ZnAF probes were used simultaneously to monitor differences in Zn2+ released from hippocampal slices induced by potassium neuronal depolarization [69].
Fig. 7.
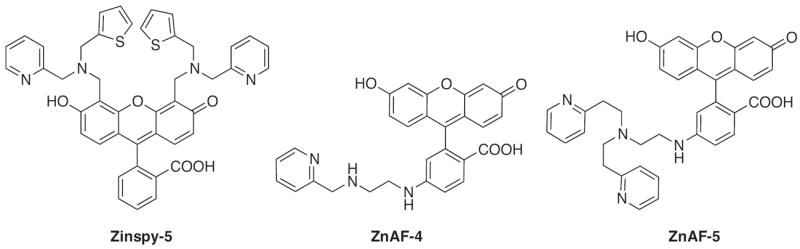
Structures of moderate affinity Zn2+ sensors.
4.2.3. Ratiometric Zn2+ sensors
Although the high and moderate affinity Zn2+ sensors have found utility in the study of Zn2+ biology, they possess several disadvantages. Like any intensity-based sensor, variations in the emission intensity, concentration and compartmental localization of the sensor can cause analysis problems. To overcome these challenges, ratiometric probes such as FuraZin and IndoZin were developed (Fig. 8). Both display different excitation or emission wavelengths in the free or metal-bound form that can be monitored simultaneously. This approach allows for an internal standard and aids in the calculation of intracellular concentrations of Zn2+.
Fig. 8.
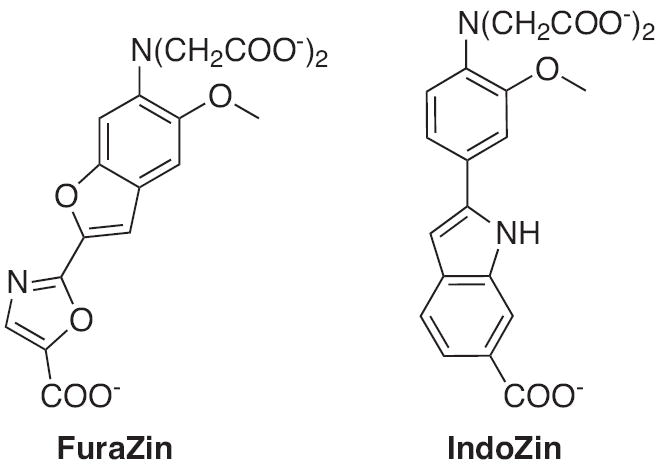
Structures of ratiometric Zn2+ sensors: FuraZin and IndoZin.
FuraZin and IndoZin are analogs of the Ca2+ sensors Fura-2 and Indo-1, and they display shifts in their excitation or emission maxima upon Zn2+ recognition [64]. In their Zn2+ bound forms, FuraZin exhibits a shift in its maximum excitation wavelength while IndoZin undergoes a shift in its maximum emission wavelength. In addition, they are structurally similar to their predecessors but utilize half of a BAPTA chelating unit for Zn2+ specific binding. Despite some success, such as demonstrating that zinc uptake into cellular vacuoles is dependent on the induction of the Zrc-1 gene [70], FuraZin and IndoZin have the disadvantage of requiring UV light for excitation.
4.2.4. Intricacies and complications: in vitro vs. in cells
The quinoline-based fluorophores TSQ and zinquin (Fig. 9) are commonly used Zn2+ sensors long thought to report on nanomolar concentrations of labile or readily chelatable Zn2+. However, recent studies in multiple cell lines show that much of the cellular fluorescence from these agents actually derives from ternary complexes of the agent bound to Zn2+ sites in proteins [71,72]. Interestingly, the fluorescence spectra of cell samples interrogated with these probes were slightly shifted from those of the 2:1 bisligated zinc complexes characterized in vitro. This subtle difference is not apparent by fluorescence microscopy, where both bis-ligated complexes and probe-Zn-protein ternary complexes are visualized with the same microscope filter sets. Rather than detecting only “chelatable” zinc in cells, these agents are therefore also reporting on subsets of the zinc proteome where the zinc site is accessible to the small molecule [71,72]. As with all probes, where, how, and in what form these agents “find” their analyte are important factors for knowing how best to interpret the results. In most cases, this kind of information remains incomplete, but constitutes an area for ongoing and future investigation.
Fig. 9.
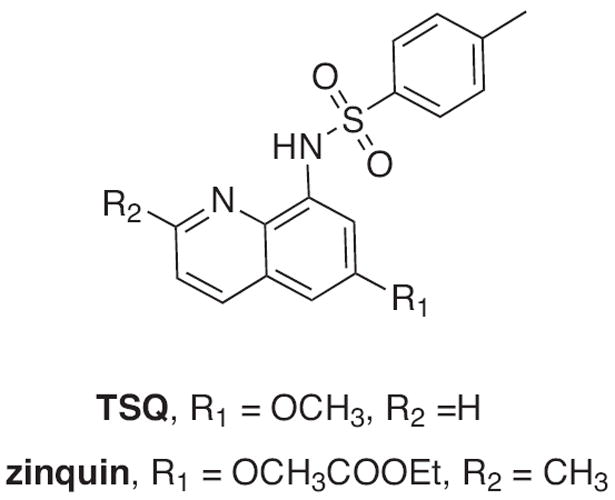
Structures of quinoline-based TSQ and zinquin Zn2+ sensors; both can form tetrahedral 2:1 complexes with Zn2+, or bind 1:1:1 with a protein-bound Zn2+ site.
4.3. Fluorescent copper sensors
In recent years, a broad interest in fluorescent copper sensors has developed, thanks in part to the success of calcium and zinc sensors. Copper is known to be an essential transition metal for human life and as such it plays key roles as a redox cofactor within cytosolic, mitochondrial and vesicular oxygen-processing enzymes [73]. Copper’s involvement in these cellular processes usually stems from its redox or catalytic ability; however, this property can also serve as a potential hazard to a biological system if copper storage and/or transport is misregulated as has been linked to several diseases such as Alzheimer’s, Menkes and Wilson’s diseases [1,18,22,25]. Because of this delicate balance, copper uptake, transport and storage are tightly regulated within the cell. However, our knowledge of these processes is lacking, as is our understanding of how misregulation of copper leads to disease. Fluorescent copper-specific sensors could give insight into important copper trafficking pathways and help reveal the factors implicated in copper-related diseases.
In designing a copper sensor, it needs to be selective for copper over other metals but also needs to be selective for one of its redox states, Cu+ or Cu2+. This challenge is difficult, which explains the limited number of effective Cu+/2+ sensors despite the exhaustive amount of examples found throughout the literature. There are currently only a few examples of Cu+ specific turn-on sensors used to take intracellular images of labile copper pools. Although there are numerous Cu2+ sensors, many of them rely on turn-off mechanisms, and most that do elicit a turn-on response have problems with aqueous solubility. Several examples of Cu+- or Cu2+-specific sensors are described below to illustrate the current developments in intracellular copper sensing and the challenges involved.
4.3.1. Sensors selective for Cu+
Creating an effective Cu+ turn-on sensor is difficult for several reasons. First, Cu+ is likely to disproportionate to Cu0 and Cu2+ in aqueous solutions. Second, despite being a diamagnetic d10 metal ion, Cu+-binding can cause fluorescence quenching in some circumstances, as is seen for example with bathocuproine disulfonate [74]. The Fahrni and Chang laboratories have overcome these challenges by creating Cu+ turn-on sensors that rely on a PET mechanism.
The Fahrni laboratory was first to introduce this technique through the design of CTAP-1 (Fig. 10) [75]. CTAP-1 utilizes a tetrathiaza crown ether as the Cu+ receptor, which is electronically decoupled from the di-substituted pyrazoline fluorophore. The probe is selective for Cu+ over other biologically relevant metal cations including Cu2+, and complexation disrupts the PET causing a 4.6-fold enhancement to the fluorescence emission (Φ = 0.14). Imaging experiments of 3T3 mouse fibroblast cells using fluorescence microscopy revealed that CTAP-1 fluorescence was localized to the mitochondria and Golgi apparatus, which suggests labile copper is present in these regions. Complementary experiments using micro X-ray fluorescence (microXRF) provided further evidence of copper in these organelles. However, CTAP-1 requires UV light excitation and displays some inherent background fluorescence from the apo-ligand (Φ = 0.03). To rectify these problems, two sets of derivatives (labeled as A and B in Fig. 10) were created to optimize the PET by adding electron withdrawing substituents, either a CN- or two fluoro-groups, to the 3-aryl ring and an increasing number of fluoro-substituents at varying positions on the 1-aryl ring [76,77]. These changes verified that the quantum yield of the ligand could be reduced due to an enhancement in the PET. After complexation to Cu+, the fluorescence enhancement increased 50- fold for 2,3,5-F3 substituted version of derivative B. Additionally, the probes are only sensitive to pH at extremely low values when the aniline donor group is protonated, rendering the PET ineffective. However, these compounds were not applied to cellular studies because they are inadequately soluble in aqueous solution and form colloidal aggregates in buffered solvents.
Fig. 10.
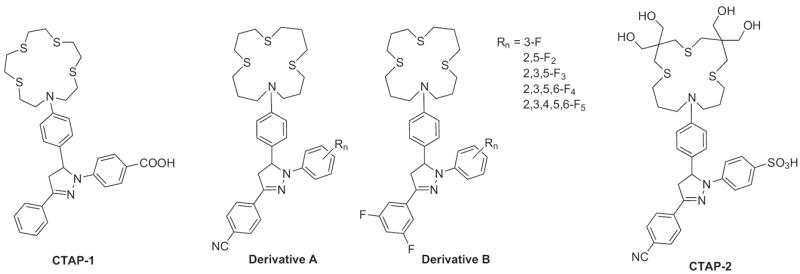
Structures of fluorescent turn-on sensors for Cu+: CTAP-1, its derivatives, and CTAP-2.
In comparison to CTAP-1, another Cu+-selective sensor was designed by the Chang lab and named CS1 (Fig. 11) [78]. The sensor again utilizes a PET mechanism to selectively turn-on its fluorescent signal. In 20 mM HEPES buffer at pH 7, Cu+ binding to the thioether-rich binding pocket increases the fluorescence signal of the BODIPY dye by 10-fold (Φ = 0.13) while the ligand alone exhibits only weak fluorescence at this pH due to PET quenching (Φ = 0.016). The pH dependence of the probe was not reported, although protonation of the tertiary amine would also disrupt PET. CS1 was imaged in HEK 293 (human embryonic kidney) cells using confocal microscopy after incubation with exogenous CuCl2 to raise the intracellular Cu concentration. To complement the work done with CS1, the Chang laboratory developed a ratiometric copper sensor, RCS1, and a mitochondrial-targeted copper sensor, Mito-CS1 (Fig. 11) [79,80]. RCS1 and Mito-CS1 both contain the same Cu+- specific binding site as CS1, but it is attached to the 3-position of 5-methoxy-8-mesityl-BODIPY. As a ratiometric sensor, RCS1 displays two emission maxima with low quantum yields at 505 (Φ = 0.002) and 570 nm (Φ = 0.003) [79]. After addition of Cu+, one emission band centered at 556 nm is seen with an increased quantum yield (Φ = 0.05) and a 20-fold fluorescence increase. When HEK 293 cells were treated with RCS1, the fluorescence imaging indicated that RCS1 could detect endogenous levels of Cu+. The response was larger upon treatment with ascorbic acid, which is consistent with ascorbate increasing labile Cu+ either by enhancing cellular Cu entry and/or by liberating intracellular Cu from protein stores. Much like CS1, Mito-CS1 exhibits a weak fluorescence response (Φ = 0.009) until coordination with 1 equivalent of Cu+ introduces an approximate 10-fold increase in its emission maximum at 558 nm (Φ = 0.05) [80]. However, the addition of a triphenylphosphonium moiety targets the sensor to the mitochondria, as verified by co-staining HEK 293T cells with Mito-CS1 and MitoTracker Deep Red, a commercially available mitochondrial stain. Mito-CS1 was used to detect changes in mitochondrial Cu+ concentrations and to study the effect of cytochrome c oxidase 1 and 2 (SCO1 and SCO2) mutations in human fibroblasts. Although mutations in SCO1 and SCO2 generally lead to a severe copper deficiency in humans, the fluorescence imaging with Mito-CS1 reports that the mitochondrial levels remain mostly unaltered when compared to wild-type controls.
Fig. 11.
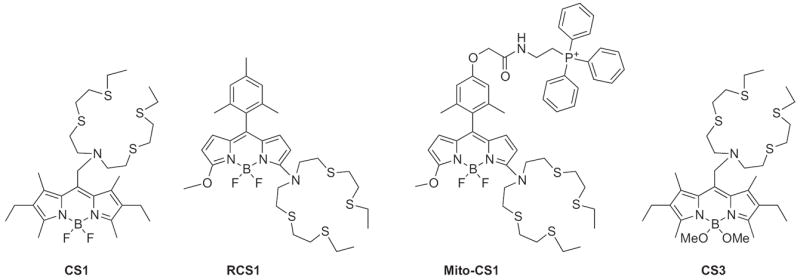
Structures of fluorescent turn-on, targetable and ratiometric sensors for Cu+: CS1, RCS1, Mito-CS1, and CS3.
Modifications to the CS design can tune the photophysical properties of this class of probe [81]. By replacing the fluoro substituents on the BODIPY dye with methoxy groups, as shown by CS3 in Fig. 11, the fluorophore’s electron density is increased and a greater Cu+-dependent fluorescence turn-on is observed. CS3 exhibits a 75-fold increase in emission intensity upon copper binding (Φapo = 0.007, ΦCu = 0.40). Improvements to the quantum efficiency of the metal-bound sensor allowed for prolonged imaging studies on live hippocampal dissociated neuronal cells. The results were interpreted as a dynamic copper redistribution from the soma to the dendritic regions that is dependent on calcium-release [81]. These results suggest provocatively that copper movement plays a role in neuronal signaling.
Building off the foundations of CTAP-1 and CS1, a new two-photon Cu+ sensor, ACu1, has recently been introduced (Fig. 12) [82]. The sensor utilizes the same thioether-rich copper-binding domain as CS1 and is equipped with a 2-methylamino-6-acetylnaphthalene (acedan) fluorescent receptor. A PET mechanism is again responsible for a 4-fold fluorescence increase after copper addition, but the acedan moiety allows for two-photon excitation of the sensor at 750 nm. The advantage of a two-photon sensor was demonstrated by the observation of ACu1s fluorescence turn-on at depths of 90–220 μm through fresh rat hippocampal tissue [82]. The authors report that this fluorescence response reveals Cu+ localization within the Cornu Ammonis areas, CA1 and CA3, as well as in the dentate gyrus regions of the rat hippocampus.
Fig. 12.
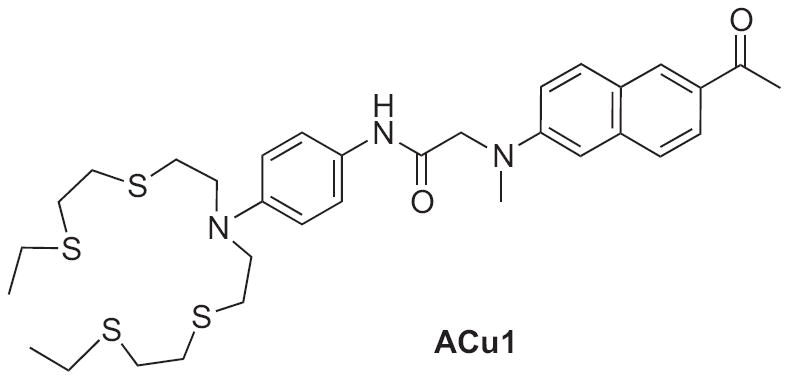
Structure of two-photon fluorescent sensor for Cu+: ACu1.
4.3.2. Intricacies and complications: solubility
As described above in Section 3, the requirements for an effective cellular fluorescent probe include the conflicting properties of water solubility but also cell permeability. Because a certain degree of lipophilicity is required for cell permeability, most fluorescent probes used in biology are indeed hydrophobic and require dissolution in an organic solvent prior to dilution into a working buffer. A recent report from the Fahrni lab calls attention to the fact that many optically clear solutions of probes prepared in this manner likely contain colloidal aggregates, not monomeric probe molecules [83]. In particular, they found by dynamic light scattering measurements that CTAP-1 and its derivatives, as well as CS-1 and CS-3, all form nanoparticles with average hydrodynamic radii between 50 and 100 nm [83]. It is not yet clear how the formation of aggregates alters a probe’s photophysical properties or influences its partitioning within cells. These issues, however, are clearly important to sort out so that fluorescence imaging data can be best interpreted.
The observation of colloid formation led to the preparation of CTAP-2 (Fig. 11) as a water-soluble probe that responds selectively to Cu+ in purely aqueous buffer with a 65-fold fluorescence enhancement and a Kd of 4 ± 1 pM [83]. CTAP-2 was used to stain an accessible Cu+ site within a metalloprotein in a gel, and also showed sub-cellular staining when applied to cells. Interpretation of the cellular staining pattern awaits more detailed studies.
4.3.3. Sensors selective for Cu2+
In comparison to the handful of reported Cu+ sensors, a greater volume of Cu2+ sensors is found throughout the literature. Most of them rely on fluorescence quenching for their detection method due to mechanisms inherent to copper’s paramagnetic nature. More recently, a number of turn-on sensors have been reported because a quenching mechanism is not favorable for imaging experiments. However, most of these turn-on sensors are not soluble in 100% aqueous solutions at a physiological pH, which presents a problem for cellular imaging experiments. Presented below are descriptions of several turn-on Cu2+ sensors in an effort to compare and contrast their reported properties and give insight into the latest advances.
4.3.3.1. Fluorescence turn-on by chelation-induced spirolactam ring opening
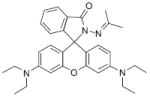
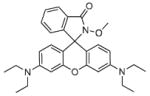
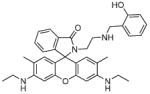
In order to achieve a copper-selective turn-on effect, many researchers have relied on the metal-induced opening of a rhodamine spirolactam ring to trigger a fluorescence enhancement. Examples of this type of sensor and their properties are summarized in Table 1. In their closed spirolactam form, the compounds all exhibit weak fluorescence emissions and are nearly colorless in solution. Cu2+ binding shifts the equilibrium towards the open, fluorescent form of rhodamine and induces an increase in fluorescence emission. Sensors 1, 2, 5, 6 and 8 utilize rhodamine B as their fluorophore and show increases in fluorescence emission ranging from 2.6- to 10-fold [84-88]. A more dramatic 22–80-fold increase is reported with the sensors comprised of rhodamine 6G (3, 4, and 7) except for sensor 9, which shows only a 10-fold fluorescence increase. However, each sensor possesses a unique metal binding site, which differentiates them in terms of their copper binding affinity, selectivity and solubility, as indicated in Table 1. All of the sensors were selective for Cu2+ vs. most other metals, except sensor 6, which displays a Hg2+-dependent turn-on signal due to an irreversible desulfurization reaction [86] and sensor 2, which exhibits fluorescence quenching when Cr3+ is present in solution with the Cu2+-complex [88].
Table 1.
Properties of rhodamine-based spirolactam Cu2+ sensors.
| Spirolactam Cu2+ sensors | Kd (nM) | H2O sol. (10 μM) | F.E.a | λex (nm) | λem (nm) | Φapo, ΦCu2+ | |
|---|---|---|---|---|---|---|---|
| 1 [84] |
|
14 μM | 2% CH3CN | 9.4-fold | 520 | 585 | n.d.d |
| 2 [88] |
|
32 μM | 50% CH3CN | 6-fold | 520 | 576 | n.d. |
| 3 [91] |
|
112 | 50% CH3CNc | 32-fold | 495 | 552 | n.d. |
| 4 [92] |
|
n.d. | 50% CH3CN | 22-fold | 480 | 545 | n.d. |
| 5 [85] |
|
40 | 40% CH3CNc | 2.6-fold | 520 | 550b 574 | n.d. |
| 6 [86] |
|
3.7 | 30% MeOHc | 5-fold | 480 | 578 | n.d. |
| 7 [90] |
|
48 | 20% EtOH | 80-fold | 530 | 550 | n.d. |
| 8 [87] |
|
360 μM | 0.5% CH3CN | 8-fold | 556 | 572 | 0.07,0.45 |
| 9 [89] |
|
248 μM | 50% CH3CN | 10-fold | 500 | 550 | n.d. |
F.E., fluorescence enhancement upon Cu2+ binding.
Emission peak decreases upon titration with Cu2+.
Soluble at 20 μM.
n.d., not determined.
Although most of these sensors report promising results, only five were employed to image intracellular Cu2+. Sensors 3, 9, 4 and 7 were imaged in EJ (lung cancer) cells, SPC-A-1 (lung cancer) cells and HeLa (cervical cancer) cells, respectively, and reported detectable fluorescence responses localized to the perinuclear region of the cytosol in response to exogenously applied Cu2+ [89-92]. Similarly, sensor 8 expressed a Cu2+ dependent response inside murine P19 embryonic carcinoma cells and in zebrafish [87].
Finally, sensor 5 is perhaps the most unique sensor of its kind because it displays a ratiometric signal due to the presence of two fluorescent molecules, pyrene and rhodamine B [85]. Before interaction with Cu2+, the probe emits a fluorescent signal from the pyrene moiety at 550 nm. After Cu2+ binding, the 550 nm peak is quenched while the rhodamine signal at 574 nm is enhanced. Although it was not imaged in a cellular system, it provides a template for future ratiometric designs.
4.3.3.2. Chemodosimeters for Cu2+
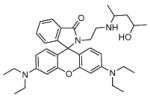
A separate class of fluorescent turn-on sensors, known as chemodosimeters, relies on Cu2+-promoted hydrolysis to irreversibly release a highly fluorescent molecule. Because the paramagnetic metal ion is not bound to the sensor, this method avoids undesired fluorescence quenching. Table 2 displays the structures and summarizes the properties of several Cu2+-selective chemodosimeters. Cu2+ is known to promote hydrolysis of α-amino acid esters [93,94]; therefore, several sensors are based on hydrazide linkages that mimic an amino acid binding motif. Most are soluble in high percentages of water and show strong fluorescence turn-on responses due to the release of rhodamine, fluorescein or coumarin derivatives although their final quantum yields are scarcely reported. In addition, all show good sensitivity for Cu2+ as demonstrated by their nanomolar detection limits.
Table 2.
Properties of Cu2+-selective fluorescent chemodosimeters.
| Select chemodosimeters | Detection limita (nM) | H2O sol. (conc.) | λex (nm) | λem (nm) | Φapo | ΦCu2+ | |
|---|---|---|---|---|---|---|---|
| 10 [95] |
|
10 | 20% CH3CN (0.5 μM) | 510 | 578 | n.d. | n.d.b |
| 11 [96] |
|
64 | l% EtOH (50 μM) | 495 | 516 | 0.02 | n.d. |
| 12 [97] |
|
n.d. | 30% CH3CN (10 μM) | 580 | 600 | n.d. | 0.60 |
| 13 [98] |
|
150 | 30% CH3CN (20 μM) | 510 | 580 | n.d. | 0.31 |
| 14 [99] |
|
87 | 50% CH3CN (5 μM) | 450 | 502 | n.d. | n.d. |
| 15 [100] |
|
100 | 100% (10 μM) | 489 | 513 | n.d. | n.d. |
| 16 [101] |
|
190 | 20% DMSO (10 μM) | 492 | 516 | 0.0002 | 0.81 |
Lowest concentration of Cu2+ detectable by sensor.
n.d., not determined.
Sensors 10–12 take advantage of rhodamine’s and fluorescein’s non-fluorescent closed spirocyclic rings in a similar manner to the previously described Cu2+ sensors [95-97]. After interaction with Cu2+ and hydrolysis of their hydrazide bond, the rings open and release the fluorescent component, as shown in Scheme 1. Sensor 13 hydrolyzes in a similar manner by utilizing its electron-rich sulfur to bind copper in order to stimulate the hydrolysis mechanism. However, it can undergo a different reaction mechanism in response to Hg2+, wherein desulfurization of the backbone leads to the irreversible formation of a 1,3,4-oxadiazole [98]. Despite its lack of specificity, sensor 13 is the only of these chemodosimeter examples used for intracellular monitoring of Cu2+. Images of 13 in HeLa and MCF-7 (breast cancer) cells supplemented with CuCl2 showed fluorescent signals in the perinuclear region of the cytosol, similar to the findings of the spirolactam probes. Much like the rest of the chemodosimeters, sensor 14 hydrolyzes in the presence of Cu2+ to release its highly fluorescent coumarin 334 moiety [99].
Scheme 1.
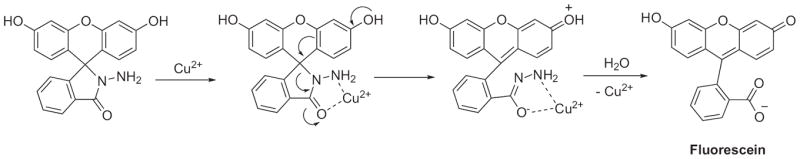
Cu2+-promoted hydrolysis of rhodamine or fluorescein-based chemodosimeters.
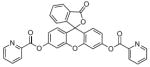
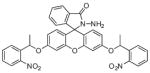
Finally, sensors 15 and 16 both possess similar fluoresceinbased backbones but are triggered by different stimuli. Sensor 15 contains two picolinate esters attached to fluorescein’s xanthene ring that are hydrolyzed by Cu2+ to activate its turn-on response [100]. This unique design could be applicable for the detection of reactive copper species bound to intracellular ligands and biomolecules that contain open coordination sites. Similarly, sensor 16 has two light-activated nitrophenyl derivatives attached to its xanthene ring [101]. Release of these groups by UV light yields a fluorescein derivative of sensor 11, which further reacts with Cu2+ to display a fluorescent signal, as previously described. The mechanism of this probe was applicable in cellular studies where HeLa cells were treated with Cu2+ and 16 displayed no fluorescence emission until it was exposed to 30 s of UV light. Sensors that can be triggered by external or internal stimuli should prove valuable in the ultimate challenge of real-time intracellular Cu2+ sensing due to their potential to sense copper in its bound state, as with sensor 15, or with high temporal and spatial release of the Cu2+ sensitive probe, as seen for sensor 16.
4.3.3.3. Ratiometric Cu2+ sensors
Lastly, a third set of sensors containing naphthalimide chromophores has been designed that enable ratiometric detection of Cu2+. Naphthalimide, when connected to an electron donor and acceptor group, can undergo an internal charge transfer (ICT). Under certain conditions such as metal binding, the strength of the donor/acceptor can be modulated causing a change in energy of the ICT and a shift in the excitation or emission wavelengths [31]. The Qian laboratory has created several naphthalimide derivatives for use as Cu2+ sensors, shown in Fig. 13 as sensors 17–19. The original design, 17, displays a shift in its emission maximum from 525 nm to 475 nm upon addition of Cu2+ [102]. However, it exhibited only modest selectivity and was only soluble in aqueous solvents containing 40% alcohol. Modifications were made to the backbone to create sensor 18, which displays longer excitation and emission wavelengths than the previous design attributed to the Cu2+-induced deprotonation of the two secondary amines conjugated to the naphthalimide fluorophore [103]. The emission maximum of 18 red shifts from 518 to 592 nm upon Cu2+ binding but still has limited aqueous solubility. The most recent design, 19, displays a 50 nm red-shift in its absorption maximum from 464 to 514 nm due to interaction with Cu2+; although, its emission spectrum only shows fluorescence quenching [104]. In comparison to these sensors, a separate group has created a ratiometric probe based on the signals produced from two fluorophores, naphthalene and naphthalimide (Fig. 13, sensor 20) [105]. Upon addition of Cu2+, an enhancement to the naphthalene emission band at 435 nm is seen, whereas the naphthalimide band at 510 is quenched. Although this idea is attractive due to the combined use of two distinct fluorophores, its drawbacks are its limited aqueous solubility and required UV excitation. Despite the proposed usefulness of a ratiometric sensor, none of the compounds discussed have been utilized for intracellular copper imaging.
Fig. 13.
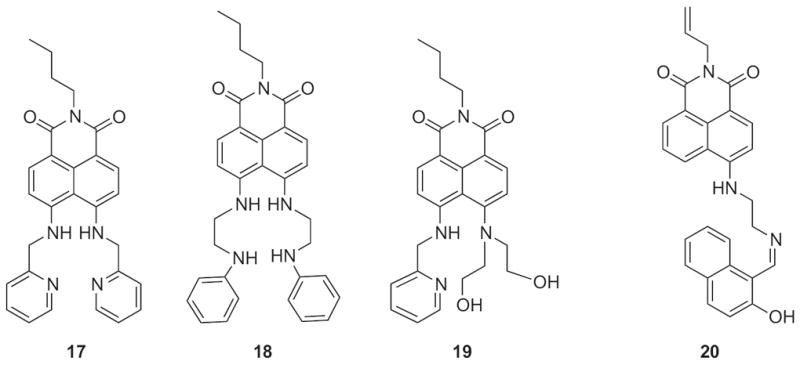
Structures of ratiometric sensors for Cu2+.
4.3.4. Intricacies and complications: off-target responses
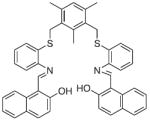
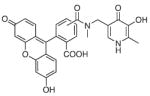
Several potential complications may affect sensors that rely on opening of a rhodamine or fluorescein spirolactam ring, such as those found in Table 1. One is pH. While most of these compounds are in the closed form near neutral pH, a decrease in pH will shift the equilibrium to the protonated, ring-opened form. Weakly acidic microenvironments within a cell could therefore cause a fluorescence response that is indistinguishable from a metalinduced response [106]. Furthermore, many of the reported metal ion sensors contain hydrazone linkages that may be susceptible to hydrolysis. For example, we reported that sensor FlamB (see Section 6 and Fig. 24), which has structural features similar to those shown in Table 1, hydrolyzes in aqueous solution to give a fluorescein hydrazine byproduct that reacts irreversibly with either Cu2+ (see Scheme 1) or H2O2 to release fluorescein [107]. Although hydrazone linkages may appear quite stable in buffered solution in vitro, changes in pH or the presence of amines or other mediators in cell culture media or within a cell can shift the equilibrium of this reversible linkage and release products that provide off-target fluorescence responses. Determining the integrity of these probes under a variety of solution conditions is therefore important in order to best interpret their response profiles in real applications.
Fig. 24.
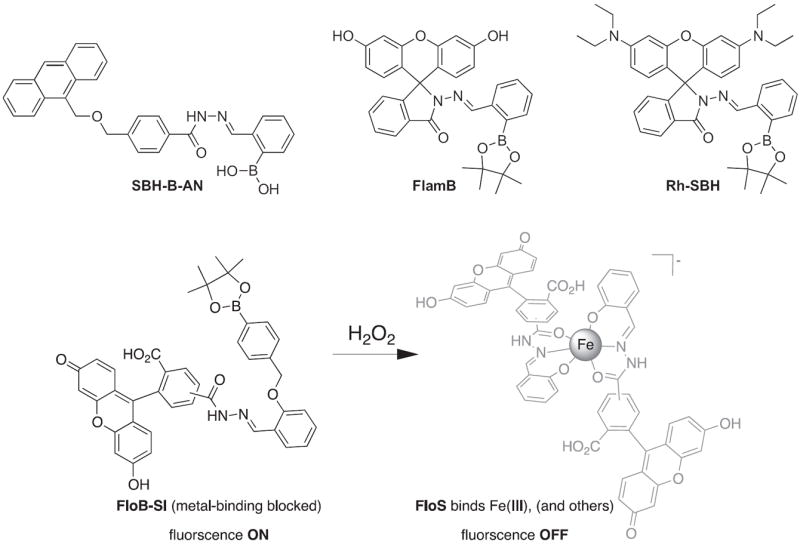
Structures of multifunctional metal sensors, along with a reaction scheme showing the H2O2-initiated iron binding of one example, FloB-SI.
4.4. Fluorescent iron sensors
As with copper, iron’s biological involvement is critical and yet insufficiently understood. Iron is an essential transition metal that is necessary for such essential life processes as oxygen transport and metabolism, electron transfer, and enzymatic reactions within the mitochondrial respiratory chain; however, disruptions in the normally strict regulation of iron are responsible for severe systemic disorders, such as anemia and hemochromatosis [108,109]. In addition, misregulated iron homeostasis is also linked to neurodegenerative diseases, including Alzheimer’s and Parkinson’s disease [1,17,21,23,24]. In order to combat these diseases, a better understanding is needed of iron’s role or the factors involved in its misregulation; fluorescent iron sensors could help provide this information. Additionally, enzymes or storage proteins tightly bind the majority of biological iron, but there is evidence that a small percentage is considered “labile,” meaning that it is loosely bound to a mixture of organic anions, polypeptides or membrane components [110]. Labile iron is considered to be in a steady-state equilibrium, while maintaining kinetic availability for incorporation into metalloenzymes and proteins [111,112]. Increases in labile iron concentration are a consequence of oxidative stress and UV damage, which in turn plays a larger role in the onset of disease [113,114]. Iron-specific fluorescent sensors could provide a way to monitor changes to intracellular iron levels, providing further insight into its location and speciation.
The design of fluorescent iron sensors is complicated by the presence of dynamic redox states. Biological iron can exist as either the ferrous (Fe2+) or ferric (Fe3+) oxidation state depending on the coordinated ligands and cellular reducing environment. In addition, both Fe2+ and Fe3+ are usually paramagnetic in nature. An effective sensor should be selective for one of these oxidation states and yet overcome its tendency to quench a fluorescent signal. Again, despite the many sensors presented throughout the literature, none fulfill all of the necessary requirements. However, as will be described in the following sections, a large number of ratiometric or turn-on iron sensors have been presented over the last few years and provide promise for future developments.
4.4.1. Commercially available Fe3+/Fe2+ sensors
Currently, there are two commercially available sensors used for detecting levels of intracellular iron: calcein and Phen Green SK (Fig. 14). Both rely on fluorescence quenching mechanisms and are not completely specific for either oxidation state of iron. Calcein’s structure consists of a fluorescein backbone with an EDTA-like chelating moiety. Originally, it was thought to show Fe2+-specific quenching and was utilized to track the release of Fe2+ from transferrin and measure changes in cytosolic Fe2+ concentrations due to oxidative or reductive stress [111,115,116]. However, because iron quenches the fluorescent signal, a second competitive chelator is needed to restore the fluorescence and back-calculate the concentration of bound iron. It is now known that Fe3+ as well as Co2+, Ni2+ and Mn2+ also quench calcein’s emission [115,117]. In addition, the Fe(II)–calcein complex promotes the formation of radical species that can degrade free calcein and cause a second off-target fluorescence decrease [118].
Fig. 14.
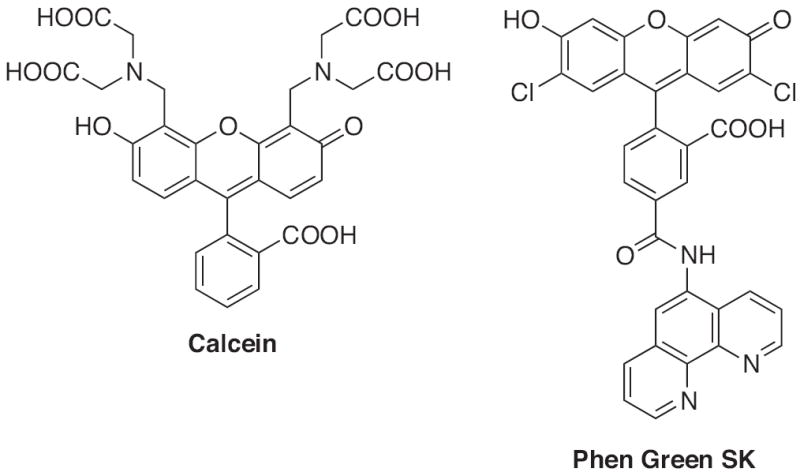
Structures of commercially available iron sensors: Calcein and Phen Green SK.
Phen Green SK is the second commercially available fluoresceinbased probe used for intracellular Fe2+ sensing. It has shown utility in the measurement of the intracellular labile iron pool [112,119]. But once again, Phen Green SK’s non-specific binding site leads to quenching from a variety of metals including Fe3+, Fe2+, Cu2+, Co2+ and Ni2+. Although calcein and Phen Green SK have been used in intracellular experiments, they are likely to have off-target responses. Therefore, probes that are more specific for Fe2+ or Fe3+ are critical for intracellular studies.
4.4.2. Sensors selective for Fe2+
Designing a sensor with specificity for Fe2+ over Fe3+ is difficult due to its propensity for oxidation within aqueous and aerobic conditions. Because of this challenge, there are only two fluorescent sensors selective for Fe2+, pyrene-TEMPO and DansSQ (Fig. 15). Both exhibit a turn-on response to Fe2+ but via different mechanisms. Pyrene-TEMPO is a spin fluorescent probe that exists as a radical and exhibits a weak fluorescence emission at 430 nm [120]. In the presence of Fe2+, the radical is reduced and pyrene’s fluorescence is restored. The mechanism of fluorescence enhancement is specific to Fe2+ over other metal cations. However, the reaction is conducted in acidic solutions and can proceed in the presence of other radicals, which limits the utility of pyrene- TEMPO in biological systems. The second Fe2+ turn-on sensor, DansSQ, consists of a dansyl-styrylquinoline conjugate. The ligand is weakly fluorescent due to an ICT from the quinoline nitrogen to the nitrostyryl group upon excitation [121]. Binding of Fe2+ disrupts this transfer and a 15-fold fluorescence enhancement is observed at 460 nm (Φ = 0.075) upon excitation at 365 nm. However, the probe is not completely selective for Fe2+ as it shows increased fluorescence with a large excess of Cu2+, Fe3+, Hg2+ and Cr3+. Also, DansSQ is only soluble in CH3CN containing 10% H2O.
Fig. 15.
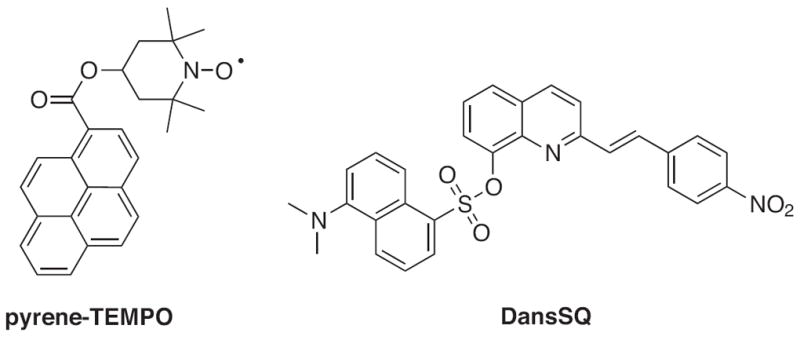
Structures of turn-on fluorescent sensors for Fe2+.
4.4.3. Sensors selective for Fe3+
In comparison to the small number of available Fe2+-specific sensors, the field of Fe3+ sensing is vast. Most involve a turn-off mechanism; however, over the past 5 years a large number of turnon and ratiometric sensors have emerged, and several have been utilized in biological systems. Representatives from each of these classes will be discussed further, but as was seen with the copper sensors, no single design has met all of the necessary criteria needed for a successful intracellular probe.
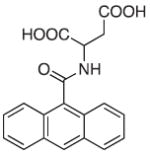
Several fluorescent turn-off sensors have been created with greater selectivity for Fe3+ than was seen for calcein or Phen Green SK. Most are fluorescently tagged siderophores (iron-chelating natural products) or synthetic polymer-mimics [122-127]. Although these will not be discussed within the context of small molecule fluorescent sensors, most siderophore-like sensors show highselectivity and sensitivity to Fe3+. Many Fe3+ sensors are derived from these same basic principles, mainly that a known iron chelator is tagged or modified with a fluorophore. For example, sensor 21, shown in Table 3, incorporates a known siderophore-binding motif comprised of a phenol substituent adjacent to an sp2 hybridized nitrogen into its backbone [128]. Despite this thoughtful design, the probe still shows 30% emission quenching with Cu2+ and has minimal aqueous solubility. Sensors 22 and 23 are representatives of a large library of sensors developed by the Hider laboratory [129-131]. Each is constructed on a hydroxypyridinone or hydroxypyranone chelating backbone with a coumarin or fluorescein derivative attached and shows selective fluorescence quenching to Fe3+ up to 90%. The more recent fluorescein derivatives, such as sensor 22, accumulate in endosomes and lysosomes of murine bone marrow derived macrophages. They were also utilized in flow cytometry experiments to determine cellular iron concentrations [130,131]. Other designs of Fe3+ turn-off sensors include sensor 24, which is composed of an anthracene linked to aspartic or glutamic (not shown) acid. Although both amino acid-containing probes are soluble in aqueous solvents, they exhibit their highest sensitivity for Fe3+ at pH 5, which is below the physiological pH of most organelles [132].
Table 3.
Properties of Fe3+-selective turn-off sensors.
| Fe3+ sensors | Kd (nM) | % em. decrease | λex (nm) | λem (nm) | Φapo | |
|---|---|---|---|---|---|---|
| 21 [128] |
|
26 | 80% | 275 | 375 | n.d.a |
| 22 [130] |
|
n.d. | 77% | 494 | 512 | n.d. |
| 23 [129] |
|
n.d. | 76% | 416 | 477 | 0.02 |
| 24 [132] |
|
60 μM | 100% | 363 | 412 | 0.20 |
n.d., not determined.
Several turn-on sensors with response to Fe3+ have recently appeared and are summarized in Table 4. As noted in the table, many of them require organic co-solvents for solubility. Sensors 25–32 utilize the same rhodamine turn-on mechanism as seen for several Cu2+-specific turn-on sensors [133-139]. Sensor 29 is unique because it hydrolyzes in the presence of Fe3+ to release the free rhodamine derivative much like the previously described chemodosimeters [137]. Each of the other sensors remains in its closed spirolactam form until interaction with Fe3+, which forces the equilibrium to the fluorescent ring-open form. As noted above in the complications Section 4.3.4, H+ will also induce ring opening, making it difficult to discriminate Fe3+ binding from decreased pH [106].
Table 4.
Properties of reported fluorescent turn-on sensors for Fe3+.
| Fe3+ turn-on sensors | Kd (μM) | F.E.a | H2O sol. (10 μM) | λex (nm) | λem (nm) | ΦFe3+ | |
|---|---|---|---|---|---|---|---|
| 25 [133] |
|
43 | 112-fold | 50% CH3CN | 510 | 583 | n.d.b |
| 26 [134] |
|
6.3 | 25-fold | 50:50 MeOH:CH3CN | 530 | 580 | n.d. |
| 27 [135] |
|
n.d. | 51-fold | 40% EtOH | 561 | 583 | n.d. |
| 28 [136] |
|
90 | 50-fold | 100% EtOH | 510 | 554 | n.d. |
| 29 [137] |
|
60 | 45-fold | 5% CH3CN | 528 | 551 | 0.60 |
| 30 [139] |

|
0.32 | 48-fold | 100% | 510 | 575 | n.d. |
| 31 [138] |
|
0.20 | 48-fold | 75% CH3CN (5 μM) | 510 | 580 | 0.048 |
| 32 [106] |
|
n.d. | ~36-fold | 20% MeCN (2 μM) | 558 | 582 | n.d. |
| 33 [140] |
|
6.7 | 15-fold | 100% (l μM) | 336 | 412 | n.d. |
F.E., fluorescence enhancement.
n.d., not determined.
At first glance, it seems surprising these sensors would have an affinity for iron over copper. In fact, several sensors including 25, 28, 30 and 31 do show increases in fluorescence emission upon introduction of Cu2+ although it is much smaller than the Fe3+- induced enhancements [133,136,138,139]. The longer alkyl chains in 28 and 30 that connect the donor atoms may help the chelator wrap more effectively around the slightly smaller Fe3+ cation, although metal complexes of these ligands have not been thoroughly characterized. Likewise, metal complexes of 25, 26, and 31 have not been structurally characterized, and it is not obvious how these ligands interact with Fe3+. In contrast, 32 forms a bisligated [Fe(L)2]3+ complex that has been structurally characterized and shows a typical rhodamine emission spectrum between pH 3 and 8 [106].
Three of the sensors, 25, 29, and 32 were used for Fe3+ imaging in cells. Incubation of PIEC (pig iliac artery endothelium) cells or Hep G2 (hepatocellular cancer) cells with 25 or 29, respectively, only showed detectable fluorescence emission after addition of exogenous Fe3+ or if the cells had been pretreated with extra Fe3+ [133,137]. Confocal microscopy of HeLa cells incubated with either the pre-formed [Fe(L)2]3+ complex or the free ligand 32 showed a fluorescence response that was localized to endosomes or lysosomes. While these data show that 32 and its iron complex are cell permeable, the authors point out the difficulty in determining whether the positive response from 32 arises from its fluorescent protonated version or its ferric chelate version [106]. It is important to point out that this difficulty is a general one that is true for any sensor that provides a pH-dependent fluorescence profile. In many cases, the evidence of a metal-dependent fluorescence change observed inside cells is circumstantial and could be induced by unintended pathways.
Two reported turn-on sensors utilize macrocycles as their Fe3+ recognition sites. Sensor 33 contains two aza-18-crown-6 iron-chelating moieties attached to a coumarin [140]. The azacrowns exhibit a moderate affinity for Fe3+ (6.7 μM) and a weaker affinity for Cu2+ (0.42 mM). Because of its dual affinity, the sensor displays a 15-fold turn-on with Fe3+ but also a 2.5-fold turn-on with Cu2+. The second design consists of a mixed-donor (N,S,O) macrocycle and was originally reported to have selective affinity for Fe3+ in aqueous solutions (pH of 5) [141]. More recently, the same macrocycle was incorporated into a UV-light activated Fe3+ photocage and was shown to have no affinity for Fe3+ in aqueous solvents [142]. Although formation of the iron complex was confirmed in 100% CH3CN, the macrocycle’s binding affinity is compromised in oxygen-donating solvents such as MeOH causing iron to be released. The authors further described that the originally reported iron-dependent fluorescence increase was an off-target response to protonation of the ligand’s aniline nitrogen in slightly acidic solutions [142].
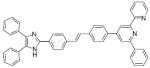
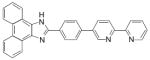
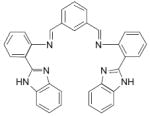
Finally, there are a few sensors that demonstrate a ratiometric change in emission intensity upon Fe3+ binding (Table 5). Sensor 34 consists of 2,4,5-triphenylimidazole linked to 6-phenyl-2,2′- bipyridine, which is soluble in aqueous solvents with 50% THF and is selective for Fe3+ aside from some quenching due to Hg2+ [143]. A ratiometric change is observed by increases at 416 and 442 nm and a decrease at 480 nm after excitation at 375 nm. Sensor 35 is constructed from a phenanthroimidazole dye and a bipyridyl-chelating group [144]. Fe3+ binding induces an increase in emission at 440 nm and a decrease at 500 nm after excitation at 352 nm. However, other metals including Cu2+, Ni2+ and Fe2+ induce other various changes to the emission spectra. The third ratiometric sensor (36) is based on a benzimidazole fluorescent receptor and shows a decrease in emission at 412 nm accompanied by an increase at 475 nm after excitation at 288 nm. This sensor shows good selectivity for Fe3+; however, it is only soluble in aqueous conditions with 95% CH3CN [145]. Although ratiometric sensors are generally advantageous for cellular applications, these share the disadvantage of needing UV light for excitation. In particular, sensor 36 requires an extremely low excitation wavelength and could not be used in a biological system.
Table 5.
Properties of Fe3+ ratiometric sensors.
| Fe3+ ratiometric sensors | Kd (μM) | H2O sol. (5 μM) | λex (nm) | λem free (nm) | λem Fe3+ (nm) | |
|---|---|---|---|---|---|---|
| 34 [143] |
|
15 | 50% THF | 375 | 501 | 416, 442 |
| 35 [144] |
|
n.d.a | 50% MeOH | 352 | 500 | 440 |
| 36 [145] |
|
34 | 95% CH3CN (10 μM) | 288 | 412 | 475 |
n.d., not determined.
5. Fluorescent sensors for intracellular detection of small molecules
5.1. Intricacies and complications: commonly available fluorescent sensors for reactive oxygen species
There is great interest in monitoring the in vitro and in vivo presence of ROS. ROS are produced during physiological and pathological processes [1,5,146] and react with cellular components such as several amino acids, proteins, lipids and nucleic acids [147-149]. In some cases these reactions are advantageous to the system because they involve redox signaling, cell migration, proliferation and neurogenesis [146]. However, during times of stress, ROS can participate in damaging reactions leading to exhaustive cellular damage.
Perhaps contrary to popular hope and convenience, most commercially available probes for oxidative activity are not specific for individual ROS [6,27,28]. For instance, one of the most commonly used probes for oxidative activity is 2,7-dichlorodihydrofluorescein (DCFH, Fig. 16), a non-fluorescent molecule that can be oxidized by two electrons to fluorescent 2,7-dichlorofluorescein (DCF). Although it is often cited as a probe for H2O2, DCFH does not react directly with H2O2 to produce the fluorescent product, but rather requires a catalyst like cytochrome c or a redox-active metal ion. Furthermore, the one-electron oxidation of DCFH produces a radical intermediate that can itself react with O2 to release superoxide. DCFH has additional disadvantages of photosensitivity, which results in auto-oxidation and a false turn-on fluorescence response [150,151], and its oxidized product has low intracellular retention, which limits its use as a quantitative tool or in systems with slow oxidation. To overcome the cellular retention flaw, carboxylated, fluorinated, and chloromethyl derivatives were designed (Fig. 16) so that the charged fluorescent products would be retained [30]. Dihydrorhodamine, dihydroethidium, and Mito-Sox are other nonfluorescent dyes that undergo oxidation to give a fluorescence response. While these probes are often touted as being “specific” for peroxynitrite, superoxide, and mitochondrial superoxide, respectively, many of the limitations of DCFH apply to these molecules as well. The reader is referred to excellent reviews and discussions on the pitfalls and complications associated with these ROS probes [6,27,28,152].
Fig. 16.
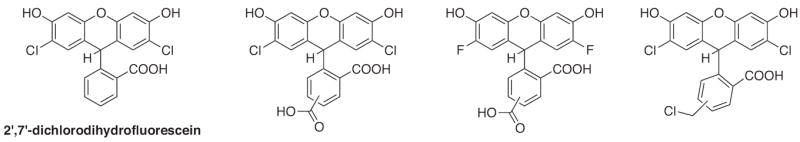
Structure of 2′,7′-dichlorodihydrofluorescein (DCFH) and its derivatives.
Two probes that offer greater photostability and more limited reactivity with ROS are 3′-(p-aminophenyl)fluorescein (APF) and 3′-(p-hydroxyphenyl)fluorescein (HPF) (Fig. 17) [153]. Both probes are non-fluorescent until reaction with the hydroxyl radical, peroxynitrite anion or singlet oxygen causes O-dearylation of the aminophenyl or hydroxyphenyl rings. In addition, APF can react with hypochlorite anion (OCl−). Because of this difference in reactivity, if APF and HPF are used in conjunction, OCl− can be selectively detected. In addition, APF and HPF are resistant to autooxidation and can be used in the presence of an enzymatic system [153].
Fig. 17.
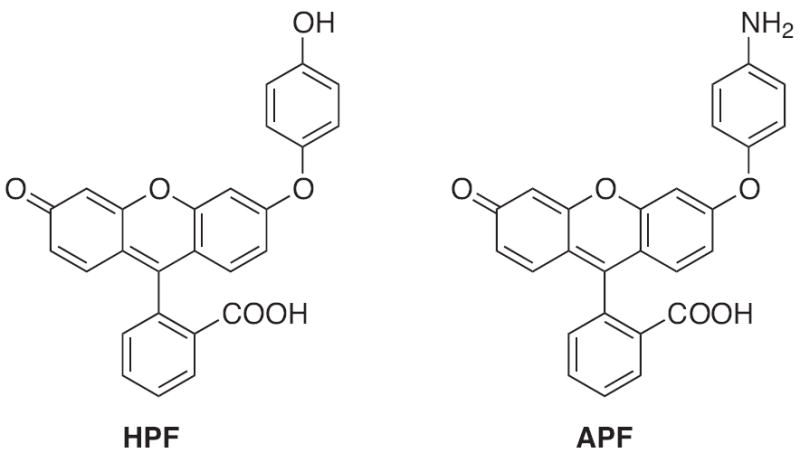
Structures of HPF and APF.
More recently developed, Invitrogen now offers CellRox Deep Red Reagent. The probe is cell-permeable and non-fluorescent until oxidation with reactive species yields a fluorophore that has excitation and emission maxima at 640 and 665 nm, respectively [30]. Although the structure is not published, the probe claims to offer several advantages over other commercially available probes. Most noticeably, CellRox Deep Red Reagent shows high photostability when compared to DCFH.
Because OH• is the presumed species that causes direct damage to biomolecules, a fluorescent sensor specific for this radical would be highly desirable. However, the diffusion-limited rate of reaction between OH• and biomolecules means that a very high probe loading localized to the site of radical generation would be required to intercept and detect this species [28]. An interesting strategy for OH• detection based on a Tb chelate complex has been introduced, although it has not been reduced to practice in cells [154].
5.2. Fluorescent sensors for cellular hydrogen peroxide
As an important intracellular small molecule, H2O2 plays the role of antagonist and protagonist. Most often thought of in the context of disease-causing oxidative stress and damage, emerging evidence supports the notion that H2O2 has other beneficial responsibilities. Studies have shown that H2O2 production is a result of the activation of cell surface receptors, and it acts as a second messenger for the determination of life span and signaling of protein function [155-158]. For instance, it oxidizes the cysteine residues on proteins to modulate their function by acting on sites found in transcription factors and protein tyrosine phosphatases [158]. This process has downstream effects such as gene transcription, cell proliferation, differentiation and metabolism [159]. On the other hand, it is well understood that H2O2 as a ROS can contribute to damaging levels of oxidative stress connected to cancer [160,161] and neurodegenerative diseases [1,4]. However, our knowledge of H2O2’s mechanisms of production, accumulation, trafficking and function whether in healthy or diseased states is insufficient. Fluorescent probes could offer the ability to monitor these processes in real time and with high spatial recognition, but they must be selective for H2O2 even in the presence of other ROS.
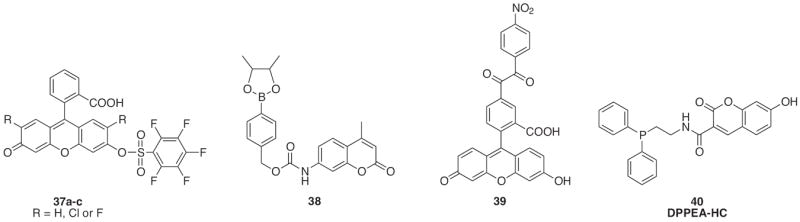
To overcome the limitations of DCFH and create probes with greater selectivity for H2O2, researchers sought to utilize functional groups or protecting groups that would react solely to H2O2. One such set of probes utilizes fluorescein protected as the pentafluorobenzenesulfonyl ester (Fig. 18, 37a–c) [162]. The sulfonyl group acts as the H2O2-responsive component, and its location at the top of the xanthene ring forces fluorescein into its non-fluorescent closed ring form (Φ = 0.008 for 37b). The pentafluorobenzene ring was chosen because it enhances the sulfonate’s reactivity to H2O2, as demonstrated by the fast rate of deprotection for probes 37b and 37c (k = 14 × 102 M−1 s−1 and k = 15 × 102 M−1 s−1, respectively). Importantly, the probes showed good sensitivity to H2O2 over the hydroxyl radical (OH•), tert-butyl hydroperoxide (tBuOOH), peroxynitrite (ONOO−), and the superoxide radical (O2•−) but showed a slight response to the nitric oxide radical (NO•) over time. Lastly, this design was tested in green algae as a model for cellular H2O2 detection. The probe’s selectivity for H2O2 was maintained even when the system was stressed with various ROS-inducing stimuli.
Fig. 18.
Structures of H2O2-responsive probes.
Probe 38 provides a second example of an H2O2-responsive protecting group by utilizing a butanediol ester of p-dihydroxyborylbenzyloxycarbonyl (Dobz) to mask the amino functionality of a coumarin fluorophore (Fig. 18) [163]. Reaction with H2O2 deprotects the arylboronic ester and causes a cascade to release the Dobz group. The fluorescent signal can monitor H2O2 formation down to the low micromolar range in slightly basic conditions (λex = 348 nm, λem = 440 nm). Although the arylboronic ester should be selective for H2O2, studies against other ROS were not performed.
A third, more recent example of this concept is seen with probe 39 in which a benzil group is used to quench the fluorescence of fluorescein through a donor-excited photoinduced electron transfer process (d-PeT) [164]. The nitro-benzil group reacts with H2O2 to form benzoic anhydride through a Baeyer–Villiger type reaction followed by further hydrolysis to benzoic acid and releases 5-carboxyfluorescein leading to a 150-fold increase in its emission intensity. The probe was selective for H2O2 over O2•−, OH•, NO•, hypochlorite ion (−OCl) and singlet oxygen (1O2). However, small fluorescence enhancements were seen with ONOO− and tBuOOH. Furthermore, probe 39 was utilized in live cell imaging to visualize H2O2 production in RAW 264.7 macrophages stimulated with phorbol-12-myristate-13-acetate (PMA) and in A431 human epidermoid carcinoma cells following epidermal growth factor stimulation.
An alternate approach has been pioneered for the intracellular detection of H2O2 through the creation of probe 40 or DPPEAHC. Through a PET mechanism, the lone pair on the phosphorous of diphenylphosphine inhibits the fluorescence of an adjoined 7- hydroxycoumarin (λex = 396 nm, λem = 449 nm) [165]. Oxidation of the phosphorous to diphenylphosphine oxide by H2O2 restores the fluorescence emission (Φ = 0.82). The probe is specific for H2O2 over ONOO−, OH•, −OCl and alkylperoxyl radical (ROO•) but shows an equal response with O2•− and NO. However, the sensor was applied to an enzymatic system consisting of xanthine, xanthine oxidase and superoxide dismutase to effectively monitor the catalytic generation of H2O2.
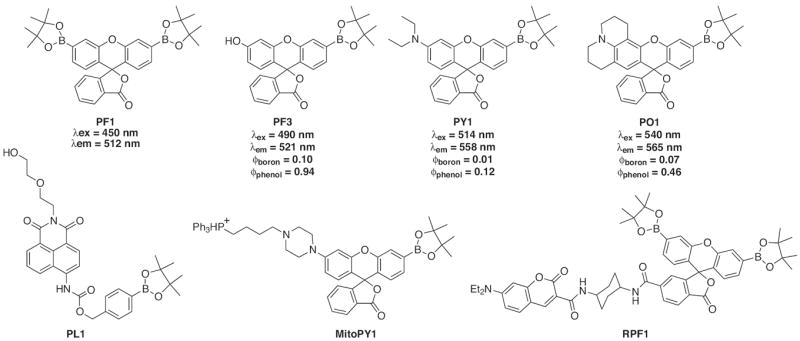
Among the probes developed for H2O2-sensing, one family of compounds has far exceeded the rest. Building off of the idea of H2O2-selective arylboronate esters found in probe 38, the Chang laboratory has developed a set of highly fluorescent probes. Fig. 19 displays several of the probes and summarizes their fluorescent properties. In each case a pinacol boronic ester masks the phenolic oxygen on fluorescein’s xanthene ring rendering it non-fluorescent. Interaction with H2O2 removes the boronate group and restores the fluorescence intensity. The original design (peroxyfluor-1, PF1) utilized two boronate groups but lacked the sensitivity to detect physiological signaling levels of H2O2 [166-168]. To correct this problem, one boronate ester was replaced with differing functional groups to create a variety of probes with excitation and emission wavelengths that span the visible spectrum, shown in Fig. 19 as PF3, PY1 and PO1 [169]. By increasing the sensitivity of these three compounds, they were able to image H2O2 signals produced in RAW 264.7 macrophages during an immune response and in A431 cells following growth factor stimulation. In addition, the boronic ester mask shows high selectivity for H2O2 over O2−, tBuOOH, NO, NO+, 1O2, ozone (O3), OCl−, OH• and the tert-butoxy radical (•OtBu), although the H2O2 reaction is in fact quite slow (on the order of 0.1–1 mol−1 s−1). However, it is likely that these probes also respond to OONO−, as others have shown that aryl boronates in general react a million times faster with OONO− than with H2O2 [170].
Fig. 19.
Structures of boronate-based fluorescent probes for H2O2.
The range of emission wavelengths allows for dual-color imaging experiments, as demonstrated by the use of PO1 in tandem with a green-fluorescent reporter for highly reactive oxygen species to monitor levels of H2O2 and HOCl simultaneously in live cells. In addition to this work, the lab has also developed two ratiometric probes, one utilizing a fluorescence resonance energy transfer (FRET)-based approach and the other an ICT approach to shift the emission wavelength after H2O2 interaction (Fig. 19, RPF1 and PL1, respectively) [171,172]. Finally, a bifunctional probe was created that utilized a triphosphonium head group to target the H2O2- selective probe to the mitochondria of living cells (Fig. 19, MitoPY1) [173]. This molecule is of particular interest because it is the first multifunctional H2O2 probe that can visualize the localized production and accumulation of H2O2 in a living system. An approach such as this could aid in our understanding of H2O2’s complex role within healthy and diseased systems.
5.3. Fluorescent sensors for intracellular thiols
Intracellular thiols such as those found in proteins or small molecules like cysteine (Cys) or glutathione (GSH), play crucial roles in cellular antioxidant defense. But much like their oxidative counterpart, H2O2, an increased or decreased level of thiols signals an imbalance in cellular redox homeostasis. For instance, GSH is an antioxidant found in millimolar concentrations that protects cells from ROS, like H2O2, by acting as a reducing agent [174,175]. Depending on the environmental needs, GSH can redox cycle to its oxidized form, glutathione disulfide (GSSG) to provide support for cell growth and function [8,176]. Variations in intracellular GSH levels are directly linked to diseases such as cancer, Alzheimer’s and cardiovascular disease [7]. Likewise, Cys and homocysteine (Hcy) are essential thiol-containing amino acids utilized as reducing agents and in protein synthesis. However, a cysteine deficiency causes various health problems like liver damage and skin lesions, while an elevated level of Hcy is noted as a risk factor for Alzheimer’s and cardiovascular disease [177,178]. Due to their importance in maintaining a healthy system and signaling the onset of disease, intracellular thiols provide an interesting target for fluorescent probes.
Many of the first and most common thiol sensors are non-fluorescent derivatives of N-substituted maleimides, which undergo nucleophilic thiol addition across the carbon-carbon double bond to produce an irreversible fluorescence enhancement. Probe 41, N-[4-(2-benzimidazolyl)phenyl]-maleimide, was the first example to utilize this mechanism (Fig. 20) [179]. However, it requires low wavelength excitation, long reaction times and high percentages of organic solvents for aqueous solubility making it a poor sensor. Since that time, many new derivatives, which rely on nucleophilic addition to initiate a change in fluorescence have been prepared to overcome these disadvantages.
Fig. 20.
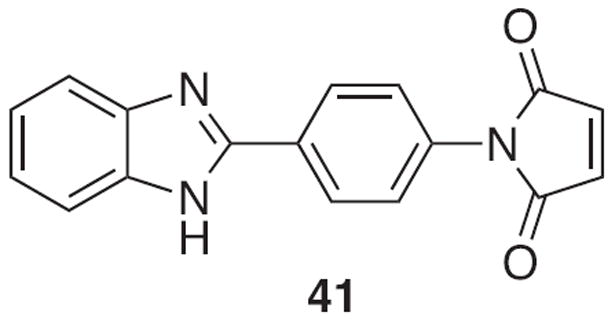
Structure of N-[4-(2-benzimidazolyl)phenyl]-maleimide.
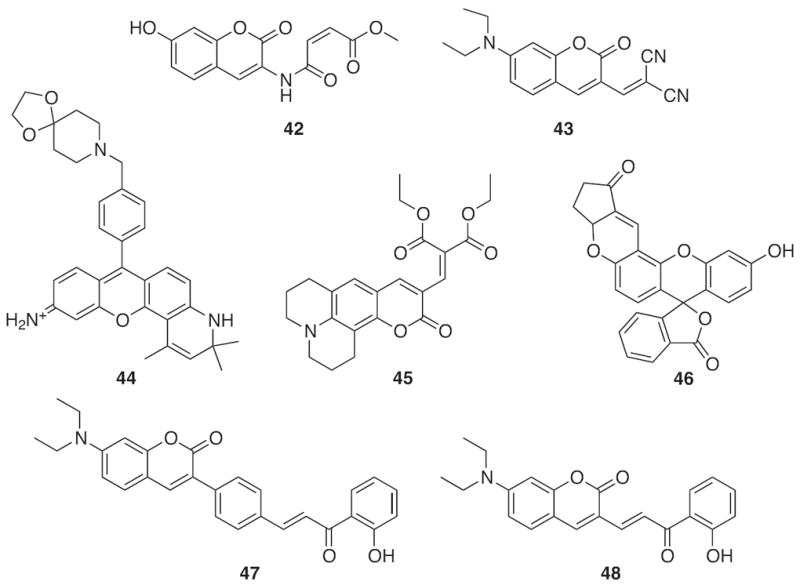
As compared to the original design, 41, most current sensors utilize fluorophores with improved photophysical properties such as fluorescein for probe 46 [180], rosamine for probe 44 [181] and coumarin for probes 42, 43, 45, 47 and 48 (Fig. 21) [182-186]. In addition, different thiol reactive sites have replaced the maleimide group to increase the rate of reaction. For example, probe 42 contains a cis double bond that efficiently reacts with Cys through Michael addition with a rate of 7.0 × 10⁴ M−1 s−1. This rate of reaction is 20 times faster than most other thiol reactive probes [182]. Probe 45 is of interest due to its high selectivity for Cys over Hcy and GSH. Although it shows a slight increase in fluorescence with Hcy and GSH, the reaction with Cys proceeds with the fastest rate and produces the highest quantum yield (Φ = 0.33) [183]. Probe 43 also shows slight selectively towards Cys by producing a 19-fold fluorescence enhancement; however, Hcy and GSH yield modest increases in the probe’s emission intensity, 12 and 5.6-fold, respectively [184]. The rosamine-based probe, 44, was chosen from an extensive library of compounds due to its highly selective response toward GSH, and it has an advantage over other probes because the rosamine dye exhibits high quantum yields and pH-insensitivity [181]. Recently, two probes, 47 and 48, were designed to have a ratiometric response upon reaction with biothiols. Probe 47 reacts with GSH and Cys to afford a ratiometric change in its excitation maximum from 434 to 404 nm while increasing its fluorescence emission at 480 nm [186]. A slight modification to the backbone produces probe 48, which experiences ratiometric changes to both its excitation and emission spectra upon reaction with GSH, Cys and Hcy [185]. Finally, probes 42–48 were all utilized in live cell imaging experiments, and probe 46 was the first to selectively image thiols within a living organism. Zebrafish embryos treated with 46 exhibited a strong fluorescence response except when pretreated with N-methylmaleimide, a thiol-reducing reagent [180].
Fig. 21.
Structures of thiol sensors based on nucleophilic substitution.
Complementary to the previous probing mechanism is a class of probes that undergo aromatic nucleophilic substitution. In some cases, this leads to cleavage of a nitrobenzenesulfonyl ring, and in others the thiol is added directly to the probe. Each example leads to an irreversible fluorescence emission increase. Although there are many in the literature, probes 49–54 (Fig. 22) are a few examples of this class of thiol-reactive probe. Probe 49 shows direct addition of the thiol onto the fluorophore backbone and is sensitive only to Cys and Hcy. GSH and other macromolecules produce no fluorescence increase reportedly because of steric hindrance [187]. Similarly, GSH induces little or no response for probes 50–52 and 54, although they rely on thiol reaction with a nitrobenzenesulfonyl group for activation. Interestingly, 50 uniquely displays a fluorescence response for the enzyme acetyl-cholinesterase over GSH and Cys through selective release of a resorufin dye [188]. Probes 51 and 52 show the greatest change in fluorescence intensity due to an ICT mechanism that renders them non-fluorescent in their unreacted forms (Φ = 0.003 and 0.0087, respectively) [189,190]. Similarly, probes 53 and 54 were recently developed to utilize a PET mechanism, which quenches their initial fluorescence and leads to dramatic 180- and 300-fold increases, respectively, in emission intensity after reaction with thiols [191,192]. This low background fluorescence and subsequent high fluorescence output is advantageous for easy detection during cellular imaging, and probes 50–54 were successfully used for intracellular thiol recognition in a variety of cell lines [188-192].
Fig. 22.
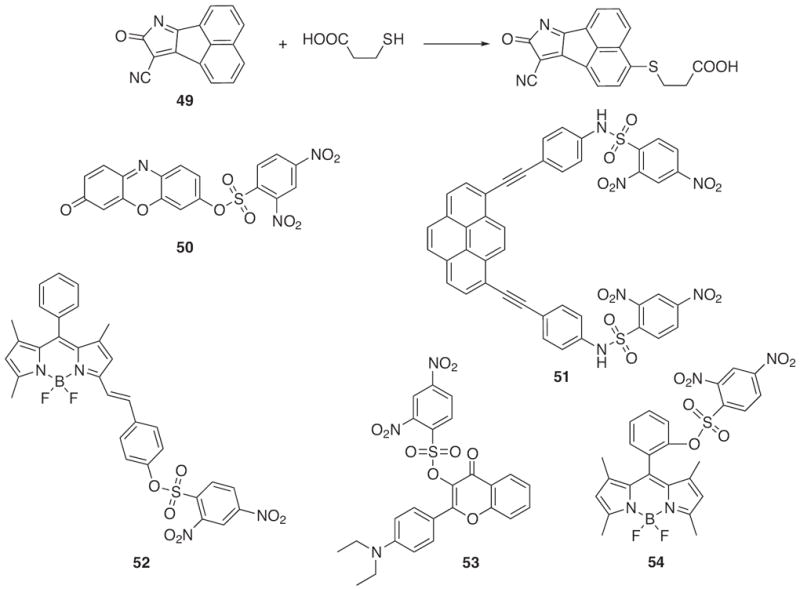
Structures of thiol sensors based on aromatic nucleophilic substitution.
Both the aromatic nucleophilic substitution and nucleophilic addition-based probes undergo irreversible reactions for the detection of thiols; however, these are unsuitable for measuring reductase activity and can potentially affect the redox homeostasis within a cell. To circumvent these problems, thiol probes 55–60 were prepared (Fig. 23). Each sensor relies on the reduction of a disulfide bond by intracellular thiols to elicit a change in its fluorescence read-out. The design of probes 55, 56 and 57 revolves around the basis of FRET where the initial fluorescence emission is from the longer wavelength acceptor fluorophore [193,194]. Cleavage of the disulfide bonds results in an increase of the donor fluorophore’s emission. This mechanism of action is reversible making it advantageous for the study of oxidation levels within a system. Probes 55 and 56 were applied to the in vivo analysis of thiols within zebrafish [193], whereas 57 was used in an assay to measure glutathione reductase activity [194]. Another example of a redox-responsive probe, 58, displays a ratiometric change to its emission spectra after interaction with GSH and Cys. Initially, the probe has an emission peak at 485 nm. Following incubation with GSH or Cys, the maximum emission peak red shifts to 533 nm due to cleavage of the disulfide bond and subsequent release of the carbamate linkage from 4-aminonaphthalimide [195]. Unlike, 55–57, probe 58’s reaction with thiols is irreversible, but is the first design to utilize ratiometric fluorescence detection. Probes 59 and 60 also undergo irreversible reactions with GSH and Cys but are of interest due to their ability to undergo two-photon excitation [196,197]. Probe 59 was utilized in both live HeLa cells and rat hippocampal slices to image biological thiols. The use of two-photon microscopy showed that the probe was capable of detecting thiols at depths of 90–180 μm within the live tissue. Building upon this design, the same group developed a separate ratiometric probe, 60 or SSH-Mito, which shows a shift in its emission maximum from 462 to 545 nm after reaction with GSH and Cys. It also contains a triphenylphosphonium group that targets it directly to the mitochondria. This probe allowed for direct visualization of GSH levels within the mitochondria of HeLa cells and in rat hippocampal tissue.
Fig. 23.
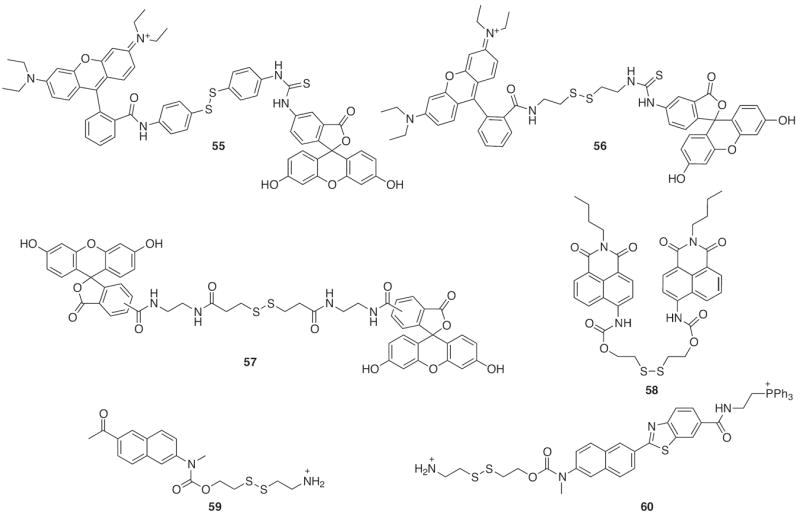
Structures of redox-based thiol sensors.
6. Multifunctional fluorescent sensors
All of the probes described in the previous sections for metal ions, ROS and intracellular thiols respond to just one species in an extremely complex set of events. However, because cellular events are often controlled by multiple factors, imaging one specific metal cation or intracellular molecule might not provide a clear picture of their cellular involvement. The creation of multifunctional or dualsignal sensors that react with two or more cellular species and could elucidate their relationship under a stressed system are therefore of high interest.
In this vein, a few multifunctional sensors have recently been developed that probe for the redox active metals Cu or Fe in the presence of H2O2 (Fig. 24). In each case, the sensors rely on a prochelator strategy that utilizes a boronate ester protecting group to prevent metal coordination prior to oxidation by H2O2. The selectivity of this strategy therefore resides in the reactivity-dependent activation of a prochelator to a chelator, and not on any inherent metal preference of the chelator itself. The Guo laboratory first introduced SBH-B-AN, which was an anthracene-appended version of their boronic acid prochelator, SBH [198]. The protected version showed no iron-binding capabilities and no changes to the fluorescence output. However, after reaction with H2O2, the emission bands of the chelator at 400 and 480 nm were ~30–40% quenched by the addition of Fe3+.
As a separate approach to this strategy, our group introduced FlamB [107]. Built upon the spirolactam framework found in several metal sensors described in previous sections, non-fluorescent FlamB is oxidized by H2O2 to its chelator form, FlamS, which itself exhibits a modest Cu2+-selective fluorescence turn-on response. However, it was also determined that a competing mechanism occurs in aqueous solution due to hydrolytic instability of the prochelator’s hydrazone backbone. One of FlamB’s hydrolysis products, fluorescein hydrazine, reacts with Cu2+ (see Scheme 1) or H2O2 to produce the highly fluorescent fluorescein. A very small amount of hydrolytic decomposition could therefore produce a fluorescence response that could be easily misinterpreted. Due to this alternate pathway for fluorescence turn-on within an aqueous environment, cell studies were not performed. Despite the instability of FlamB, the Guo laboratory reported a rhodamine derivative containing the same hydrazone prochelator backbone [199]. They showed that Rh-SBH (Fig. 24) produced a 7.5- or 5-fold turn-on in the presence of Cu2+ or Fe2+ and excess H2O2, respectively. In turn, Rh-SBH was applied to live SH-SY5Y neuroblastoma cells and showed increased fluorescence when incubated with excess Cu2+ or Fe3+ and H2O2.
The final example in this class of multifunctional sensors is FloB-SI [200]. We recently reported that this fluorescein-appended prochelator is stable to hydrolysis in aqueous solution and cell culture media, and undergoes fast deprotection with H2O2 through loss of its self-immolative pinacol boronic ester protecting group. Once converted to the chelator form, FloS, its emission intensity decreases by a dramatic 70% with Cu2+ or Fe3+, with more modest quenching in the presence of Zn2+, Co2+, or Ni2+ and no change with Na+ Ca2+, Mg2+ or Mn2+. Fluorescence microscopy studies in HeLa cells with FloB-SI showed that the sensor’s fluorescence intensity remained unchanged until incubation with exogenous H2O2, which caused the cellular fluorescence to dim. Incubation with a competitive chelator, SIH, restored the emission response, suggesting that FloB-SI was effectively reporting on an H2O2-induced increase in intracellular labilized metal, the most likely candidate being iron [200]. While these results are encouraging, the fluorescencequenching response mechanism and the poor photostability of the compounds indicate that more work remains to be done to optimize this class of multifunctional probes and use them to study the role of metal-mediated oxidative stress in neurodegenerative disease.
7. Conclusions
Utilization of a properly designed fluorescent sensor can provide unique information about cell biology, as has been the case most prominently since the introduction of the first calcium sensors. The demand for molecular sensors specific for other metal ions and for reactive small molecules continues to grow. This review focused on molecules that are relevant particularly to those interested in the role of metal ions in neurodegenerative diseases. The oxidative/reductive balance of a healthy vs. diseased cell will depend on the levels of ROS, thiols, and metal ions. As we saw in the previous sections, all of these species are potentially probed intracellularly by fluorescent molecules. Indeed, the creativity of chemists to build appropriate molecules is impressive, but there remain many challenges ahead before the promise of these agents is fully realized. Many of these challenges were highlighted in the “intricacies and complications” sections throughout the text. Increasing the sophistication of the chemistry used to design and build these agents is one pathway for improvement, but ultimately it will require a detailed understanding of how these reagents partition within a cell or tissue slice [201] and how their photophysical properties are altered under different cellular conditions.
Acknowledgments
We thank the US National Institutes of Health (GM084176) for funding our work in this area. KJF also acknowledges support from the Sloan Foundation and the Camille and Henry Dreyfus Foundation.
References
- 1.Barnham KJ, Masters CL, Bush AI. Nat Rev Drug Discov. 2004;3:205. doi: 10.1038/nrd1330. [DOI] [PubMed] [Google Scholar]
- 2.Halliwell B. J Neurochem. 2006;97:1634. doi: 10.1111/j.1471-4159.2006.03907.x. [DOI] [PubMed] [Google Scholar]
- 3.Valko M, Morris H, Cronin MTD. Curr Med Chem. 2005;12:1161. doi: 10.2174/0929867053764635. [DOI] [PubMed] [Google Scholar]
- 4.Lin MT, Beal MF. Nature. 2006;443:787. doi: 10.1038/nature05292. [DOI] [PubMed] [Google Scholar]
- 5.Winterbourn CC. Nat Chem Biol. 2008;4:278. doi: 10.1038/nchembio.85. [DOI] [PubMed] [Google Scholar]
- 6.Murphy MP, Holmgren A, Larsson N-G, Halliwell B, Chang CJ, Kalyanaraman B, Rhee SG, Thornalley PJ, Partridge L, Gems D, Nyström T, Belousov V, Schumacker PT, Winterbourn CC. Cell Metab. 2011;13:361. doi: 10.1016/j.cmet.2011.03.010. [DOI] [PMC free article] [PubMed] [Google Scholar]
- 7.Townsend DM, Tew KD, Tapiero H. Biomed Pharmacother. 2003;57:145. [Google Scholar]
- 8.Meister A, Anderson ME. Annu Rev Biochem. 1983;52:711. doi: 10.1146/annurev.bi.52.070183.003431. [DOI] [PubMed] [Google Scholar]
- 9.Cadet J, Douki T, Ravanat J-L. Free Radic Biol Med. 2010;49:9. doi: 10.1016/j.freeradbiomed.2010.03.025. [DOI] [PubMed] [Google Scholar]
- 10.Moreira PI, Nunomura A, Nakamura M, Takeda A, Shenk JC, Aliev G, Smith MA, Perry G. Free Radic Biol Med. 2008;4:1493. doi: 10.1016/j.freeradbiomed.2008.01.002. [DOI] [PubMed] [Google Scholar]
- 11.Prousek J. Pure Appl Chem. 2007;79(2314):2325. [Google Scholar]
- 12.Eide DJ. Metallomics. 2011;3:1124. doi: 10.1039/c1mt00064k. [DOI] [PubMed] [Google Scholar]
- 13.Lee S-J, Koh J-Y. Mol Brain. 2010;3:30. doi: 10.1186/1756-6606-3-30. [DOI] [PMC free article] [PubMed] [Google Scholar]
- 14.Davidson SM, Duchen MR. Cell Calcium. 2006;40:561. doi: 10.1016/j.ceca.2006.08.017. [DOI] [PubMed] [Google Scholar]
- 15.Ermak G, Davies KJA. Mol Immunol. 2002;38:713. doi: 10.1016/s0161-5890(01)00108-0. [DOI] [PubMed] [Google Scholar]
- 16.Bonda DJ, Lee HG, Blair JA, Zhu X, Perry G, Smith MA. Metallomics. 2011;3:267. doi: 10.1039/c0mt00074d. [DOI] [PMC free article] [PubMed] [Google Scholar]
- 17.Crichton R, Dexter D, Ward R. Monatsh Chem. 2011;142:341. [Google Scholar]
- 18.Crisponi G, Nurchi VM, Fanni D, Gerosa C, Nemolato S, Faa G. Coord Chem Rev. 2010;254:876. [Google Scholar]
- 19.Duce JA, Bush AI. Prog Neurobiol. 2010;92:1. doi: 10.1016/j.pneurobio.2010.04.003. [DOI] [PubMed] [Google Scholar]
- 20.Kell D. Arch Toxicol. 2010;84:825. doi: 10.1007/s00204-010-0577-x. [DOI] [PMC free article] [PubMed] [Google Scholar]
- 21.Lee DW, Andersen JK. J Neurochem. 2010;112:332. doi: 10.1111/j.1471-4159.2009.06470.x. [DOI] [PubMed] [Google Scholar]
- 22.Madsen E, Gitlin JD. Annu Rev Neurosci. 2007;30:317. doi: 10.1146/annurev.neuro.30.051606.094232. [DOI] [PubMed] [Google Scholar]
- 23.Sian-Hulsmann J, Mandel S, Youdim MB, Riederer P. J Neurochem. 2011;118:939. doi: 10.1111/j.1471-4159.2010.07132.x. [DOI] [PubMed] [Google Scholar]
- 24.Folk DS, Kielar F, Franz KJ. submitted for publication. [Google Scholar]
- 25.Gaggelli E, Kozlowski H, Valensin D, Valensin G. Chem Rev. 2006;106:1995. doi: 10.1021/cr040410w. [DOI] [PubMed] [Google Scholar]
- 26.Ilya B. Trends Mol Med. 2009;15:89. doi: 10.1016/j.molmed.2009.01.001. [DOI] [PMC free article] [PubMed] [Google Scholar]
- 27.Kalyanaraman B, Darley-Usmar V, Davies KJA, Dennery PA, Forman HJ, Grisham MB, Mann GE, Moore K, Roberts Ii LJ, Ischiropoulos H. Free Radic Biol Med. 2012;52:1. doi: 10.1016/j.freeradbiomed.2011.09.030. [DOI] [PMC free article] [PubMed] [Google Scholar]
- 28.Wardman P. Free Radic Biol Med. 2007;43:995. doi: 10.1016/j.freeradbiomed.2007.06.026. [DOI] [PubMed] [Google Scholar]
- 29.Fernandex-Suarez M, Ting AY. Nat Rev. 2008;9:929. doi: 10.1038/nrm2531. [DOI] [PubMed] [Google Scholar]
- 30.Haugland RP. The Handbook: A Guide to Fluorescent Probes and Labeling Technologies. 10. Invitrogen Corp.; 2005. [Google Scholar]
- 31.Lakowicz JR. Principles of Fluorescence Spectroscopy. 3. Springer Science + Business Media; New York: 2006. [Google Scholar]
- 32.Tsien RY. Biochemistry. 1980;19:2396. doi: 10.1021/bi00552a018. [DOI] [PubMed] [Google Scholar]
- 33.Paredes RM, Etzler JC, Watts LT, Zheng W, Lechleiter JD. Methods. 2008;46:143. doi: 10.1016/j.ymeth.2008.09.025. [DOI] [PMC free article] [PubMed] [Google Scholar]
- 34.Abramov AY, Canevari L, Duchen MR. J Neurosci. 2004;24:565. doi: 10.1523/JNEUROSCI.4042-03.2004. [DOI] [PMC free article] [PubMed] [Google Scholar]
- 35.Grynkiewicz G, Poenie M, Tsien RY. J Biol Chem. 1985;260:3440. [PubMed] [Google Scholar]
- 36.Poenie M, Alderton J, Tsien RY, Steinhardt RA. Nature. 1985;315:147. doi: 10.1038/315147a0. [DOI] [PubMed] [Google Scholar]
- 37.Burchiel SW, Edwards BS, Kuckuck FW, Lauer FT, Prossnitz ER, Ransom JT, Sklar LA. Methods. 2000;21:221. doi: 10.1006/meth.2000.1002. [DOI] [PubMed] [Google Scholar]
- 38.Wahl M, Lucherini MJ, Gruenstein E. Cell Calcium. 1990;11:487. doi: 10.1016/0143-4160(90)90081-5. [DOI] [PubMed] [Google Scholar]
- 39.Minta A, Kao JPY, Tsien RY. J Biol Chem. 1989;264:8171. [PubMed] [Google Scholar]
- 40.Eberhard M, Erne P. Biochem Biophys Res Commun. 1991;180:209. doi: 10.1016/s0006-291x(05)81278-1. [DOI] [PubMed] [Google Scholar]
- 41.Rochefort NL, Jia H, Konnerth A. Trends Mol Med. 2008;14:389. doi: 10.1016/j.molmed.2008.07.005. [DOI] [PubMed] [Google Scholar]
- 42.Göbel W, Helmchen F. Physiology. 2007;22:358. doi: 10.1152/physiol.00032.2007. [DOI] [PubMed] [Google Scholar]
- 43.Stork CJ, Li YV. J Neurosci. 2006;26:10430. doi: 10.1523/JNEUROSCI.1588-06.2006. [DOI] [PMC free article] [PubMed] [Google Scholar]
- 44.Devinney MJ, 2nd, Reynolds IJ, Dineley KE. Cell Calcium. 2005;37:225. doi: 10.1016/j.ceca.2004.10.003. [DOI] [PubMed] [Google Scholar]
- 45.Sensi SL, Paoletti P, Bush AI, Sekler I. Nat Rev Neurosci. 2009;10:780. doi: 10.1038/nrn2734. [DOI] [PubMed] [Google Scholar]
- 46.Frederickson CJ, Koh J-Y, Bush AI. Nat Rev Neurosci. 2005;6:449. doi: 10.1038/nrn1671. [DOI] [PubMed] [Google Scholar]
- 47.Fraker PJ, King LE. Annu Rev Nutr. 2004;24:277. doi: 10.1146/annurev.nutr.24.012003.132454. [DOI] [PubMed] [Google Scholar]
- 48.Bush AI, Pettinell WH, Multhaup G, Paradis MD, Vonsattel J-P, Gusella JF, Beyreuther K, Masters CL, Tanzi RE. Science. 1994;265:1464. doi: 10.1126/science.8073293. [DOI] [PubMed] [Google Scholar]
- 49.Koh JY, Suh SW, Gwag BJ, He YY, Hsu CY, Choi DW. Science. 1996;272:1013. doi: 10.1126/science.272.5264.1013. [DOI] [PubMed] [Google Scholar]
- 50.Walker CF, Black RE. Annu Rev Nutr. 2004;24:255. doi: 10.1146/annurev.nutr.23.011702.073054. [DOI] [PubMed] [Google Scholar]
- 51.Domaille DW, Que EL, Chang CJ. Nat Chem Biol. 2008;4:168. doi: 10.1038/nchembio.69. [DOI] [PubMed] [Google Scholar]
- 52.Que EL, Domaille DW, Chang CJ. Chem Rev. 2008;108:1517. doi: 10.1021/cr078203u. [DOI] [PubMed] [Google Scholar]
- 53.Kikuchi K, Komatsu K, Nagano T. Curr Opin Chem Biol. 2004;8:182. doi: 10.1016/j.cbpa.2004.02.007. [DOI] [PubMed] [Google Scholar]
- 54.Thompson RB. Curr Opin Chem Biol. 2005;9:526. doi: 10.1016/j.cbpa.2005.08.020. [DOI] [PubMed] [Google Scholar]
- 55.Tomat E, Lippard SJ. Curr Opin Chem Biol. 2010;14:225. doi: 10.1016/j.cbpa.2009.12.010. [DOI] [PMC free article] [PubMed] [Google Scholar]
- 56.Walkup GK, Burdette SC, Lippard SJ, Tsien RY. J Am Chem Soc. 2000;122:5644. doi: 10.1021/ja010059l. [DOI] [PubMed] [Google Scholar]
- 57.Chang CJ, Nolan EM, Jaworski J, Burdette SC, Sheng M, Lippard SJ. Chem Biol. 2004;11:203. doi: 10.1016/j.chembiol.2004.01.017. [DOI] [PubMed] [Google Scholar]
- 58.Burdette SC, Frederickson CJ, Bu W, Lippard SJ. J Am Chem Soc. 2003;125:1778. doi: 10.1021/ja0287377. [DOI] [PubMed] [Google Scholar]
- 59.Ketterman JK, Li YV. J Neurosci Res. 2008;86:422. doi: 10.1002/jnr.21488. [DOI] [PubMed] [Google Scholar]
- 60.Frederickson CJ, Burdette SC, Frederickson CJ, Sensi SL, Weiss JH, Yin HZ, Balaji RV, Truong-Tran AQ, Bedell E, Prough DS, Lippard SJ. J Neurosci Methods. 2004;139:79. doi: 10.1016/j.jneumeth.2004.04.033. [DOI] [PubMed] [Google Scholar]
- 61.Hirano T, Kikuchi K, Urano Y, Higuchi T, Nagano T. J Am Chem Soc. 2000;122:12399. [Google Scholar]
- 62.Ueno S, Tsukamoto M, Hirano T, Kikuchi K, Yamada MK, Nishiyama N, Nagano T, Matsuki N, Ikegaya Y. J Cell Biol. 2002;158:215. doi: 10.1083/jcb.200204066. [DOI] [PMC free article] [PubMed] [Google Scholar]
- 63.Colvin RA, Fontaine CP, Thomas D, Hirano T, Nagano T, Kikuchi K. Arch Biochem Biophys. 2005;442:222. doi: 10.1016/j.abb.2005.08.013. [DOI] [PubMed] [Google Scholar]
- 64.Gee KR, Zhou Z-L, Ton-That D, Sensi SL, Weiss JH. Cell Calcium. 2002;31:245. doi: 10.1016/S0143-4160(02)00053-2. [DOI] [PubMed] [Google Scholar]
- 65.Wei Y, Fu D. J Biol Chem. 2005;280:33716. doi: 10.1074/jbc.M506107200. [DOI] [PubMed] [Google Scholar]
- 66.Bauer MC, Nilsson H, Thulin E, Frohm B, Malm J, Linse S. Protein Sci. 2008;17:760. doi: 10.1110/ps.073381108. [DOI] [PMC free article] [PubMed] [Google Scholar]
- 67.Nolan EM, Ryu JW, Jaworski J, Feazell RP, Sheng M, Lippard SJ. J Am Chem Soc. 2006;128:15517. doi: 10.1021/ja065759a. [DOI] [PMC free article] [PubMed] [Google Scholar]
- 68.Nolan EM, Lippard SJ. Inorg Chem. 2004;43:8310. doi: 10.1021/ic048778z. [DOI] [PubMed] [Google Scholar]
- 69.Komatsu K, Kikuchi K, Kojima H, Urano Y, Nagano T. J Am Chem Soc. 2005;127:10197. doi: 10.1021/ja050301e. [DOI] [PubMed] [Google Scholar]
- 70.MacDiarimid CW, Milanick MA, Eide DJ. J Biol Chem. 2003;278:15065. doi: 10.1074/jbc.M300568200. [DOI] [PubMed] [Google Scholar]
- 71.Meeusen JW, Tomasiewicz H, Nowakowski A, Petering DH. Inorg Chem. 2011;50:7563. doi: 10.1021/ic200478q. [DOI] [PMC free article] [PubMed] [Google Scholar]
- 72.Nowakowski AB, Petering DH. Inorg Chem. 2011;50:10124. doi: 10.1021/ic201076w. [DOI] [PMC free article] [PubMed] [Google Scholar]
- 73.Kim B-E, Nevitt T, Thiele DJ. Nat Chem Biol. 2008;4:176. doi: 10.1038/nchembio.72. [DOI] [PubMed] [Google Scholar]
- 74.Rapisarda VA, Volentini SI, Farias RN, Massa EM. Anal Biochem. 2002;307:105. doi: 10.1016/s0003-2697(02)00031-3. [DOI] [PubMed] [Google Scholar]
- 75.Yang L, McRae R, Henary MM, Patel R, Lai B, Vogt S, Fahrni C. Proc Natl Acad Sci U S A. 2005;102:11179. doi: 10.1073/pnas.0406547102. [DOI] [PMC free article] [PubMed] [Google Scholar]
- 76.Chaudhry AF, Verma M, Morgan MT, Henary MM, Siegel N, Hales JM, Perry JW, Fahrni CJ. J Am Chem Soc. 2010;132:737. doi: 10.1021/ja908326z. [DOI] [PMC free article] [PubMed] [Google Scholar]
- 77.Verma M, Chaudhry AF, Morgan MT, Fahrni CJ. Org Biomol Chem. 2010;8:363. doi: 10.1039/b918311f. [DOI] [PMC free article] [PubMed] [Google Scholar]
- 78.Zeng L, Miller EW, Pralle A, Isacoff EY, Chang CJ. J Am Chem Soc. 2006;128:10. doi: 10.1021/ja055064u. [DOI] [PMC free article] [PubMed] [Google Scholar]
- 79.Domaille DW, Zeng L, Chang CJ. J Am Chem Soc. 2010;132:1194. doi: 10.1021/ja907778b. [DOI] [PMC free article] [PubMed] [Google Scholar]
- 80.Dodani SC, Leary SC, Cobine PA, Winge DR, Chang CJ. J Am Chem Soc. 2011;133:8606. doi: 10.1021/ja2004158. [DOI] [PMC free article] [PubMed] [Google Scholar]
- 81.Dodani SC, Domaille DW, Nam CI, Miller EW, Finney LA, Vogt S, Chang CJ. Proc Natl Acad Sci U S A. 2011;108:5980. doi: 10.1073/pnas.1009932108. [DOI] [PMC free article] [PubMed] [Google Scholar]
- 82.Lim CS, Han JH, Kim CW, Kang MY, Kang DW, Cho BR. Chem Commun. 2011;47:7146. doi: 10.1039/c1cc11568e. [DOI] [PubMed] [Google Scholar]
- 83.Morgan MT, Bagchi P, Fahrni CJ. J Am Chem Soc. 2011;133:15906. doi: 10.1021/ja207004v. [DOI] [PMC free article] [PubMed] [Google Scholar]
- 84.Xiang Y, Tong A, Jin P, Ju Y. Org Lett. 2006;8:2863. doi: 10.1021/ol0610340. [DOI] [PubMed] [Google Scholar]
- 85.Zhou Y, Wang F, Kim Y, Kim S-J, Yoon J. Org Lett. 2009;11:4442. doi: 10.1021/ol901804n. [DOI] [PubMed] [Google Scholar]
- 86.Zhao M, Yang X-F, He S, Wang L. Sens Actuators B. 2009;135:625. [Google Scholar]
- 87.Swamy KMK, Ko S, Kwon SK, Lee HN, Mao C, Kim J, Lee K, Kim J, Shin I, Yoon J. Chem Commun. 2008;45:5915. doi: 10.1039/b814167c. [DOI] [PubMed] [Google Scholar]
- 88.Tang R, Lei K, Chen K, Zhao H, Chen J. J Fluoresc. 2011;21:141. doi: 10.1007/s10895-010-0698-x. [DOI] [PubMed] [Google Scholar]
- 89.Huang L, Chen F, Xi P, Xie G, Li Z, Shi Y, Xu M, Liu H, Ma Z, Bai D, Zeng Z. Dyes Pigments. 2011;90:265. [Google Scholar]
- 90.Zhao Y, Zhang X-B, Han Z-X, Qiao L, Li C-Y, Jian L-X, Shen G-L, Yu R-Q. Anal Chem. 2009;81:7022. doi: 10.1021/ac901127n. [DOI] [PubMed] [Google Scholar]
- 91.Huang L, Wang X, Xie G, Xi P, Li Z, Xu M, Wu Y, Bai D, Zeng Z. Dalton Trans. 2010;39:7894. doi: 10.1039/c0dt00606h. [DOI] [PubMed] [Google Scholar]
- 92.Xi P, Dou J, Huang L, Xu M, Chen F, Wu Y, Bai D, Li W, Zeng Z. Sens Actuators B. 2010;148:337. [Google Scholar]
- 93.Kroll H. J Am Chem Soc. 1952;74:2036. [Google Scholar]
- 94.Bender ML, Turnquest BW. J Am Chem Soc. 1957;79:1889. [Google Scholar]
- 95.Dujols V, Ford F, Czarnik AW. J Am Chem Soc. 1997;119:7386. [Google Scholar]
- 96.Chen X, Ma H. Anal Chim Acta. 2006;575:217. doi: 10.1016/j.aca.2006.05.097. [DOI] [PubMed] [Google Scholar]
- 97.Xie P, Guo F, Li D, Liu X, Liu L. J Lumin. 2011;131:104. [Google Scholar]
- 98.Yu M, Shi M, Chen Z, Li F, Li X, Gao Y, Xu J, Yang H, Zhou Z, Yi T, Huang C. Chem Eur J. 2008;14:6892. doi: 10.1002/chem.200800005. [DOI] [PubMed] [Google Scholar]
- 99.Kim MH, Jang HH, Yi S, Chang S-K, Han MS. Chem Commun. 2009:4838. doi: 10.1039/b908638b. [DOI] [PubMed] [Google Scholar]
- 100.Kierat RM, Krämer R. Bioorg Med Chem Lett. 2005;15:4824. doi: 10.1016/j.bmcl.2005.07.042. [DOI] [PubMed] [Google Scholar]
- 101.Yuan L, Lin W, Cao Z, Long L, Song J. Chem Eur J. 2011;17:689. doi: 10.1002/chem.201001923. [DOI] [PubMed] [Google Scholar]
- 102.Xu Z, Xiao Y, Qian X, Cui J, Cui D. Org Lett. 2005;7:889. doi: 10.1021/ol0473445. [DOI] [PubMed] [Google Scholar]
- 103.Xu Z, Qian X, Cui J. Org Lett. 2005;7:3029. doi: 10.1021/ol051131d. [DOI] [PubMed] [Google Scholar]
- 104.Huang J, Xu Y, Qian X. Org Biomol Chem. 2009;7:1299. doi: 10.1039/b818611a. [DOI] [PubMed] [Google Scholar]
- 105.Singh N, Kaur N, McCaughan B, Callan JF. Tetrahedron Lett. 2010;51:3385. [Google Scholar]
- 106.Chartres JD, Busby M, Riley MJ, Davis JJ, Bernhardt PV. Inorg Chem. 2011;50:9178. doi: 10.1021/ic201495r. [DOI] [PubMed] [Google Scholar]
- 107.Hyman LM, Stephenson CJ, Dickens MG, Shimizu KD, Franz KJ. Dalton Trans. 2010;39:568. doi: 10.1039/b914568k. [DOI] [PMC free article] [PubMed] [Google Scholar]
- 108.Kell D. BMC Med Genomics. 2009;2:2. doi: 10.1186/1755-8794-2-2. [DOI] [PMC free article] [PubMed] [Google Scholar]
- 109.Andrews NC, Schmidt PJ. Annu Rev Physiol. 2007;69:69. doi: 10.1146/annurev.physiol.69.031905.164337. [DOI] [PubMed] [Google Scholar]
- 110.Esposito BP, Epsztejn S, Breuer W, Cabantchik ZI. Anal Biochem. 2002;304:1. doi: 10.1006/abio.2002.5611. [DOI] [PubMed] [Google Scholar]
- 111.Breuer W, Epsztejn S, Cabantchik ZI. FEBS Lett. 1996;382:304. doi: 10.1016/0014-5793(96)00190-1. [DOI] [PubMed] [Google Scholar]
- 112.Petrat F, de Groot H, Rauen U. Biochem J. 2001;356:61. doi: 10.1042/0264-6021:3560061. [DOI] [PMC free article] [PubMed] [Google Scholar]
- 113.Pourzand C, Watkin RH, Brown JE, Tyrrell RM. Proc Natl Acad Sci U S A. 1999;96:6751. doi: 10.1073/pnas.96.12.6751. [DOI] [PMC free article] [PubMed] [Google Scholar]
- 114.Cairo G, Tacchini L, Polgliaghi G, Anzon E, Tomasi A, Bernelli-Zazzera A. J Biol Chem. 1995;270:700. doi: 10.1074/jbc.270.2.700. [DOI] [PubMed] [Google Scholar]
- 115.Breuer W, Epsztejn S, Millgram P, Cabantchik IZ. Am J Physiol. 1995;268:C1354. doi: 10.1152/ajpcell.1995.268.6.C1354. [DOI] [PubMed] [Google Scholar]
- 116.Breuer W, Epsztejn S, Cabantchik ZI. J Biol Chem. 1995;270:24209. doi: 10.1074/jbc.270.41.24209. [DOI] [PubMed] [Google Scholar]
- 117.Thomas F, Serratrice G, Beguin C, Saint Aman E, Pierre JL, Fontecave M, Laulhere JP. J Biol Chem. 1999;274:13375. doi: 10.1074/jbc.274.19.13375. [DOI] [PubMed] [Google Scholar]
- 118.Hasinoff BB. J Inorg Biochem. 2003;95:157. doi: 10.1016/s0162-0134(03)00099-0. [DOI] [PubMed] [Google Scholar]
- 119.Petrat F, Rauen U, Groot HD. Hepatology. 1999;29:1171. doi: 10.1002/hep.510290435. [DOI] [PubMed] [Google Scholar]
- 120.Chen J-L, Zhuo S-J, Wu Y-Q, Fang F, Li L, Zhu C-Q. Spectrochim Acta A. 2006;63:438. doi: 10.1016/j.saa.2005.04.057. [DOI] [PubMed] [Google Scholar]
- 121.Praveen L, Reddy MLP, Varma RL. Tetrahedron Lett. 2010;51:6626. [Google Scholar]
- 122.Kikkeri R, Traboulsi H, Humbert N, Gumienna-Kontecka E, Arad-Yellin R, Melman G, Elhabiri M, Albrecht-Gary AM, Shanzer A. Inorg Chem. 2007;46:2485. doi: 10.1021/ic061952u. [DOI] [PubMed] [Google Scholar]
- 123.Palanche T, Marmolle F, Abdallah MA, Shanzer A, Albrecht-Gary AM. J Biol Inorg Chem. 1999;4:188. doi: 10.1007/s007750050304. [DOI] [PubMed] [Google Scholar]
- 124.Ghosh S, Dey CK, Manna R. Tetrahedron Lett. 2010;51:3177. [Google Scholar]
- 125.Fan LJ, Jones WE. J Am Chem Soc. 2006;128:6784. doi: 10.1021/ja0612697. [DOI] [PMC free article] [PubMed] [Google Scholar]
- 126.Chung Chun Lam CKS, Jickells TD, Richardson DJ, Russell DA. Anal Chem. 2006;78:5040. doi: 10.1021/ac060223t. [DOI] [PubMed] [Google Scholar]
- 127.Lytton SD, Mester B, Libman J, Shanzer A, Cabantchik ZI. Anal Biochem. 1992;205:326. doi: 10.1016/0003-2697(92)90443-b. [DOI] [PubMed] [Google Scholar]
- 128.Singh N, Kaur N, Callan JF. J Fluoresc. 2009;19:649. doi: 10.1007/s10895-008-0457-4. [DOI] [PubMed] [Google Scholar]
- 129.Ma Y, Luo W, Quinn PJ, Liu Z, Hider RC. J Med Chem. 2004;47:6349. doi: 10.1021/jm049751s. [DOI] [PubMed] [Google Scholar]
- 130.Fakih S, Podinovskaia M, Kong X, Schaible UE, Collins HL, Hider RC. J Pharm Sci. 2009;98:2212. doi: 10.1002/jps.21583. [DOI] [PubMed] [Google Scholar]
- 131.Fakih S, Podinovskaia M, Kong X, Collins HL, Schaible UE, Hider RC. J Med Chem. 2008;51:4539. doi: 10.1021/jm8001247. [DOI] [PubMed] [Google Scholar]
- 132.Lohani CR, Kim J-M, Lee K-H. Bioorg Med Chem. 2009;19:6069. doi: 10.1016/j.bmcl.2009.09.036. [DOI] [PubMed] [Google Scholar]
- 133.Zhang M, Gao Y, Li M, Yu M, Li F, Li L, Zhu M, Zhang J, Yi T, Huang C. Tetrahedron Lett. 2007;48:3709. [Google Scholar]
- 134.Bae S, Tae J. Tetrahedron Lett. 2007;48:5389. [Google Scholar]
- 135.Dong L, Wu C, Zeng X, Xue S-F, Tao Z, Zhang J-X. Sens Actuators B. 2010;145:433. [Google Scholar]
- 136.Zhang L, Fan J, Peng X. Spectrochim Acta A. 2009;73:398. doi: 10.1016/j.saa.2009.02.045. [DOI] [PubMed] [Google Scholar]
- 137.Lee MH, Giap TV, Kim SH, Lee YH, Kang C, Kim JS. Chem Commun. 2010;46:1407. doi: 10.1039/b921526c. [DOI] [PubMed] [Google Scholar]
- 138.Weerasinghe AJ, Schmiesing C, Varaganti S, Ramakrishna G, Sinn E. J Phys Chem. 2010;114:9413. doi: 10.1021/jp1034568. [DOI] [PubMed] [Google Scholar]
- 139.Xiang Y, Tong A. Org Lett. 2006;8:1549. doi: 10.1021/ol060001h. [DOI] [PubMed] [Google Scholar]
- 140.Hua J, Wang Y-G. Chem Lett. 2005;34:98. [Google Scholar]
- 141.Bricks JL, Kovalchuk A, Trieflinger C, Nofz M, Buschel M, Tolmachev AI, Daub J, Rurack J. J Am Chem Soc. 2005;127:13522. doi: 10.1021/ja050652t. [DOI] [PubMed] [Google Scholar]
- 142.Kennedy DP, Incarvito CD, Burdette SC. Inorg Chem. 2010;49:916. doi: 10.1021/ic901182c. [DOI] [PubMed] [Google Scholar]
- 143.Zhang H-M, Fu W-F, Chi S-M, Wang J. J Lumin. 2009;129:589. [Google Scholar]
- 144.Lin W, Long L, Yuan L, Cao Z, Feng J. Anal Chim Acta. 2009;634:262. doi: 10.1016/j.aca.2008.12.049. [DOI] [PubMed] [Google Scholar]
- 145.Jung JH, Singh N, Jang DO. Tetrahedron Lett. 2008;49:2960. [Google Scholar]
- 146.Dickinson BC, Chang CJ. Nat Chem Biol. 2011;7:504. doi: 10.1038/nchembio.607. [DOI] [PMC free article] [PubMed] [Google Scholar]
- 147.Wiseman H, Halliwell B. Biochem J. 1996;313:17. doi: 10.1042/bj3130017. [DOI] [PMC free article] [PubMed] [Google Scholar]
- 148.Levine RL. Free Radic Biol Med. 2002;32:790. doi: 10.1016/s0891-5849(02)00765-7. [DOI] [PubMed] [Google Scholar]
- 149.Davies MJ, Fu S, Wang H, Dean RT. Free Radic Biol Med. 1999;27:1151. doi: 10.1016/s0891-5849(99)00206-3. [DOI] [PubMed] [Google Scholar]
- 150.Afzal M, Matsugo S, Sasai M, Xu B, Aoyama K, Takeuchi T. Biochem Biophys Res Commun. 2003;304:619. doi: 10.1016/s0006-291x(03)00641-7. [DOI] [PubMed] [Google Scholar]
- 151.Rota C, Chignell CF, Mason RP. Free Radic Biol Med. 1999;27:873. doi: 10.1016/s0891-5849(99)00137-9. [DOI] [PubMed] [Google Scholar]
- 152.Zielonka J, Kalyanaraman B. Free Radic Biol Med. 2010;48:983. doi: 10.1016/j.freeradbiomed.2010.01.028. [DOI] [PMC free article] [PubMed] [Google Scholar]
- 153.Setsukinai K-I, Urano Y, Kakinuma K, Majima HJ, Nagano T. J Biol Chem. 2003;278:3170. doi: 10.1074/jbc.M209264200. [DOI] [PubMed] [Google Scholar]
- 154.Page SE, Wilke KT, Pierre VC. Chem Commun. 2010;46 doi: 10.1039/b923912j. [DOI] [PubMed] [Google Scholar]
- 155.D’Autreaux B, Toledano MB. Nat Rev Mol Cell Biol. 2007;8:813. doi: 10.1038/nrm2256. [DOI] [PubMed] [Google Scholar]
- 156.Giorgio M, Trinei M, Migliaccio E, Pelicci PG. Nat Rev Mol Cell Biol. 2007;8 doi: 10.1038/nrm2240. [DOI] [PubMed] [Google Scholar]
- 157.Janssen-Heininger YM, Mossman BT, Heintz NH, Forman HJ, Kalyanaraman B, Finkel T, Stamler JS, Rhe SG, van der Vliet A. Free Radic Biol Med. 2008;45:1. doi: 10.1016/j.freeradbiomed.2008.03.011. [DOI] [PMC free article] [PubMed] [Google Scholar]
- 158.Rhee SG. Science. 2006;312:1882. doi: 10.1126/science.1130481. [DOI] [PubMed] [Google Scholar]
- 159.Bedard K, Krause K-H. Physiol Rev. 2007;87:245. doi: 10.1152/physrev.00044.2005. [DOI] [PubMed] [Google Scholar]
- 160.Rossi DJ, Jamieson CHM, Weissman IL. Cell. 2008;13:681. doi: 10.1016/j.cell.2008.01.036. [DOI] [PubMed] [Google Scholar]
- 161.Ishikawa K, Takenaga K, Akimoto M, Koshikawa N, Yamaguchi A, Imanishi H, Nakada K, Honma Y, Hayahi J-I. Science. 2008;661:661. doi: 10.1126/science.1156906. [DOI] [PubMed] [Google Scholar]
- 162.Maeda H, Fukuyasu Y, Yoshida S, Fukuda M, Saeki K, Matsuno H, Yamauchi Y, Yoshida K, Hirata K, Miyamoto K. Angew Chem Int Ed. 2004;43:2389. doi: 10.1002/anie.200452381. [DOI] [PubMed] [Google Scholar]
- 163.Lo L-C, Chu C-Y. Chem Commun. 2003:2728. doi: 10.1039/b309393j. [DOI] [PubMed] [Google Scholar]
- 164.Abo M, Urano Y, Hanaoka K, Terai T, Komatsu T, Nagano T. J Am Chem Soc. 2011;133:10629. doi: 10.1021/ja203521e. [DOI] [PubMed] [Google Scholar]
- 165.Soh N, Sakawaki O, Makihara K, Odo Y, Fukaminato T, Kawai T, Irie M, Imato T. Bioorg Med Chem. 2005;13:1131. doi: 10.1016/j.bmc.2004.11.023. [DOI] [PubMed] [Google Scholar]
- 166.Chang MCY, Pralle A, Isacoff EY, Chang CJ. J Am Chem Soc. 2004;126:15393. doi: 10.1021/ja0441716. [DOI] [PMC free article] [PubMed] [Google Scholar]
- 167.Miller EW, Albers AE, Pralle A, Isacoff EY, Chang CJ. J Am Chem Soc. 2005;127:16652. doi: 10.1021/ja054474f. [DOI] [PMC free article] [PubMed] [Google Scholar]
- 168.Miller EW, Tulyathan O, Isacoff EY, Chang CJ. Nat Chem Biol. 2007;3:263. doi: 10.1038/nchembio871. [DOI] [PubMed] [Google Scholar]
- 169.Dickinson BC, Huynh C, Chang CJ. J Am Chem Soc. 2010;132:5906. doi: 10.1021/ja1014103. [DOI] [PMC free article] [PubMed] [Google Scholar]
- 170.Sikora A, Zielonka J, Lopez M, Joseph J, Kalyanaraman B. Free Radic Biol Med. 2009;47:1401. doi: 10.1016/j.freeradbiomed.2009.08.006. [DOI] [PMC free article] [PubMed] [Google Scholar]
- 171.Albers AE, Okreglak VS, Chang CJ. J Am Chem Soc. 2006;128:9640. doi: 10.1021/ja063308k. [DOI] [PubMed] [Google Scholar]
- 172.Srikun D, Miller EW, Domaille DW, Chang CJ. J Am Chem Soc. 2008;130:4596. doi: 10.1021/ja711480f. [DOI] [PubMed] [Google Scholar]
- 173.Dickinson BC, Chang CJ. J Am Chem Soc. 2008;130:9638. doi: 10.1021/ja802355u. [DOI] [PMC free article] [PubMed] [Google Scholar]
- 174.Hassan SSM, Rechnitz GA. J Am Chem Soc. 1982;54:1972. [Google Scholar]
- 175.Dalton TP, Shertzer HD, Puga A. Annu Rev Pharmacol Toxicol. 1999;39:67. doi: 10.1146/annurev.pharmtox.39.1.67. [DOI] [PubMed] [Google Scholar]
- 176.Rahman I, MacNee W. Free Radic Biol Med. 2000;28:1405. doi: 10.1016/s0891-5849(00)00215-x. [DOI] [PubMed] [Google Scholar]
- 177.Seshardi S, Beiser A, Selhub J, Jacques PF, Rosenberg IH, D’Agostino RB, Wilson PWF, Wolf PA. N Engl J Med. 2002;346:476. doi: 10.1056/NEJMoa011613. [DOI] [PubMed] [Google Scholar]
- 178.Refsum H, Ueland PM, Nygard O, Vollset SE. Annu Rev Med. 1998;49:31. doi: 10.1146/annurev.med.49.1.31. [DOI] [PubMed] [Google Scholar]
- 179.Kanaoka Y, Machida M, Ando K, Sekine T. Biochim Biophys Acta. 1970;207:269. doi: 10.1016/0005-2795(70)90019-x. [DOI] [PubMed] [Google Scholar]
- 180.Chen X, Ko S-K, Kim MJ, Shin I, Yoon J. Chem Commun. 2010;46:2751. doi: 10.1039/b925453f. [DOI] [PubMed] [Google Scholar]
- 181.Ahn Y-H, Lee J-S, Chang Y-T. J Am Chem Soc. 2007;129:4510. doi: 10.1021/ja068230m. [DOI] [PubMed] [Google Scholar]
- 182.Yi L, Li H, Sun L, Liu L, Zhang C, Xi Z. Angew Chem Int Ed. 2009;48:4034. doi: 10.1002/anie.200805693. [DOI] [PubMed] [Google Scholar]
- 183.Jung HS, Ko KC, Kim G-H, Lee A-R, Na Y-C, Kang C, Lee JY, Kim JS. Org Lett. 2011;13:1498. doi: 10.1021/ol2001864. [DOI] [PubMed] [Google Scholar]
- 184.Kwon H, Lee K, Kim H-J. Chem Commun. 2011;47:1773. doi: 10.1039/c0cc04092d. [DOI] [PubMed] [Google Scholar]
- 185.Kim G-J, Lee K, Kwon H, Kim H-J. Org Lett. 2011;13:2799. doi: 10.1021/ol200967w. [DOI] [PubMed] [Google Scholar]
- 186.Lim S-Y, Lee S, Park SB, Kim H-J. Tetrahedron Lett. 2011;52:3902. [Google Scholar]
- 187.Zhang M, Yu M, Li F, Zhu M, Li M, Gao Y, Li L, Liu Z, Zhang J, Zhang D, Yi T, Huang C. J Am Chem Soc. 2007;129:10322. doi: 10.1021/ja073140i. [DOI] [PubMed] [Google Scholar]
- 188.Cui K, Chen Z, Wang Z, Zhang G, Zhang D. Analyst. 2011;136:191. doi: 10.1039/c0an00456a. [DOI] [PubMed] [Google Scholar]
- 189.Ji S, Yang J, Yang Q, Liu S, Chen M, Zhao J. J Org Chem. 2009;74:4855. doi: 10.1021/jo900588e. [DOI] [PubMed] [Google Scholar]
- 190.Shao J, Guo H, Ji S, Zhao J. Biosens Bioelectron. 2011;26:3012. doi: 10.1016/j.bios.2010.12.004. [DOI] [PubMed] [Google Scholar]
- 191.Lan M, Wu J, Liu W, Zhang H, Zhang W, Zhuang X, Wang P. Sens Actuators B. 2011;156:332. [Google Scholar]
- 192.Guo H, Jing Y, Yuan X, Ji S, Zhao J, Li X, Kan Y. Org Biomol Chem. 2011;9:3844. doi: 10.1039/c0ob00910e. [DOI] [PubMed] [Google Scholar]
- 193.Pullela PK, Chiku T, Carvan MJ, Sem DS. Anal Biochem. 2006;352:265. doi: 10.1016/j.ab.2006.01.047. [DOI] [PubMed] [Google Scholar]
- 194.Piggott AM, Karuso P. Anal Chem. 2007;79:8769. doi: 10.1021/ac071518p. [DOI] [PubMed] [Google Scholar]
- 195.Zhu B, Zhang X, Li Y, Wang P, Zhang H, Zhuang X. Chem Commun. 2010;46:5710. doi: 10.1039/c0cc00477d. [DOI] [PubMed] [Google Scholar]
- 196.Lee JH, Lim CS, Tian YS, Han JH, Cho BR. J Am Chem Soc. 2010;132:1216. doi: 10.1021/ja9090676. [DOI] [PubMed] [Google Scholar]
- 197.Lim CS, Masanta G, Kim HJ, Han JH, Kim HM, Cho BR. J Am Chem Soc. 2011;133:11132. doi: 10.1021/ja205081s. [DOI] [PubMed] [Google Scholar]
- 198.Wei Y, Guo M. Chem Commun. 2009:1413. doi: 10.1039/b819204a. [DOI] [PMC free article] [PubMed] [Google Scholar]
- 199.Wei Y, Zhang Y, Guo M. Chem Commun. 2010;46:4472. doi: 10.1039/c000254b. [DOI] [PMC free article] [PubMed] [Google Scholar]
- 200.Hyman LM, Franz KJ. Inorg Chim Acta. 2012;380:125. doi: 10.1016/j.ica.2011.11.056. [DOI] [PMC free article] [PubMed] [Google Scholar]
- 201.Kay AR, Rumschik SM. Metallomics. 2011;3:829. doi: 10.1039/c1mt00024a. [DOI] [PubMed] [Google Scholar]