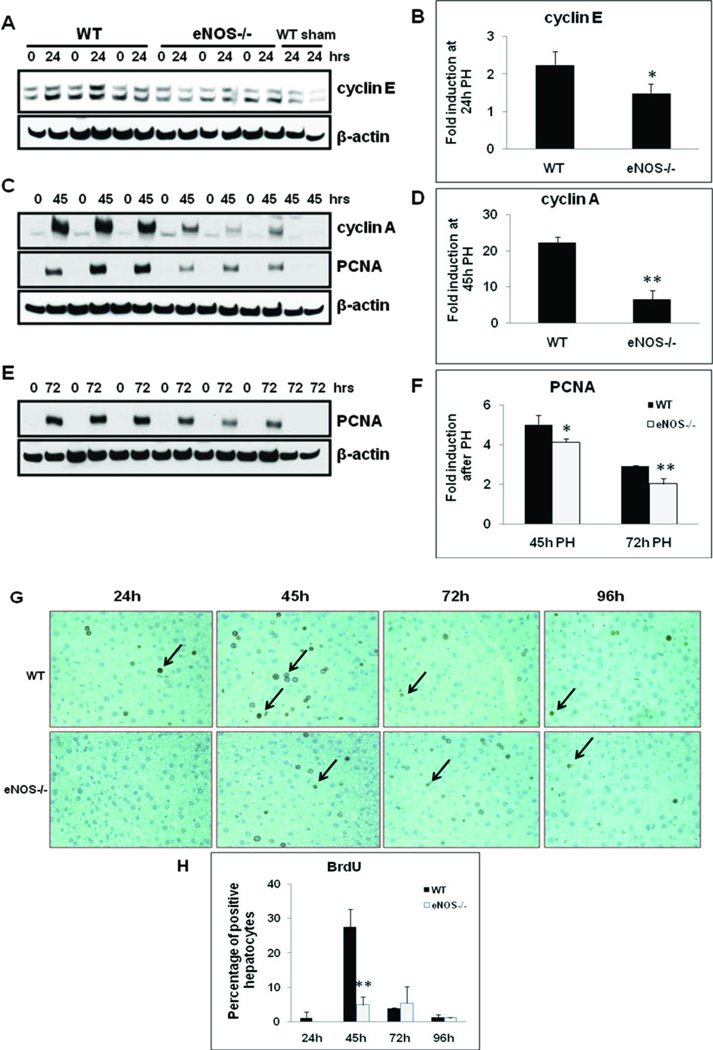
Fig. 2. Impaired hepatocyte cell cycle progression and proliferation in eNOS−/−.
Nuclear protein extracts (20 µg) obtained from livers of WT and eNOS−/− mice subjected to PH were analyzed by Western blotting for (A) cyclin E at 24h; (C) cyclin A and PCNA at 45h; (E) PCNA at 72h. (B, D, F) Fold induction as compared to WT sham at respective timepoints; Data represents mean+/− SD. *P < 0.05; **P < 0.01, vs WT; (G) BrdU immunostaining of liver sections obtained at 24–96h post-PH; (H) BrdU-positive hepatocytes expressed as a percentage of total hepatocytes, by counting 10 high-power fields (40X) of each slide, five animals per group. Data represents mean ± SD, **P < 0.01 versus WT.

