

Abstract
Through decades of research, neuroscientists and clinicians have identified an array of brain areas that each activate when a person views a certain category of stimuli. However, we do not have a detailed understanding of how the brain represents individual stimuli within a category. Here we used direct human brain recordings and machine-learning algorithms to characterize the distributed patterns that distinguish specific cognitive states. Epilepsy patients with surgically implanted electrodes performed a working-memory task and we used machine-learning algorithms to predict the identity of each viewed stimulus. We found that the brain’s representation of stimulus-specific information is distributed across neural activity at multiple frequencies, electrodes, and timepoints. Stimulus-specific neuronal activity was most prominent in the high-gamma (65–128 Hz) and theta/alpha (4–16 Hz) bands, but the properties of these signals differed significantly between individuals and for novel stimuli compared to common ones. Our findings show that the brain distinguishes specific cognitive states by diverse spatiotemporal patterns of neuronal activity, which is helpful for understanding the neural basis of memory and developing brain–computer interfaces.
Keywords: Electrocorticography, machine learning, visual perception, working memory
Introduction
Over the last century, neuroscientists have made dramatic progress towards understanding the patterns of human brain activity that encode the properties of cognitive representations. Whereas early work suggested that all memory representations are stored in a fully distributed manner (Lashley, 1950; Přibram, 1991), modern studies show that the human brain has a modular organization, such that neuronal activity in different regions represents separate classes of cognitive information (Warrington and Shallice, 1984; Mitchell et al., 2008; Farah and McClelland, 1991). This work has identified a number of brain regions where large-scale neuronal activations occur when people process specific categories of information, such as faces (Kanwisher et al., 1997), scenes (Epstein et al., 1999), and animals (Martin et al., 1996), among many others (Mitchell et al., 2008).
In addition to category-wide neuronal patterns, an important additional question concerns how the brain differentiates individual memories within a category. Although human neuroscience studies have traditionally not focused on characterizing specific cognitive states, there is emerging evidence that individual neuronal network states can be probed using direct human brain recordings (Quian Quiroga et al., 2005; Jacobs and Kahana, 2009; Chang et al., 2010; Manning et al., 2012; Morton et al., In press). Here our work uses electrocorticographic (ECoG) recordings from electrodes implanted directly on the cortical surface of epilepsy patients undergoing invasive monitoring. ECoG electrodes directly measure the aggregate activity of small neuronal populations with high temporal and spatial resolutions. This makes them useful for measuring neural correlates of specific cognitive states, which might be represented by detailed spatiotemporal patterns of neuronal activity. ECoG is further useful because it simultaneously measures neural activity at multiple frequencies, which is important because neural oscillations at different frequencies are linked to distinct physiological processes (Buzsáki, 2006).
Although research suggests that the brain utilizes distributed patterns, most traditional neuroscience research uses univariate statistical methods, which are incapable of fully quantifying distributed signals. Here we instead use multivariate machine-learning algorithms, which have recently emerged as a powerful technique for identifying and characterizing distributed neural representations. Machine learning methods have most often been used to probe brain data that were recorded noninvasively, such as functional magnetic resonance imaging (Haxby et al., 2001; Cox and Savoy, 2003; Norman et al., 2006; Haynes and Rees, 2006; Kriegeskorte and Kreiman, 2012; Kamitani and Tong, 2005), electroencephalography (Simanova et al., 2010; Murphy et al., 2011) and magnetoencephalography (Rieger et al., 2008; Chan et al., 2011). By utilizing machine-learning techniques in conjunction with ECoG data, our work aims to bring a new level of detail to our understanding of how the brain represents individual cognitive states.
We analyzed ECoG recordings from patients performing a working-memory task where they memorize each of the letters in a short list (Sternberg, 1966). Previously we showed that the amplitude of ECoG activations at 65–128 Hz at individual electrodes distinguished specific memory items (Jacobs and Kahana, 2009). Here, we extend this work to characterize the spectral, spatial, and temporal distribution of each stimulus’s ECoG pattern. To foreshadow our main results, we successfully used machine-learning algorithms to decode the identities of individual viewed letters using patterns of neuronal activity distributed across space, time, and frequency. This provides a successful demonstration of using ECoG “mind reading” to decode a person’s specific brain state. Further, we scrutinized the machine-learning model computed for each patient to reveal the types of neural signals that distinguish individual cognitive states. Our results show that individual stimuli are represented by ECoG signals at a range of frequencies, with prominent contributions by signals in the theta/alpha (4–16 Hz) and high-gamma (65–128 Hz) bands.
Methods
Patients
We analyzed data from 59 patients undergoing invasive monitoring as treatment for drug-resistant epilepsy. Each patient performed between one and ten testing sessions. We excluded 16 patients where we collected less than 30 trials per stimulus, leaving a total of 43 patients. Our research protocol was approved by the appropriate institutional review boards at several hospitals: Thomas Jefferson University Hospital (Philadelphia, PA), University of Pennsylvania (Philadelphia, PA), University Clinic (Freiburg, Germany), Children’s Hospital (Boston, MA), and Brigham and Women’s Hospital (Boston, MA). Informed consent was obtained from patients or their guardians.
Data acquisition
In each patient, we collected ECoG recordings from 15 to 160 electrodes. Electrode locations varied across patients due to the variations in each patient’s clinical needs, but there was an especially large number of electrodes in temporal cortex. Recording electrodes typically consisted of two configurations: grid and strip electrodes, which are placed on the surface of the neocortex, and depth electrodes, which penetrate through the cortex and record from deep brain structures like the hippocampus. Electrode locations were computed by coregistering a postoperative computed-tomography scan with a higher-resolution magnetic-resonance image and reported in units of Talairach coordinates (Talairach and Tournoux, 1988; Lancaster et al., 2000). ECoG activity was recorded at a sampling rate of 250–1024 Hz using Bio-Logic, XLTek, Neurofile, Nicolet, or Nihon Kohden recording systems, depending on the testing hospital. The recording from each electrode was re-referenced to the average of all signals from electrodes on the same grid, strip, or depth probe. ECoG recordings were synchronized with the patient’s task behavior via optically isolated synchronization pulses that were measured on a spare recording channel.
Task
During each ~45-min testing session, patients participated in a working-memory task on a bedside laptop computer (Sternberg, 1966). In each trial of the task, patients were presented with a list of one to six letters. During this presentation portion of the trial, first a fixation cross appeared, and then the letters were displayed sequentially on the computer screen. Each letter was on screen for 700 ms, followed by 275–350 ms (uniformly distributed) of blank screen, for a total of a 975–1050 ms interstimulus interval. Patients were instructed to closely attend to each stimulus presentation and to silently hold the identity of each item in memory. The letter lists included only consonants to prevent patients from using mnemonic strategies, such as treating each list as a single pronounceable word. After the presentation of each list, the response period began when a probe item was displayed after a ~2-s delay. Then patients responded by pressing a key to indicate whether the probe was present in the just-presented list or whether it was absent. After the key press, the computer indicated whether the response was correct, and then a new list was presented. Individual patients participated in different variations of the task, such that they viewed between 8 and 20 consonants. On average, across all sessions and trials, each patient viewed 584 stimulus presentations. In cases when a patient participated in multiple task sessions, we pooled data from multiple sessions together. We were unable to measure patients’ eye movements because of the limitations of the hospital testing environment, but we frequently reminded patients to fixate their gaze at the center of the laptop screen.
Data preprocessing
Because our goal was to characterize neural activity related to recognizing and memorizing the currently viewed letter, the data analyses presented here concern the presentation portion of each trial (Jacobs and Kahana, 2009). ECoG recordings were resampled to 500 Hz to provide consistency across different recording systems. We analyzed ECoG activity in the 0–800-ms time period after each letter presentation using the raw ECoG waveforms (time-domain representation) and the Hilbert envelope for different frequency bands and time windows (frequency-domain representation). For the time domain representation, recordings were down-sampled to 200 Hz, high-pass filtered at 5 Hz, and notch filtered using a zero-phase-distortion Butterworth filter at 60 Hz (United States) or 50 Hz (Europe) to remove power-line noise. The data were normalized relative to the 200-ms baseline period before each stimulus appearance and further down-sampled to 100 Hz. For the frequency domain representation, we separately analyzed the amplitude of the signal in the following bands: delta (2–4 Hz), theta (4–8 Hz), alpha (8–16 Hz), beta (16–30 Hz), low gamma (30–60 Hz), and high gamma (60–124 Hz). Amplitude measurements in each frequency band were obtained using bandpass filtering in conjunction with the Hilbert transform (Freeman, 2007). To perform this procedure, first we filtered the raw ECoG signal in each range using a second-order Butterworth bandpass filter. Next, we applied the Hilbert transform, which yields a complex number, and then took the absolute value to extract the instantaneous amplitude. We smoothed the amplitude measurement from each trial with a 100-ms boxcar filter to compensate for trial-to-trial jitter (Jacobs and Kahana, 2009).
Stimulus decoding
We were interested in testing whether we could reliably decode the identity of an individual viewed letter using simultaneous ECoG recordings and, if so, determining the types of brain signals that represent letter-related information. The task of determining which of many letters corresponds to a given neuronal pattern is an example of a multi-class classification problem. We converted this task into a series of two-class classification tasks, as these can be solved straightforwardly with various multivariate algorithms. Our algorithm that takes as input two possible letter identities and a multichannel ECoG recording from a patient viewing a letter in a trial of the task. The algorithm “decodes” the ECoG signal and outputs a predicted letter, which corresponds to its estimate of the letter that was most likely to be viewed in that recording. That is, given n letters, we solved a binary classification problem for each of the n(n – 1)/2 letter pairs. This allowed us to identify how well the members of each pair of letters could be distinguished on the basis of recorded electro-physiological activity. For each pair of letters, in each of the k subjects, we balanced the data such that we have an equal number of trials per letter. We then used a five-fold cross-validation technique in which a decoding model was fitted on 80% of the data and then its performance was tested on the remaining 20%. This was done using a subsampling procedure where each trial was randomly assigned to a particular fold, subject to the constraint that all letters are evenly represented. Decoding performance was averaged over folds.
For each trial, input to the decoding algorithm consisted of either the vectorized (K channels × 6 frequency bands × 8 time windows) frequency domain representation, the vectorized (K channels × 80 samples) time domain representation, or the concatenation of both. The time and frequency domain representations are not necessarily independent since event-related responses may show up as signal amplitude modulations as well as power modulations in low frequency bands. We considered the separate representations as well as their concatenation in order to ascertain how much stimulus-specific information is retained in either representation relative to the concatenated representation. On average, each concatenated input vector consisted of 9728 features (ranging from 1920 to 20480 features, varying according to the number of ECoG electrodes, K, in that patient).
We used elastic net logistic regression to classify the letter viewed in each trial (Zou and Hastie, 2005). Given a trial x = (x1,…,xp)T, the logistic regression model represents the probability of an outcome y ∈ {0, 1}, denoting two letters of interest, as a log-linear function of the p predictors. That is, and p(y = 0 | x) = 1 – p(y = 1 | x) where a is an offset and b = (b1,…,bp)T a vector of regression coeffcients. Given a training set , the elastic net logistic regression model was fitted by maximizing the penalized log-likelihood with log-likelihood
| (1) |
and elastic-net penalty
| (2) |
The regularization parameter λ controls the influence of the penalty term. The parameter α controls the relative contributions of a ridge penalty (obtained when α = 0) and a lasso penalty (obtained when α = 1). The ridge penalty typically works well when there is strong co-linearity between the predictors whereas the lasso penalty produces parsimonious models and thus performs automatic variable selection. The elastic net has been shown to inherit desirable properties of both penalization methods (Zou and Hastie, 2005; Carroll et al., 2009). Particularly, if a group of variables is both strongly correlated and highly predictive then the elastic net will select all members of that group. In contrast, the lasso will often select only one member of that group. This is important since we are interested in identifying a sparse set of features in the data that allow decoding while ensuring that no such predictive features are being ignored. The mixing parameter α is usually fixed by the user whereas the λ parameter is typically chosen such as to optimize decoding performance based on a nested cross-validation that operates only on the training data. In this paper, we chose α = 0.9, which should lead to the creation of sparse models that are robust in the presence of co-linearity, and used five-fold cross-validation to find the optimal value for λ for each patient. Elastic net logistic regression not only produces sparse, and therefore interpretable, decoding models but can also be trained very efficiently using a cyclical coordinate descent method (Friedman et al., 2010).
Quantification of decoding performance
We measured the decoding performance of each model by measuring the accuracy when the model was used to classify which of two letters correspond to a given ECoG signal. We used a binomial test to determine whether a particular letter comparison was significant. This test gives the probability of observing s or more correctly classified trials out of a total of N trials, given that the probability of a succesfull classification is 0.5. There are n(n – 1)/2 comparisons for each subject. The results for a particular subject are said to be significant under the binomial test if at least one of the letter comparisons is significant after a (conservative) Bonferroni correction. To determine which components of each patient’s ECoG signals contained useful information for letter decoding, we used the absolute value of the vector of regression coefficients b, averaged over cross-validation folds. In order to assess whether outcomes between different conditions were significantly different, we computed, for each subject, the log mean classification accuracy over letter pairs. We took only those pairs whose accuracy exceeded 0.55 in either one of the conditions, thereby ignoring chance level responses for particular letter pairs. We then used the difference between the log mean classification accuracy as input to a t-test. Differences were declared significant for p < 0.05, while correcting for multiple comparison.
Assessing interpatient differences in stimulus representations
We were interested in testing for differences in the types of neural signals that represent letters between individual patients. To examine this, after computing each patient’s letter-decoding model, we used a permutation procedure to quantitatively assess whether there are interpatient differences in the types of features, across time and frequency, that represent letter-related information. Some variations in the types of features that encode letter-related information are naturally expected due to random variations. Thus, this permutation procedure measured whether the apparent interpatient differences in the nature of letter representations were statistically robust.
We first summarized the features that represented stimulus-specific information in each patient by computing the patient’s spatiotemporal signature (STS). The STS summarizes the type of features that were used for decoding in each person. It is computed as the mean proportion of electrodes, at each timepoint and frequency, that have a significant feature for at least one letter classification. By comparing STS vectors between individuals, we tested the hypothesis that there are significant variations between the types of features that represent letter information in different patients’ brains. We tested for significant interpatient differences in STSs by computing our test statistic, which is the mean pairwise Euclidean distance across all possible combinations of STSs from different patients. To assess significance we calculated this same statistic using 1000 random surrogate datasets, in each of which we shuffled electrodes between patients and then we recomputed STSs. We then computed the p value for the entire procedure by measuring the rank of the true test statistic in the distribution of the random test statistics.
Results
Our main goal was to test whether we could identify neural patterns that differentiated the encoding of individual stimuli into memory. In the following, we describe decoding results and identify the types of neural signals—across time, frequency, and space—that contributed to the decoding.
Decoding performance
We used a regularized logistic-regression classifier to predict the letter viewed in each trial of the memory task for each of 43 subjects. The classifier was configured to predict each letter’s identity using both time- and frequency-domain ECoG signals. We successfully decoded the viewed letter at significantly above-chance levels in 18 subjects (42%; Figure 1A). We focus on this subset of the patients throughout the rest of this paper.
Figure 1.

Decoding results at the group level. A. Decoding performance over all significant subjects ordered according to minimal p values. The central mark in each box denotes the median classification accuracy. Edges of the box denote the 25th and 75th percentile. Whiskers extend to the most extreme datapoints not considered outliers. Outliers are plotted individually. Subjects 1 to 18 showed significant decoding performance (binomial test, p < 0.05, Bonferroni corrected for multiple comparisons). B. Letter decoding accuracy averaged over subjects that showed significant performance. Letters are ordered according to ascending frequency of occurrence, separately for German subjects (subjects 1–3, 11, 17 and 18) and English subjects (subjects 4–10 and 12–16). Black horizontal bars denote the average accuracy with which letters could be decoded from other letters.
To examine if there was a trend in which certain letters could be decoded especially well, we separately computed the mean decoding accuracy for each letter, averaged over subjects (Figure 1B). This analysis revealed that decodability was strongly dependent on letter identity. In order to gain more insight into this phenomenon, we analyzed data separately for German- and English-speaking patients, and ordered letters in each language according to their frequency of occurrence in the patient’s native language (Beutelspacher, 2005; Beker and Piper, 1982). Overall, rare letters could be discriminated more accurately than common letters (p < 0.05). This was established by splitting all letters into two groups according to their letter frequency, and comparing classification accuracy between these groups using a group-level binomial test. Notably, for German subjects, we found that the most infrequent letter, ‘Q,’ was especially discriminable. In general, the relatively increased discriminability of rare letters suggests that these novel stimuli are represented by distinctive patterns of ECoG activity (see Discussion).
Spectro–temporal characterization of the neural representations of letters
Next, we were interested in characterizing the types of ECoG signals that differentiated individual cognitive states. By examining the regression coefficients from the machine-learning models, it revealed the frequencies, time-points, and brain regions where ECoG activity is particularly informative for distinguishing individual stimuli.
Figure 2A characterizes the distribution of letter-related ECoG information in recordings from these patients, by showing the frequencies and timepoints where the decoding model estimated large regression coefficients, aggregating across electrodes, patients, and letters. Letter-specific information was most evident in ECoG signals at 200 to 300 ms after letter appearance. This is consistent with psychological studies showing that letter recognition has a latency on this timescale (Sternberg, 1969). In the frequency domain, we observed contributions of letter-related ECoG activity at various bands, but this activity peaked in the high-gamma (65–128 Hz) and theta/alpha (4–16 Hz) bands. There was a difference in the timecourses of letter-related theta/alpha and high-gamma activity, with letter-related theta/alpha activity lasting only until ~400 ms after letter onset whereas the high-gamma signals lasted until ~500 ms. Note that decoding performance in the delta band may have been reduced since these low-frequency power estimates might carry information from multiple events. In the time domain, ECoG signals were less strongly predictive of letter identity and appeared at a limited range of latencies (~150–300 ms). Thus, oscillatory ECoG signals for representing letter-related activity were more informative and longer in duration than time-domain signals. These results indicate that the ECoG signals that represent letter-related information appear in a fairly limited set of time intervals (~100–400 ms) but are distributed across a broad range of frequency bands from theta to high-gamma, as well as time-domain waveforms.
Figure 2.
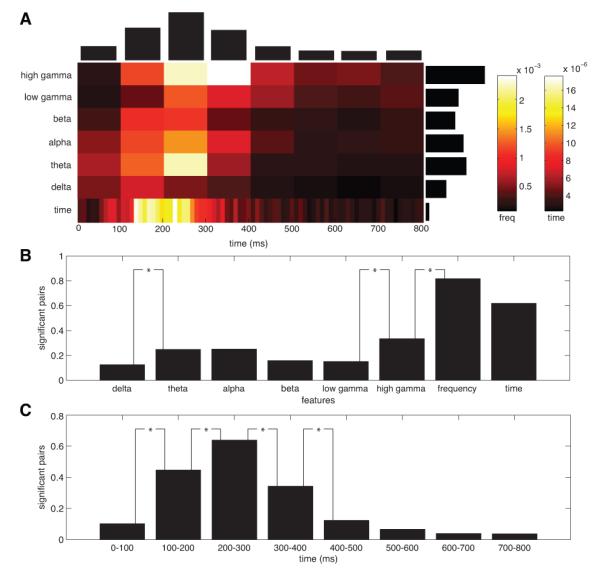
Spectral and temporal contributions to successful decoding. A. The importance map shows frequency domain and time domain contributions (absolute weights) to successful decoding as a function of time. Contributions were averaged over channels and summed over significant outcomes in each subject. Subsequently, results were normalized per subject and averaged over subjects. Black horizontal bars indicate relative contributions by the frequency domain and time domain representations. Black vertical bars indicate relative contributions by the frequency domain representation across time. B. Proportion of letters pairs that showed significant decoding performance when using subsets of the available frequency domain and time domain features instead of all features. Significant differences are indicated by an asterisk. C. Proportion of letters pairs that showed significant decoding performance when using individual time windows based on the frequency domain representation. Proportion is again computed relative to the number of significant letter pairs obtained when using all features. Statistically significant differences are indicated by asterisks.
In addition to examining the magnitudes of the model coefficients, a more rigorous way to understand how particular frequency bands or time windows contribute to the decoding is to use only features belonging to those bands or windows as input to the classifiers. Figure 2B compares the proportions of letter pairs that could be significantly decoded (binomial test, p = 0.05, Bonferroni corrected) using different groups of ECoG signals: each frequency band individually, all frequencies combined, and time-domain signals. Consistent with Figure 2A, of any single frequency range, the high-gamma band exhibited the best decoding performance, followed by the theta and alpha bands. The high-gamma band produced significantly greater decoding performance than the low-gamma band and the theta band led to significantly greater performance than the delta band. Further, when we allowed the model to integrate information from multiple frequencies, decoding performance significantly increased by 140% compared with the best individual band. This improvement indicates that brain signals at different frequencies encode independent stimulus-related information. Likewise, performance was better for the frequency-domain representation compared with the time-domain representation, though this comparison did not reach statistical significance.
Figure 2C shows the results of an analogous analysis comparing decoding performance between different time windows. This analysis revealed that the single time interval with the most robust decoding performance is 200–300 ms, confirming the pattern indicated in Figure 2A. When comparing the outcomes for consecutive time windows, differences ceased to be significant about 500 ms after stimulus presentation. The time-domain signals also achieved good decoding performance, but we chose to focus on frequency-based signals in the remainder of this paper because frequency-based signals led to improved decoding performance and because they are better understood in terms of underlying neuronal activity (Buzsáki et al., 1983; Eeckman and Freeman, 1990; Logothetis et al., 2001; Jacobs et al., 2007).
Subject-specific spatiotemporal patterns
Because our ECoG decoding model is customized for each patient, it provides a coherent framework for comparing the types of signals that represent letter-related information across patients. The analyses described above revealed that letter-related activity is most reliably encoded by ECoG signals at theta/alpha and high-gamma frequencies (Figure 2). We were interested in determining whether this trend was consistent across patients, as previous work showed significant variations in the properties of neural oscillations observed from different individuals (Doppelmayr et al., 2000; Jacobs et al., 2007; Vinck et al., 2010; van Pelt et al., 2012; Klimesch et al., 2003).
To compare patients’ letter-related ECoG signals, we first computed each patient’s spectro–temporal “signature” (STS; see Methods). The STS measures, for each patient, the proportion of electrodes at each frequency and timepoint that contributed towards decoding at least one letter pair. Figure 3 illustrates the STS for twelve representative patients. In these plots, the shading at each timepoint/frequency indicates the proportion of electrodes where ECoG activity contained significant letter-related information. Visually, the spectro–temporal signatures from individual patients appeared quite different, suggesting that there is dramatic interpatient variability in the types of brain signals that represent stimulus information. These examples suggest that some patients exhibit letterrelated ECoG activity only at low frequencies, others only at high frequencies, and some at both.
Figure 3.
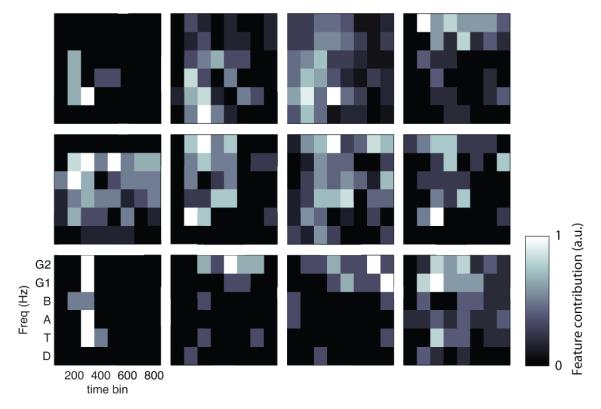
Subject-specific neural patterns. Each subpanel represents the contributions towards letter decoding from ECoG signals at different channels for various timepoints and frequencies. Each panel represents one patient and the brightness of the color at each spot indicates the proportion of electrodes in that patient that contributed towards letter decoding.
We used a permutation procedure to test whether the apparent differences in STSs from different people were statistically robust, based on measuring Euclidean distance between STS pairs (see Methods). This analysis revealed that STSs from different people were indeed more variable than expected by chance. Thus, there are statistically robust differences in the types of ECoG signals (across time and frequency) that encode stimulus information between separate individuals (p < 0.001). To control for apparent variations caused by intersubject differences in the locations of electrode placements, we separately performed a follow-up analysis that included only electrodes from particular brain lobes. The intersubject differences remained robust when each lobe of the neocortex was analyzed separately (p’s < 0.05). Thus, the interpatient differences we observed were not caused by clinical variations in electrode placement.
Spatial characterization of stimulus representations
We next studied the spatial distribution of letter-related information throughout the cortex. Although our dataset included patients with electrodes implanted in widespread regions, there was most extensive coverage in the temporal lobe, especially in the left hemisphere (Figure 4A). We first computed the involvement of each brain area in representing letter-related information by computing the mean absolute model coefficient for the electrodes from each Brodmann area (Figure 4B). This measure peaked in the occipital lobe. This is consistent with the notion that electrodes in occipital regions, including primary visual cortex, consistently encode information about many letters because they represent information related to visual perception (Jacobs and Kahana, 2009).
Figure 4.

Spatial contributions to successful decoding for models based on frequency domain components. Only significant letter pairs were used (binomial test, p = 0.05, corrected). A. Coverage shows the total number of electrodes assigned to a particular region. B. The average shows the normalized contributions where we took the mean absolute value of the regression coefficients for all electrodes from each brain region. C. The maximum shows the normalized contributions where we took the maximum over the regression coefficients belonging to a particular brain region. For each brain region, maxima and averages were computed by considering all regression coefficients belonging to a certain letter pair, fold, subject, time window, frequency and electrode, as long as the corresponding electrode belonged to that brain region.
It is possible that neurons in a region represent letterrelated information in a sparse manner. In this scheme, only a subset of the electrodes in an area would encode letter information and each of these sites would represent only a few letters. In our decoding model, these sparse representations would appear as regions that have a large maximum absolute model coefficient within each patient but a low mean absolute model coefficient, because a small proportion of the potential coefficients were informative for decoding. To identify these sparse representations, for each patient, we also computed the maximum absolute model coefficient of all the electrodes within each Brodmann area, collapsing across time and frequency (Figure 4C). By comparing the mean and maximum model coefficients, one can isolate the regions that represent letter information sparsely. The primary difference between Figures 4B&C is that only Figure 4C contains a peak in the left temporal lobe. This suggests that the left temporal lobe is specifically involved in representing letter information in a sparse manner Martin and Chao (2001). In contrast, the occipital lobe appears in both Figures 4B&C. This could indicate that multiple occipital electrodes in each patient significantly encode letter information. However, we note that our ability to observe sparse coding in the occipital lobe is relatively lower than other areas due to low electrode coverage. This low electrode count may have the effect of artificially reducing the difference between mean and maximum coefficients.
Next we compared whether separate electrodes that significantly encode letter information in the same patient are representing similar or independent information. Previous fMRI and scalp EEG studies identified large, homogeneous activations for cognitive stimuli, which would likely appear at multiple ECoG electrodes (Chao et al., 1999; Morton et al., In press). Here we tested whether separate ECoG electrodes are measuring the same or independent letter-related information by comparing decoding accuracy between single electrodes and different quantities of simultaneous electrodes. Figure 5A shows the decoding performance that can be achieved by separately examining individual electrodes in each patient. On average, decoding from the most informative electrode achieves 91% of the peak decoding accuracy. This number decreases to 34% for the second-most-informative electrode. This suggests that letter-related information is relatively focused spatially, such that only a small number of electrodes in each patient contain significant information. Next we examined whether different electrodes encode independent letter-related information by comparing performance across different numbers of simultaneous electrodes (Figure 5B; see Methods). Compared to a model that used all electrodes, accuracy decreased by 36% when only one electrode was used for decoding. Because decoding accuracy increased substantially with multiple electrodes, this indicates that the neural representations of individual stimuli are at least partially distributed, as suggested by theoretical models and empirical findings (Lashley, 1950; Freeman, 1975; Hoffman and McNaughton, 2002).
Figure 5.
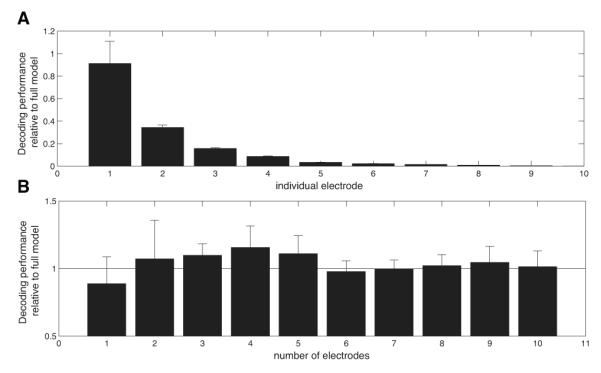
Spatial contributions to successful decoding for models based on frequency-domain components. Error bars indicate standard error of the mean. A. Proportion of letters pairs that could be significantly decoded from various electrodes individually. B. Contributions of electrodes to decoding of letter pairs. Electrodes were sorted according to decreasing contribution in terms of the magnitude of their regression coefficients. Subsequently, the proportion of letter pairs that could be significantly decoded was computed for one to ten electrodes and reported relative to the performance of the full model that used all electrodes.
For illustrative purposes, we show the structure of our decoding model in detail for two example patients. Figure 6A&B illustrates the decoding accuracy that can be achieved from a series of univariate decoding models that separately measure each electrode individually. Note that the electrodes that elicit significant decoding performance (warm colors) were spatially clustered. This indicates that individual patients have small clusters of electrodes that reliably distinguish multiple letter pairs (cf. (Jacobs and Kahana, 2009)). The subsequent plots (Figure 6C&D) show in detail the model coefficients at each electrode that produced this significant decoding pattern for several letter pairs. At each of these sites, decoding is driven by ECoG signals at a diverse set of timepoints and frequencies that is generally focused in the theta/alpha and high-gamma bands at a latency of about 200–300 ms.
Figure 6.
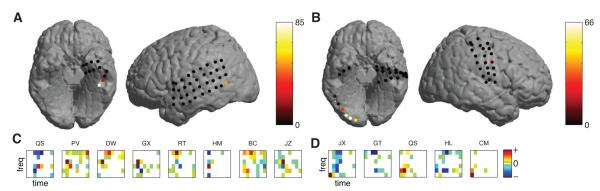
A & B. Spatial, spectral and temporal contributions to the decoding for unique letter pairs in two representative subjects. Contributions by individual channels were given by the single-electrode decoding performance in terms of the number of significant letter pairs. C & D. Spectro–temporal contributions of the estimated regression coefficients, averaged over folds. Results are given for that electrode which contributed most to the decoding in each subject.
Discussion
By using a multivariate decoding framework to probe human ECoG signals related to individual brain states, our work has revealed that the brain differentiates individual cognitive states through a diverse pattern of neuronal signals that are focused in the theta/alpha and high-gamma bands. Critically, our work used a logistic-regression decoding framework, which provided models that were interpretable in terms of the underlying neural signals. Below we summarize our main findings and describe their implications for our understanding of how the human brain encodes individual neural representations.
We observed significant levels of stimulus-related information at a wide range of frequencies, consistent with the recent findings of broadband ECoG signals in the human brain (Miller et al., 2007, 2009; Manning et al., 2009). However, in particular, the single frequency band that contained the most stimulus-related information was the highgamma band. This is consistent with work highlighting the important functional role of this signal (Crone et al., 1998; Jacobs and Kahana, 2009; Jacobs et al., 2012) and its close link to neuronal spiking (Manning et al., 2009; Ray et al., 2008). Research suggests that these high-gamma patterns may reflect broadband fluctuations that are not truly oscillatory in nature (Manning et al., 2009; Miller et al., 2009). One possibility is that broadband power increases co-occur with diffuse alpha-band power decreases (Miller et al., 2007, 2009). This alpha-band variability could cause the appearance of letter-related activity that is specific to the high-gamma band, as we observed, even though letter-related information is actually represented by broadband patterns. Thus, an important area of research is to distinguish the stimulus-related patterns that are related to true brain rhythms from those that instead reflect nonoscillatory neuronal spiking rates.
We also found a large level of stimulus-related information in the theta and alpha bands. Although theta oscillations have been shown to play an important and diverse role in neuronal coding (Buzsáki, 2002), generally these fluctuations are implicated in coordinating neuronal timing via phase coding (e.g., (O’Keefe and Recce, 1993)), rather than representing information via amplitude modulations. Thus, it is unexpected that we found here that theta oscillations vary in amplitude to distinguish individual letters. Fully characterizing the functional role of theta oscillations in human cognition is an important challenge going forward; our findings here indicate that theta oscillations have a broader functional role than thought previously.
A surprising feature of our results was that we were better able to decode rare letters compared with common ones. This suggests that infrequent letters are represented by distinctive neural patterns that stand out compared with the ECoG representations of common stimuli. This result has implications for designing brain–computer interfaces that recognize specific brain states, by suggesting that decoding performance will increase when rare stimuli are used. In addition, this pattern also may help explain the established word–frequency effects in which humans have better recognition memory performance for rare stimuli compared with common ones (Gorman, 1961). Our findings provide a neural explanation for word–frequency effects by suggesting that people’s improved memory for rare items occurs because these items are represented by distinctive neural patterns that have only a minimal overlap compared with the neural representations of common items. Thus, these distinctive neural representations may minimize interference and allow rare stimuli to stand out. An alternate explanation for these patterns is that the high decodability of rare letters is driven by a generic brain signal for surprising events (Squires et al., 1975), rather than detailed neural differences for rare items. Our stimulus set was not designed optimally to test this, as there are only a small number of truly rare letters, and thus this is an important issue for future work.
When we compared decoding models between patients, we found significant diversity in the types of signals that encoded letter-related information between individuals. Previous studies have reported moderate individual differences in neuronal oscillations, generally focusing on variations in the frequency or amplitude of a particular functionally defined oscillation, such as the alpha or gamma rhythms (Klimesch et al., 2003; van Pelt et al., 2012). Here, we found that the ECoG patterns that distinguish individual letters di er dramatically across individuals, both in the time and frequency domains. Thus, it is likely that these patterns, ranging from 2 to 128 Hz, reflect physiological signals that are fundamentally distinct. Thus, stimulus-specific brain patterns are not encoded by a single fixed type of oscillation but instead reflect a range of diverse electrophysiological brain mechanisms. An interesting area of future research is determining the factors that cause separate individuals to represent cognitive information via unique physiological signals and testing the potential behavioral consequences of these differences. The level of intersubject diversity that we observed might be unexpected, given a range of fMRI studies that report brain activations with consistent spatial properties across patients (Kanwisher, 2010), and the finding that neural activity in one patient can be used to decode activity from a different individual (Mitchell et al., 2008). One possibility is that many significant interindividual differences in brain function are only visible with electrical recordings like ECoG, rather than with fMRI.
When looking at individual letter pairs, we found that different letter pairs could be effectively decoded from activity in multiple frequencies at a small number of electrodes. These electrodes were mainly located in occipital cortex, but for some subjects these electrodes could be widely distributed (cf. Subject 1 in Figure 6). These results point towards the notion that stimulus-specific representations are sparsely encoded across cortex in a small number of localized areas that, when measured using conventional ECoG techniques, happen to be targeted by a few electrodes. There may be important distinctive organizational schemes for the coding of detailed stimulus information within these areas (Dehaene and Cohen, 2007; Op de Beeck et al., 2008b), but higher-resolution techniques would be necessary to observe these patterns (Kellis et al., 2009; Worrell et al., 2012). More broadly, the fact that we found small, localized patterns of stimulus-specific activity seems to point away from strong distributed theories of brain function proposing that brain states are represented homogeneously across brain-wide neuronal networks (Lashley, 1950; Přibram, 1991).
More generally, it might be considered surprising that we were able to decode information about individual brain states from ECoG electrodes, rather than from microelectrodes that measure individual action potentials (Quian Quiroga et al., 2005). The ECoG electrodes that we used record from ~2.5-mm2 contiguous areas of cortex. Thus, the fact that stimulus-specific activity appears in these recordings indicates that there are millimeter-scale clusters of neurons in the human brain with similar sensitivities to individual stimuli. It has previously been suggested that there are patterns of synchronized oscillations that represent cognitive information via amplitude modulations (Freeman and Schneider, 1982; Ohl et al., 2001), and thus one possibility is that our ECoG electrodes are measuring portions of these signals. In addition, other studies have identified various topographical organization schemes for cortical areas that represent distinct types of behavioral information, such as clusters of neurons corresponding to similar faces or percepts (Bonhoeffer et al., 1991; Op de Beeck et al., 2008a; Dahl et al., 2009). These types of neuronal clustering patterns could explain how we were able to measure stimulus-specific activity with standard ECoG electrodes, if a cluster of neurons with similar patterns of letter sensitivities happened to be arranged underneath a particular electrode.
Although this work focused only on neural correlates of perceived letters, we think it is likely that ECoG recordings contain analogous patterns for representing various types of specific cognitive information. In fact, recent ECoG studies reported a number of other stimulus-specific signals, including abstract concepts related to a patient’s past experiences (Jacobs et al., 2012), perceived phonemes (Chang et al., 2010), and perceived words (Kellis et al., 2010; Pasley et al., 2012). Because these diverse patterns were visible with ECoG electrodes, it suggests that there are distinct spatial clusters of neurons that represent various types of cognitive information in the human brain. It remains to be tested whether there are specific organizational principles that dictate the spatial organization of the neurons that represent this information. Previous work found that stimulus-specific information in the highgamma band is only present at the sites that exhibit an overall increase in activity compared to the baseline (Jacobs and Kahana, 2009); see also (Mur et al., 2012). Thus, one promising way to predict the ECoG sites that encode stimulus-specific information is to identify the sites that show overall increases in high-gamma activity when a patient views items from that category.
By showing that it is possible to probe the neural representations of individual brain states in detail, our work has implications for both basic neuroscience research and for brain–computer interface (BCI) development. Most previous research on the neural basis of cognition has indirectly tested various theories of brain function by identifying neural patterns that are associated with large-scale classes of behavior (Polyn et al., 2005). This work is extremely useful, but we feel that a more detailed type of work is now possible. By tracking the neural network states that correspond to specific stimuli, we think it will allow researchers to test computational theories at a higher level of detail than was previously possible (e.g., (Bedny et al., 2007; Manning et al., 2012)). An important open question remains whether the neural representation of individual stimuli persists in the absence of external stimulation, such as during working memory maintenance. We were unable to address this question using the current experimental design given the short intervals between individual stimulus presentations. We aim to address this question in future research. Finally, following the neural representation of individual brain states offers the potential of allowing brain–computer interfaces (BCIs) to operate more efficiently. Many current BCIs require users to initiate actions by activating one of a fixed number of arbitrary behavioral states that usually correspond to very broad categories. Instead, by triggering actions based on the ECoG representations of individual neural network states, it could make these systems more intuitive by directly decoding the user’s desired action rather than requiring the use of an intermediate brain state.
Highlights.
Identity of perceived letters can be decoded from intracranial data
Infrequent letters can be decoded with higher accuracy
Discriminative features are spatially localized and subject specific
Acknowledgements
JJ acknowledges the support of National Institutes of Health (R01MH55687 and R21NS067316) and Drexel University’s Human Cognition Enhancement Program. MG and EM gratefully acknowledge the support of the Brain-Gain Smart Mix Programme of the Netherlands Ministry of Economic Affairs and the Netherlands Ministry of Education, Culture and Science. We thank Michael Kahana for help with data collection and fruitful scientific discussions.
Footnotes
First and last authors contributed equally.
Publisher's Disclaimer: This is a PDF file of an unedited manuscript that has been accepted for publication. As a service to our customers we are providing this early version of the manuscript. The manuscript will undergo copyediting, typesetting, and review of the resulting proof before it is published in its final citable form. Please note that during the production process errors may be discovered which could affect the content, and all legal disclaimers that apply to the journal pertain.
References
- Bedny M, Aguirre G, Thompson-Schill S. Item analysis in functional magnetic resonance imaging. Neuroimage. 2007;35:1093–1102. doi: 10.1016/j.neuroimage.2007.01.039. [DOI] [PubMed] [Google Scholar]
- Beker H, Piper F. Cipher Systems : The Protection of Communications. John Wiley & Sons; 1982. [Google Scholar]
- Beutelspacher A. Kryptologie. Viewer Verlagsgesellschaft. 2005.
- Bonhoeffer T, Grinvald A, et al. Iso-orientation domains in cat visual cortex are arranged in pinwheel-like patterns. Nature. 1991;353:429–431. doi: 10.1038/353429a0. [DOI] [PubMed] [Google Scholar]
- Buzsáki G. Theta oscillations in the hippocampus. Neuron. 2002;33:325–340. doi: 10.1016/s0896-6273(02)00586-x. [DOI] [PubMed] [Google Scholar]
- Buzsáki G. Rhythms of the Brain. Oxford University Press; New York: 2006. [Google Scholar]
- Buzsáki G, Leung LS, Vanderwolf CH. Cellular bases of hippocampal EEG in the behaving rat. Brain Res. Rev. 1983;6:139–171. doi: 10.1016/0165-0173(83)90037-1. [DOI] [PubMed] [Google Scholar]
- Carroll MK, Cecchi GA, Rish I, Garg R, Rao AR. Prediction and interpretation of distributed neural activity with sparse models. Neuroimage. 2009;44:112–122. doi: 10.1016/j.neuroimage.2008.08.020. [DOI] [PubMed] [Google Scholar]
- Chan AM, Halgren E, Marinkovic K, Cash SS. Decoding word and category-specific spatiotemporal representations from MEG and EEG. Neuroimage. 2011;54:3028–3039. doi: 10.1016/j.neuroimage.2010.10.073. [DOI] [PMC free article] [PubMed] [Google Scholar]
- Chang E, Rieger J, Johnson K, Berger M, Barbaro N, Knight R. Categorical speech representation in human superior temporal gyrus. Nat. Neurosci. 2010;13:1428–1432. doi: 10.1038/nn.2641. [DOI] [PMC free article] [PubMed] [Google Scholar]
- Chao L, Haxby J, Martin A. Attribute-based neural substrates in temporal cortex for perceiving and knowing about objects. Nat. Neurosci. 1999;2:913–919. doi: 10.1038/13217. [DOI] [PubMed] [Google Scholar]
- Cox DD, Savoy RL. Functional magnetic resonance imaging (fMRI) “brain reading”: detecting and classifying distributed patterns of fMRI activity in human visual cortex. Neuroimage. 2003;19:261–270. doi: 10.1016/s1053-8119(03)00049-1. [DOI] [PubMed] [Google Scholar]
- Crone NE, Miglioretti DL, Gordon B, Lesser RP. Functional mapping of human sensorimotor cortex with electrocorticographic spectral analysis. II. Event-related synchronization in the gamma band. Brain. 1998;121:2301–2315. doi: 10.1093/brain/121.12.2301. [DOI] [PubMed] [Google Scholar]
- Dahl C, Logothetis N, Kayser C. Spatial organization of multisensory responses in temporal association cortex. J. Neurosci. 2009;29:11924–11932. doi: 10.1523/JNEUROSCI.3437-09.2009. [DOI] [PMC free article] [PubMed] [Google Scholar]
- Dehaene S, Cohen L. Cultural recycling of cortical maps. Neuron. 2007;56:384–398. doi: 10.1016/j.neuron.2007.10.004. [DOI] [PubMed] [Google Scholar]
- Doppelmayr M, Klimesch W, Schwaiger J, Stadler W, Röhm D. The time locked theta response reflects interindividual differences in human memory performance. Neurosci. lett. 2000;278:141–144. doi: 10.1016/s0304-3940(99)00925-8. [DOI] [PubMed] [Google Scholar]
- Eeckman FH, Freeman WJ. Correlations between unit firing and EEG in the rat olfactory system. Brain Res. 1990;528:238–244. doi: 10.1016/0006-8993(90)91663-2. [DOI] [PubMed] [Google Scholar]
- Epstein R, Harris A, Stanley D, Kanwisher N. The parahippocampal place Area. Neuron. 1999;23:115–125. doi: 10.1016/s0896-6273(00)80758-8. [DOI] [PubMed] [Google Scholar]
- Farah M, McClelland J. A computational model of semantic memory impairment: Modality specificity and emergent category specificity. J. Exp. Psychol. Gen. 1991;120:339–357. [PubMed] [Google Scholar]
- Freeman WJ. Mass action in the nervous system. Academic Press; 1975. [Google Scholar]
- Freeman WJ. Hilbert transform for brain waves. 2007 http://www.scholarpedia.org.
- Freeman WJ, Schneider W. Changes in spatial patterns of rabbit olfactory EEG with conditioning to odors. Psychophysiol. 1982;19:44–56. doi: 10.1111/j.1469-8986.1982.tb02598.x. [DOI] [PubMed] [Google Scholar]
- Friedman J, Hastie T, Tibshirani R. Regularization paths for generalized linear models via coordinate descent. J. Stat. Softw. 2010;33:1–22. [PMC free article] [PubMed] [Google Scholar]
- Gorman AM. Recognition memory for nouns as a function of abstractedness and frequency. J. Exp. Psychol. 1961;61:23–39. doi: 10.1037/h0040561. [DOI] [PubMed] [Google Scholar]
- Haxby J, Gobbini M, Furey M, Ishai A, Schouten J, Pietrini P. Distributed and overlapping representations of faces and objects in ventral temporal cortex. Science. 2001;293:2425–2430. doi: 10.1126/science.1063736. [DOI] [PubMed] [Google Scholar]
- Haynes JD, Rees G. Decoding mental states from brain activity in humans. Nat. Rev. Neurosci. 2006;7:523–534. doi: 10.1038/nrn1931. [DOI] [PubMed] [Google Scholar]
- Ho man K, McNaughton B. Coordinated reactivation of distributed memory traces in primate neocortex. Science. 2002;297:2070–2073. doi: 10.1126/science.1073538. [DOI] [PubMed] [Google Scholar]
- Jacobs J, Kahana MJ. Neural representations of individual stimuli in humans revealed by gamma-band ECoG activity. J. Neurosci. 2009;29:10203–10214. doi: 10.1523/JNEUROSCI.2187-09.2009. [DOI] [PMC free article] [PubMed] [Google Scholar]
- Jacobs J, Kahana MJ, Ekstrom AD, Fried I. Brain oscillations control timing of single-neuron activity in humans. J. Neurosci. 2007;27:3839–3844. doi: 10.1523/JNEUROSCI.4636-06.2007. [DOI] [PMC free article] [PubMed] [Google Scholar]
- Jacobs J, Lega B, Anderson C. Explaining why brain stimulation evokes remote memories. J. Cognitive Neurosci. 2012:553–563. doi: 10.1162/jocn_a_00170. [DOI] [PubMed] [Google Scholar]
- Kamitani Y, Tong F. Decoding the visual and subjective contents of the human brain. Nat. Neurosci. 2005;8:679–685. doi: 10.1038/nn1444. [DOI] [PMC free article] [PubMed] [Google Scholar]
- Kanwisher N. Functional specificity in the human brain: a window into the functional architecture of the mind. Proc. Natl. Acad. Sci. U.S.A. 2010;107:11163–11170. doi: 10.1073/pnas.1005062107. [DOI] [PMC free article] [PubMed] [Google Scholar]
- Kanwisher N, McDermott J, Chun MM. The fusiform face area: A module in human extrastriate cortex specialized for face perception. J. Neurosci. 1997;17:4302–4311. doi: 10.1523/JNEUROSCI.17-11-04302.1997. [DOI] [PMC free article] [PubMed] [Google Scholar]
- Kellis S, House P, Thomson K, Brown R, Greger B. Human neocortical electrical activity recorded on nonpenetrating microwire arrays: applicability for neuroprostheses. Neurosurgi. focus. 2009;27:E9. doi: 10.3171/2009.4.FOCUS0974. [DOI] [PMC free article] [PubMed] [Google Scholar]
- Kellis S, Miller K, Thomson K, Brown R, House P, Greger B. Classification of spoken words using surface local field potentials. Engineering in Medicine and Biology Society (EMBC), 2010 Annual International Conference of the IEEE; 2010. pp. 3827–3830. [DOI] [PubMed] [Google Scholar]
- Klimesch W, Sauseng P, Gerlo C. Enhancing cognitive performance with repetitive transcranial magnetic stimulation at human individual alpha frequency. Eur. J. Neurosci. 2003;17:1129–1133. doi: 10.1046/j.1460-9568.2003.02517.x. [DOI] [PubMed] [Google Scholar]
- Kriegeskorte N, Kreiman G, editors. Visual Population Codes. 1st edition The MIT Press; 2012. [Google Scholar]
- Lancaster JL, Woldor MG, Parsons LM, Liotti M, Freitas CS, Rainey L, Kochunov PV, Nickerson D, Mikiten SA, Fox PT. Automated Talairach atlas labels for functional brain mapping. Hum. Brain Mapp. 2000;10:120–131. doi: 10.1002/1097-0193(200007)10:3<120::AID-HBM30>3.0.CO;2-8. [DOI] [PMC free article] [PubMed] [Google Scholar]
- Lashley K. In search of the engram. Symposia of the Society for Experimental Biology. 1950;volume 4:454–482. [Google Scholar]
- Logothetis N, Pauls J, Augath M, Trinath T, Oeltermann A. Neurophysiological investigation of the basis of the fMRI signal. Nature. 2001;412:150–157. doi: 10.1038/35084005. [DOI] [PubMed] [Google Scholar]
- Manning JR, Jacobs J, Fried I, Kahana M. Broadband shifts in LFP power spectra are correlated with single-neuron spiking in humans. J. Neurosci. 2009;29:13613–13620. doi: 10.1523/JNEUROSCI.2041-09.2009. [DOI] [PMC free article] [PubMed] [Google Scholar]
- Manning JR, Sperling MR, Sharan A, Rosenberg EA, Kahana MJ. Spontaneously reactivated patterns in frontal and temporal lobe predict semantic clustering during memory search. J. Neurosci. 2012;32:8871–8878. doi: 10.1523/JNEUROSCI.5321-11.2012. [DOI] [PMC free article] [PubMed] [Google Scholar]
- Martin A, Chao L. Semantic memory and the brain: structure and processes. Curr. Opin. Neurobiol. 2001;11:194–201. doi: 10.1016/s0959-4388(00)00196-3. [DOI] [PubMed] [Google Scholar]
- Martin A, Wiggs C, Ungerleider L, Haxby J. Neural correlates of category-specific knowledge. Nature. 1996;379:649–652. doi: 10.1038/379649a0. [DOI] [PubMed] [Google Scholar]
- Miller K, Leuthardt EC, Schalk G, Rao RPN, Anderson NR, Moran DW, Miller JW, Ojemann JG. Spectral changes in cortical surface potentials during motor movement. J. Neurosci. 2007;27:2424–2432. doi: 10.1523/JNEUROSCI.3886-06.2007. [DOI] [PMC free article] [PubMed] [Google Scholar]
- Miller K, Sorensen LB, Ojemann JG, den Nijs M, Sporns O. Power-law scaling in the brain surface electric potential. PLoS Comput. Biol. 2009;5:e1000609. doi: 10.1371/journal.pcbi.1000609. [DOI] [PMC free article] [PubMed] [Google Scholar]
- Mitchell T, Shinkareva S, Carlson A, Chang K, Malave V, Mason R, Just M. Predicting human brain activity associated with the meanings of nouns. Science. 2008;320:1191–1195. doi: 10.1126/science.1152876. [DOI] [PubMed] [Google Scholar]
- Morton NW, Kahana MJ, Rosenberg EA, Sperling MR, Sharan AD, Polyn SM. Category-specific neural oscillations predict recall organization during memory search. Cereb. Cortex. doi: 10.1093/cercor/bhs229. In press. [DOI] [PMC free article] [PubMed] [Google Scholar]
- Mur M, Ru D, Bodurka J, De Weerd P, Bandettini P, Kriegeskorte N. Categorical, yet graded–single image activation profiles of human category-selective cortical regions. J. Neurosci. 2012;32:8649–8662. doi: 10.1523/JNEUROSCI.2334-11.2012. [DOI] [PMC free article] [PubMed] [Google Scholar]
- Murphy B, Poesio M, Bovolo F, Bruzzone L, Dalponte M, Lakany H. EEG decoding of semantic category reveals distributed representations for single concepts. Brain Lang. 2011;117:12–22. doi: 10.1016/j.bandl.2010.09.013. [DOI] [PubMed] [Google Scholar]
- Norman KA, Polyn SM, Detra GJ, Haxby J. Beyond mind-reading: multi-voxel pattern analysis of fMRI data. Trends Cogn. Sci. 2006;10:424–430. doi: 10.1016/j.tics.2006.07.005. [DOI] [PubMed] [Google Scholar]
- Ohl F, Scheich H, Freeman W. Change in pattern of ongoing cortical activity with auditory category learning. Nature. 2001;412:733–736. doi: 10.1038/35089076. [DOI] [PubMed] [Google Scholar]
- O’Keefe J, Recce ML. Phase relationship between hippocampal place units and the EEG theta rhythm. Hippocampus. 1993;3:317–30. doi: 10.1002/hipo.450030307. [DOI] [PubMed] [Google Scholar]
- Op de Beeck H, Haushofer J, Kanwisher N. Interpreting fMRI data: maps, modules and dimensions. Nat. Rev. Neurosci. 2008a;9:123–135. doi: 10.1038/nrn2314. [DOI] [PMC free article] [PubMed] [Google Scholar]
- Op de Beeck H, Torfs K, Wagemans J. Perceived shape similarity among unfamiliar objects and the organization of the human object vision pathway. J. Neurosci. 2008b;28:10111–10123. doi: 10.1523/JNEUROSCI.2511-08.2008. [DOI] [PMC free article] [PubMed] [Google Scholar]
- Pasley BN, David SV, Mesgarani N, Flinker A, Shamma SA, Crone NE, Knight RT, Chang EF. Reconstructing Speech from Human Auditory Cortex. PLoS Biol. 2012;10:e1001251. doi: 10.1371/journal.pbio.1001251. [DOI] [PMC free article] [PubMed] [Google Scholar]
- Polyn SM, Natu VS, Cohen JD, Norman KA. Category-specific cortical activity precedes retrieval during memory search. Science. 2005;310:1963–1966. doi: 10.1126/science.1117645. [DOI] [PubMed] [Google Scholar]
- Přibram K. Brain and perception: Holonomy and structure in figural processing. Lawrence Erlbaum; 1991. [Google Scholar]
- Quian Quiroga R, Reddy L, Kreiman G, Koch C, Fried I. Invariant visual representation by single neurons in the human brain. Nature. 2005;435:1102–1107. doi: 10.1038/nature03687. [DOI] [PubMed] [Google Scholar]
- Ray S, Crone N, Niebur E, Franaszczuk P, Hsiao S. Neural correlates of high-gamma oscillations (60-200 Hz) in macaquelocal field potentials and their potential implications in electrocorticography. J. Neurosci. 2008;28:11526–11536. doi: 10.1523/JNEUROSCI.2848-08.2008. [DOI] [PMC free article] [PubMed] [Google Scholar]
- Rieger JW, Reichert C, Gegenfurtner KR, Noesselt T, Braun C, Heinze HJ, Kruse R, Hinrichs H. Predicting the recognition of natural scenes from single trial MEG recordings of brain activity. Neuroimage. 2008;42:1056–1068. doi: 10.1016/j.neuroimage.2008.06.014. [DOI] [PubMed] [Google Scholar]
- Simanova I, van Gerven M, Oostenveld R, Hagoort P. Identifying object categories from event-related EEG: toward decoding of conceptual representations. PLoS ONE. 2010;5:e14465. doi: 10.1371/journal.pone.0014465. [DOI] [PMC free article] [PubMed] [Google Scholar]
- Squires N, Squires K, Hillyard S. Two varieties of longlatency positive waves evoked by unpredictable auditory stimuli in man. Electroencephalogr. Clin. Neurophysiol. 1975;38:387–401. doi: 10.1016/0013-4694(75)90263-1. [DOI] [PubMed] [Google Scholar]
- Sternberg S. High-speed scanning in human memory. Science. 1966;153:652–654. doi: 10.1126/science.153.3736.652. [DOI] [PubMed] [Google Scholar]
- Sternberg S. Memory-scanning: Mental processes revealed by reaction-time experiments. Am. Sci. 1969;57:421–457. [PubMed] [Google Scholar]
- Talairach J, Tournoux P. Co-Planar Stereotaxic Atlas of the Human Brain: 3-D Proportional System: An Approach to Cerebral Imaging (Thieme Classics) Thieme. 1988 [Google Scholar]
- van Pelt S, Boomsma DI, Fries P. Magnetoencephalography in twins reveals a strong genetic determination of the peak frequency of visually induced gamma-band synchronization. J. Neurosci. 2012;32:3388–3392. doi: 10.1523/JNEUROSCI.5592-11.2012. [DOI] [PMC free article] [PubMed] [Google Scholar]
- Vinck M, Lima B, Womelsdorf T, Oostenveld R, Singer W, Neuenschwander S, Fries P. Gamma-phase shifting in awake monkey visual cortex. J. Neurosci. 2010;30:1250–1257. doi: 10.1523/JNEUROSCI.1623-09.2010. [DOI] [PMC free article] [PubMed] [Google Scholar]
- Warrington E, Shallice T. Category specific semantic impairments. Brain. 1984;107:829–853. doi: 10.1093/brain/107.3.829. [DOI] [PubMed] [Google Scholar]
- Worrell G, Jerbi K, Kobayashi K, Lina J, Zelmann R, Le Van Quyen M. Recording and analysis techniques for high-frequency oscillations. Prog. Neurobiol. 2012;98:265–278. doi: 10.1016/j.pneurobio.2012.02.006. [DOI] [PMC free article] [PubMed] [Google Scholar]
- Zou H, Hastie T. Regularization and variable selection via the elastic net. J. Roy. Stat. Soc. B. 2005;67:301–320. [Google Scholar]