
Figure 5.
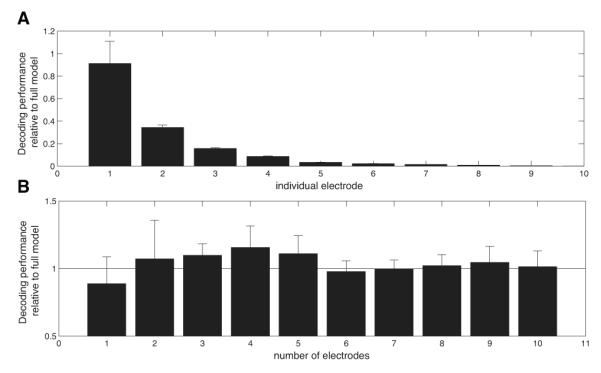
Spatial contributions to successful decoding for models based on frequency-domain components. Error bars indicate standard error of the mean. A. Proportion of letters pairs that could be significantly decoded from various electrodes individually. B. Contributions of electrodes to decoding of letter pairs. Electrodes were sorted according to decreasing contribution in terms of the magnitude of their regression coefficients. Subsequently, the proportion of letter pairs that could be significantly decoded was computed for one to ten electrodes and reported relative to the performance of the full model that used all electrodes.