Abstract
We study the geometric modeling approach to estimating the null distribution for the empirical Bayes modeling of multiple hypothesis testing. The commonly used method is a nonparametric approach based on the Poisson regression, which however could be unduly affected by the dependence among test statistics and perform very poorly under strong dependence. In this paper, we explore a finite mixture model based geometric modeling approach to empirical null distribution estimation and multiple hypothesis testing. Through simulations and applications to two public microarray data, we will illustrate its competitive performance.
Keywords: Empirical Bayes modeling, Empirical null distribution, False discovery rate, Finite mixture model, Multiple hypotheses testing
1 Introduction
The empirical Bayes modeling method has proven very useful for the large-scale multiple hypothesis testing problems, for example, the differential gene expression detection (Efron, 2003). In the empirical Bayes modeling approach, the selection of null distribution is critical for the appropriate control of false positives (Efron, 2004, 2007a,b). Efron (2010) discussed and illustrated in great detail the importance of adopting the empirical null distribution for the large-scale significance analysis of current biomedical data. Very novel analytic and geometric modeling approaches have been proposed for estimating the empirical null distribution in the significance analysis of two-class microarrays (Efron, 2008). In the analytical approach, a truncated normal distribution model was used to model the null statistics. In the geometric approach, a normal distribution was used to approximate the center of the marginal density, which is estimated non-parametrically using a splines based Poisson regression model.
In this paper we focus on the geometric modeling approach and show that the existing method could be unduly affected by the dependence among test statistics and perform very poorly under strong dependence. The commonly used Poisson regression based density estimation could not model the tail of the marginal distribution very well, and lead to irregular ranking of important genes based on the posterior differential expression probability. We propose a finite mixture model based geometric approach to simultaneously estimating the empirical null and marginal distributions. The finite mixture model is based on the normal distribution and could estimate the distribution tail very well yielding consistent ranking of important genes. We will illustrate its favorable performance through simulation and application studies.
The rest of the paper is organized as follows. In Section 2, we discuss a finite normal mixture model based geometric modeling approach to empirical null distribution estimation and multiple hypothesis testing. We conduct a simulation study in Section 3 and analyze a prostate and leukemia cancer microarray data in Section 4 to illustrate the proposed method. We end with a discussion in Section 5.
2 Geometric modeling of empirical null distribution estimation
Assume the appropriate normal transformation has been applied and we have some normally distributed test statistic zi for the hypothesis i = 1, ···, m. Assume zi has unit variance and we are interested in detecting those zi with nonzero means. The theoretical null distribution is the standard normal distribution N(0, 1). The dependence among test statistics could make the theoretical null distribution a poor fit and calls for the empirical null distribution for the appropriate control of false positives.
Following Efron (2004), we use a normal distribution with mean μ0 and variance to empirically model the null statistics. A Poisson regression based nonparametric approach has been proposed to estimate the empirical null distribution and true null proportion θ0, and implemented in the R package ‘locfdr’ (Efron et al., 2011). Specifically the log densities at some pre-specified points are estimated with a splines based Poisson regression model. A quadratic regression model is then fitted to the log densities in a small region around zero to estimate the empirical null distribution parameters. Due to the nonparametric nature of the splines based Poisson regression, the tail of the marginal distribution is often poorly estimated, which will affect the calculation of posterior probability of differential expressions and often lead to irregular ranking of important genes when combined with the parametric empirical null distribution.
We propose to approximate the marginal distribution of {zi} with a G-component finite normal mixture model
| (1) |
where φ(z; μ, σ2) is the probability density function of the normal distribution N(μ, σ2). Firstly we develop an EM algorithm (Dempster et al., 1977) for the maximum likelihood estimation of model (1), and select G based on the BIC (Schwarz, 1978). We then explore several approaches to geometric modeling of the empirical null distribution.
2.1 EM algorithm for model estimation
Define the class indicators, wi ∈ {1, ···, G}, following the multinomial distribution, Pr(wi = g) = πg. Conditional on wi = g, zi follows the normal distribution N (νg, σ2). The complete data log likelihood is
At the b-th iteration, we firstly compute the conditional probabilities based on the current parameter estimates
In the maximization step, for g = 1, ···, G, we compute (fixing )
We typically run the EM iteration multiple times with random initials to select the parameter estimate with the maximum likelihood. Given the estimated marginal distribution f(z), we discuss several geometric modeling approaches to estimating the empirical null distribution in the following section.
2.2 Geometric modeling of empirical null distribution
The intuitive idea of geometric modeling is to match the marginal distribution and the empirical null distribution based on some criterion, e.g., assuming similar distribution shape or minimizing their distance etc.
We approximate f(z) around zero with the empirical null distribution by matching their moments. Specifically we expand log f(z) at zero into a quadratic function
where
We then estimate
Alternatively we can use a linear regression model based on those observations in A0 (a small interval around zero: we selected A0 to contain the 10% smallest absolute test statistics in the simulation and application studies) to estimate αj
We can also minimize the Kullback-Leibler (KL) distance (Kullback and Leibler, 1951) between f(z) and the normal distribution constrained in the region A0
Next we conduct simulation studies to compare the Poisson regression based geometric approach (denoted as ‘locfdr’) to the mixture model based central matching (denoted as ‘mcm’), linear regression (denoted as ‘mlr’), and KL distance minimization approach (denoted as ‘mkl’).
3 Simulation Study
We simulate 20 blocks, each with 500 test statistics following the multivariate normal distribution with a compound covariance matrix, where the marginal variance is 1 and covariance is ρ. Different blocks are simulated independently. For each block, 100(1−θ0)% have the mean values simulated from a scaled Beta distribution, 2 × Beta(2, 2) + 1, and the rest have zero mean values. We then randomly change the sign of zi with probability of 0.5 to create both positive and negative correlations.
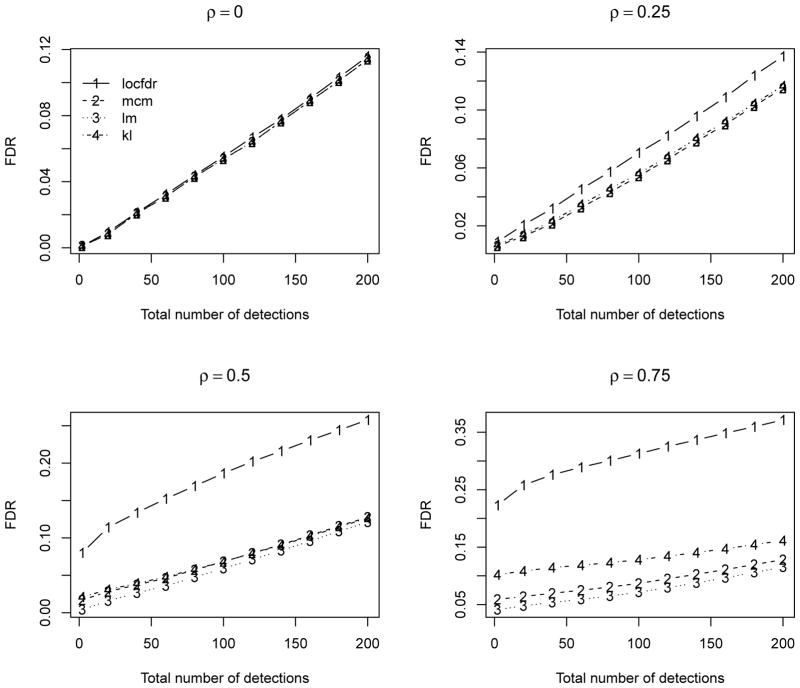
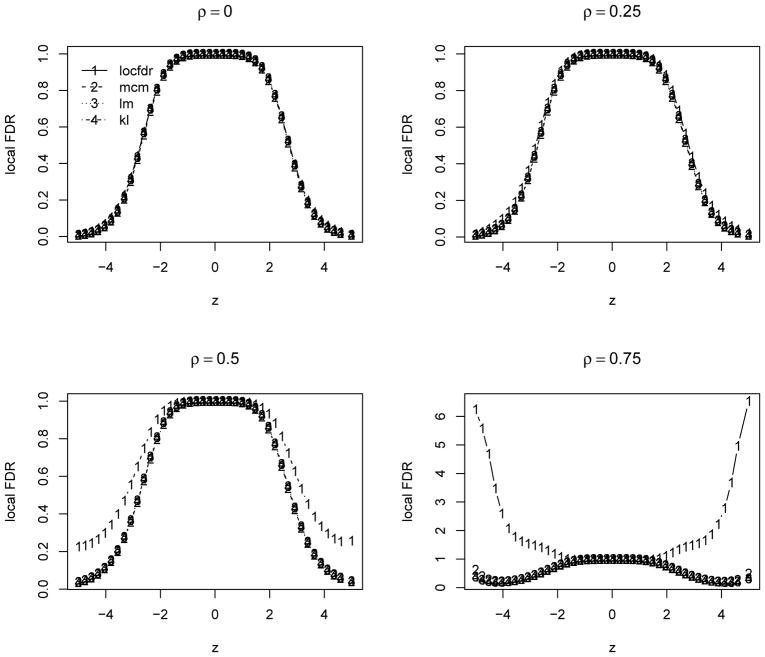
Here we report the results over 500 simulations for θ0 = 0.9 and ρ = (0, 0.25, 0.5, 0.75) to investigate the performance under relatively weak to strong dependence. In each simulation, we compute the ‘oracle’ estimates with the mean and standard error computed based on the sample mean and variance of the set of 100θ0% true null statistics. For the locfdr and mixture model based estimates, we compute the mean squared errors of their difference from the oracle estimates. We also compare the false discovery rate (FDR, Benjamini and Hochberg, 1995) for the top ranked 50/100 statistics, denoted as FDR50 and FDR100. Table 1 summarizes the results. Figure 1 compares the FDR for both methods. We can see that the locfdr approach is unduly affected by the strong dependence among statistics, especially the null proportion and variance estimates. The locfdr approach tends to detect more false positives under relatively strong dependence. While the mixture model based approaches are less affected by the test statistics dependence, and have relatively stable performance under all dependence structures. Overall the mixture model based approaches perform very favorably compared to the locfdr approach. Figure 2 compares the estimated local FDR, which is essentially the posterior probability of non-differential expression. The proposed approach has relatively more consistent estimation of the local FDR compared to the locfdr. When there are strong dependence among the test statistics, the locfdr has some irregular local FDR estimates in the tails, which is partially due to the nonparametric marginal density estimation unable to fit well the extreme tail probabilities.
Table 1.
Estimated mean squared errors of (θ0, μ0, σ0) and FDRs for the top ranked 50 and 100 statistics over 500 simulations.
| θ0 | μ0 | σ0 | FDR50 | FDR100 | ||
|---|---|---|---|---|---|---|
| 0 | locfdr | 3.6e-3 | 7.5e-4 | 3.6e-3 | 0.026 | 0.053 |
| mcm | 2.2e-3 | 7.4e-5 | 1.3e-3 | 0.025 | 0.052 | |
| mlr | 2.5e-3 | 7.0e-5 | 1.6e-3 | 0.025 | 0.052 | |
| mkl | 2.5e-3 | 7.0e-5 | 1.6e-3 | 0.025 | 0.052 | |
|
| ||||||
| 0.25 | locfdr | 4.7e-3 | 8.2e-4 | 5.5e-3 | 0.026 | 0.056 |
| mcm | 2.4e-3 | 7.2e-5 | 1.6e-3 | 0.025 | 0.055 | |
| mlr | 2.7e-3 | 6.8e-5 | 1.9e-3 | 0.025 | 0.055 | |
| mkl | 2.7e-3 | 6.8e-5 | 1.9e-3 | 0.025 | 0.055 | |
|
| ||||||
| 0.50 | locfdr | 1.2e-2 | 9.8e-4 | 2.5e-2 | 0.072 | 0.105 |
| mcm | 2.9e-3 | 7.2e-5 | 3.8e-3 | 0.022 | 0.047 | |
| mlr | 3.2e-3 | 6.9e-5 | 4.0e-3 | 0.021 | 0.046 | |
| mkl | 3.2e-3 | 6.9e-5 | 4.0e-3 | 0.024 | 0.049 | |
|
| ||||||
| 0.75 | locfdr | 1.1e-1 | 8.4e-3 | 7.3e-1 | 0.232 | 0.268 |
| mcm | 5.5e-3 | 1.1e-4 | 1.7e-2 | 0.032 | 0.055 | |
| mlr | 4.7e-3 | 8.8e-5 | 1.5e-2 | 0.023 | 0.047 | |
| mkl | 4.7e-3 | 8.8e-5 | 1.5e-2 | 0.041 | 0.061 | |
Figure 1.
Estimated FDR over 500 simulations
Figure 2.
Estimated local FDR over 500 simulations
In the next section, we analyze the pairwise gene correlations in a prostate cancer microarray data (showing very strong interactions), and detect differential expressions in a leukemia microarray data (with relatively weak interactions). We compare the proposed mixture model based method to the locfdr.
4 Application to prostate and leukemia cancer microarray data
The prostate cancer microarray data (Singh et al., 2002) consists of 50 normal and 52 tumor prostate tissue samples with genes measured using the Affymetrix hgu95av2 genechip. We analyze the data using those genes with annotated molecular functions in the Gene Ontology (Ashburner et al., 2000), which leads to 5570 genes and K = 15509665 pairwise correlations.
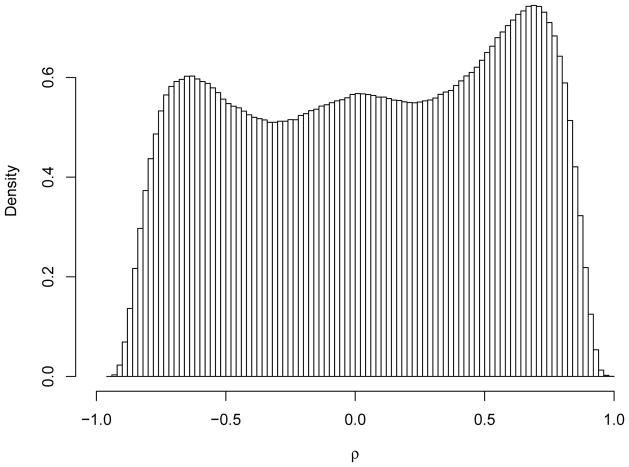
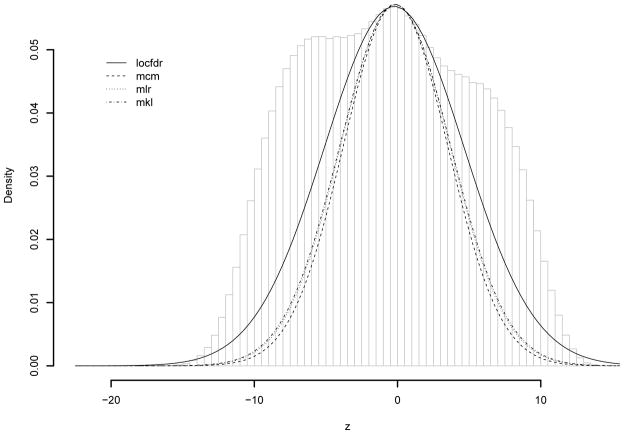
Denote as the sample correlations. Figure 3 shows its histogram for the prostate cancer microarray data. In general we can see many significantly non-zero correlations clustering around 1 and −1. When assuming normal distribution for the gene expressions, the statistic follows the t-distribution with 99 degrees of freedom. We analyze the normally transformed statistic, zk = Φ−1{T99(tk)}, where Φ(·)/T99(·) are the standard normal and t-distribution function with 99 degrees of freedom. The theoretical null distribution of zk is the standard normal distribution. The pairwise sample correlations are strongly correlated with each other. The fitted mixture model selected 10 components based on the BIC. For both approaches, A0 is chosen to contain the smallest 10% absolute correlations. Table 2 compares the estimated empirical null distributions and , the estimated FDR when declaring the 1.6 × 10⁶ top ranked correlations as significant (approximately 10% of all correlations). Figure 4 shows the histogram of the transformed Z-statistics for the prostate cancer microarray data. The superimposed lines are estimated locfdr and mixture model based null distributions. Overall they provide similar fit around the center of the histogram. The histogram is a nonparametric estimate of the marginal distribution, and the fitted empirical null distribution should be smaller than the marginal distribution. The mixture model based approaches fit the tail of the histogram better than the locfdr, which tends to over estimate the tail of the null density.
Figure 3.
Pairwise gene correlations for the prostate cancer data
Table 2.
Empirical null distribution and FDR estimates for prostate cancer data.
| θ̂0 | μ̂0 | σ̂0 |
|
||
|---|---|---|---|---|---|
| locfdr | 0.696 | −0.233 | 4.887 | 0.354 | |
| mcm | 0.524 | −0.141 | 3.658 | 0.054 | |
| mlr | 0.550 | −0.159 | 3.834 | 0.079 | |
| mkl | 0.557 | −0.161 | 3.887 | 0.087 |
Figure 4.
Pairwise gene correlations for the prostate cancer data
The leukemia microarray data compared the gene expressions of 20 Mll-AF9 knockin and 23 wild type mice in four cell types (Chen et al., 2008). We analyzed 36,734 genes with unigene annotations among the 45,101 genes measured using the Affymetrix murine 430 2.0 genechip. We compare the Mll-AF9 and wild type expression differences with the following additive effects model
where {x1j, ···, xnj} are the expression values of gene j, yi is the indicator for the Mll-AF9 /wild type, and (z1i, z2i, z3i) are three indicators for the cell types. We use the empirical Bayes approach to further improve the estimation of (Smyth, 2004). The normal transformed t-statistic for βj is analyzed for detecting differential expressions. The three approaches based on the normal mixture model yield similar results, and we list the mcm results (denoted as ‘nmix’) in the following.
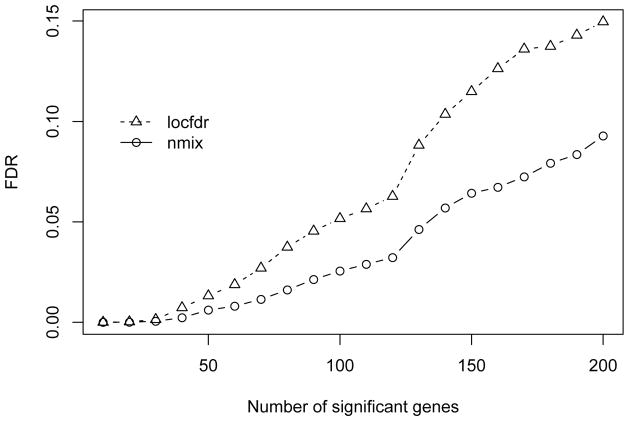
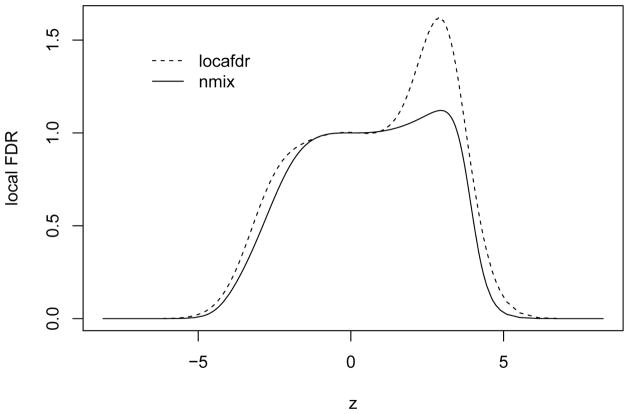
Figure 5 shows the estimated FDR for detecting differential expressions. In general, we can see that the proposed nmix can detect more significant genes than the locfdr. Controlling FDR at 0.1, the nmix identified 223 significant genes, while 165 genes are detected by the locfdr. Figure 6 compares the local FDR estimation for both methods. The local FDR is the posterior probability of non-differential expression and should be strictly between 0 and 1. The nmix approach has a more consistent estimate of the local FDR, while the locfdr approach has some irregular estimate in a positive interval.
Figure 5.
Estimated FDR of differential expression detection for the leukemia data
Figure 6.
Estimated local FDR of differential expression detection for the leukemia data
For the top ranked significant genes identified by each method, we analyze their enrichment of the KEGG pathways (Ogata et al., 1999). Controlling FDR at 0.1 for the enrichment significance, there were 13 significantly enriched KEGG pathways for the top 223 genes selected by the nmix, and 3 significantly enriched KEGG pathways for the top 165 significant genes selected by the locfdr. Table 3 and 4 summarize the detailed enrichment results. The number of genes column listed two numbers: the first is the total number of pathway genes (measured in the leukemia cancer data) and the second is the number of pathway genes ranked in the top 223/165 by each method. All the identified significantly enriched KEGG pathways have been studied and linked to leukemia (see, e.g., Cerny et al., 1971; Her and Zor, 1991; Walther et al., 1998; Perry et al., 1998; Mohle et al., 1998; Thomas and Anglaret, 1999; Puig-Kroger et al., 2000; Valentin et al., 2001; Zhao et al., 2004; Kandilci and Grosveld, 2005; Rizo, 2006; Gallay et al., 2007; Ramsay and Gribben, 2009; Dang et al., 2010; Heddleston et al., 2012).
Table 3.
Significantly enriched KEGG pathways for the top 223 genes identified by the nmix.
| KEGG pathway | # genes | p-value | locfdr p-value |
|---|---|---|---|
| leukocyte transendothelial migration | 244/8 | 2.0e-5 | 5.0e-3 |
| biosynthesis of unsaturated fatty acids | 37/3 | 7.5e-5 | 6.2e-4 |
| glycine serine and threonine metabolism | 51/3 | 2.6e-4 | 2.2e-2 |
| regulation of actin cytoskeleton | 477/9 | 7.3e-4 | 2.1e-2 |
| inositol phosphate metabolism | 128/4 | 1.1e-3 | 2.0e-2 |
| tight junction | 268/6 | 1.3e-3 | 1.4e-3 |
| phosphatidylinositol signaling system | 178/4 | 4.7e-3 | 4.7e-2 |
| glioma | 178/4 | 4.7e-3 | 8.7e-3 |
| hematopoietic cell lineage | 111/3 | 4.8e-3 | 1.6e-3 |
| cell adhesion molecules cams | 255/5 | 4.8e-3 | 1.1e-1 |
| vibrio cholerae infection | 112/3 | 4.9e-3 | 1.4e-2 |
| long term potentiation | 180/4 | 5.0e-3 | 4.8e-2 |
| calcium signaling pathway | 367/6 | 7.4e-3 | 6.5e-3 |
Table 4.
Significantly enriched KEGG pathways for the top 165 genes identified by the locfdr.
| KEGG pathway | # genes | p-value | nmix p-value |
|---|---|---|---|
| biosynthesis of unsaturated fatty acids | 37/2 | 6.2e-4 | 7.5e-5 |
| tight junction | 268/5 | 1.4e-3 | 1.3e-3 |
| hematopoietic cell lineage | 111/3 | 1.6e-3 | 4.8e-3 |
5 Discussion
As clearly demonstrated at Efron (2010), the empirical null distribution is critical for the appropriate control of false positives in the significance analysis of current large-scale biomedical data. The proposed three geometric modeling methods based on the mixture model are easy to implement and have shown very competitive performance in the simulation and application studies. Overall the central moment matching approach has the best performance. It can be very easily computed and does not need any tuning parameter selection. When we do not have very strong dependence among the test statistics, the linear regression and KL distance approaches have comparable performance as the central moment matching.
Highlights.
A flexible modeling approach to estimate empirical null distribution for appropriate control of false positives
Detailed simulation studies demonstrating the very competitive performance of the proposed method
Applications to two microarray data illustrating the favorable performance of the proposed method
Acknowledgments
This research was supported in part by NIH grant GM083345 and CA134848. I would like to thank the anonymous referee for the constructive comments that have improved the presentation of the paper.
Footnotes
Publisher's Disclaimer: This is a PDF file of an unedited manuscript that has been accepted for publication. As a service to our customers we are providing this early version of the manuscript. The manuscript will undergo copyediting, typesetting, and review of the resulting proof before it is published in its final citable form. Please note that during the production process errors may be discovered which could affect the content, and all legal disclaimers that apply to the journal pertain.
References
- Ashburner M, Ball CA, Blake JA, Botstein D, Butler H, Cherry JM, Davis AP, Dolin-ski K, Dwight SS, Eppig JT, Harris MA, Hill DP, Issel-Tarver L, Kasarskis A, Lewis S, Matese JC, Richardson JE, Ringwald M, Rubin GM, Sherlock G. Gene ontology: tool for the unification of biology. Nature Genetics. 2000;25 (1):25–29. doi: 10.1038/75556. [DOI] [PMC free article] [PubMed] [Google Scholar]
- Benjamini Y, Hochberg Y. Controlling the False Discovery Rate: a Practical and Powerful Approach to Multiple Testing. Journal of the Royal Statistical Society Series B (Methodological) 1995;57:289–300. [Google Scholar]
- Cerny J, McAlack RF, Geglowski WS, Friedman H. Divergence between immunosuppression and immunocompetence during virus-induced leukemogenesis. Proceedings of the National Academy of Sciences of the United States of America. 1971;68 (8):1862–1865. doi: 10.1073/pnas.68.8.1862. [DOI] [PMC free article] [PubMed] [Google Scholar]
- Chen W, Kumar AR, Hudson WA, Li Q, Wu B, Staggs RA, Lund EA, Sam TN, Kersey JH. Malignant transformation initiated by mll-af9: Gene dosage and critical target cells. Cancer Cell. 2008;13 (5):432–440. doi: 10.1016/j.ccr.2008.03.005. [DOI] [PMC free article] [PubMed] [Google Scholar]
- Dang L, Jin S, Su SM. IDH mutations in glioma and acute myeloid leukemia. Trends in molecular medicine. 2010;16 (9):387–397. doi: 10.1016/j.molmed.2010.07.002. [DOI] [PubMed] [Google Scholar]
- Dempster AP, Laird NM, Rubin DB. Maximum likelihood from incomplete data via the EM algorithm. Journal of the Royal Statistical Society Series B (Methodological) 1977;39 (1):1–38. [Google Scholar]
- Efron B. Robbins, empirical Bayes and microarrays. Annals of Statistics. 2003;31 (2):366–378. [Google Scholar]
- Efron B. Large-scale simultaneous hypothesis testing: the choice of a null hypothesis. Journal of the American Statistical Association. 2004;99:96–104. [Google Scholar]
- Efron B. Correlation and Large-Scale Simultaneous Significance Testing. Journal of the American Statistical Association. 2007a;102:93–103. [Google Scholar]
- Efron B. Size, power, and false discovery rates. Annals of Statistics. 2007b;35 (4):1351–1377. [Google Scholar]
- Efron B. Microarrays, Empirical Bayes and the Two-Groups Model. Statistical Science. 2008;23:1–22. [Google Scholar]
- Efron B. Large-Scale Inference: Empirical Bayes Methods for Estimation, Testing, and Prediction. 1. Cambridge University Press; New York, NY: 2010. [Google Scholar]
- Efron B, Turnbull BB, Narasimhan B. locfdr: Computes local false discovery rates. R package version 1.1-7. 2011 http://CRAN.R-project.org/package=locfdr.
- Gallay N, Anani L, Lopez A, Colombat P, Binet C, Domenech J, Weksler BB, Malavasi F, Herault O. The role of Platelet/Endothelial cell adhesion molecule 1 (CD31) and CD38 antigens in marrow microenvironmental retention of acute myelogenous leukemia cells. Cancer Research. 2007;67 (18):8624–8632. doi: 10.1158/0008-5472.CAN-07-0402. [DOI] [PubMed] [Google Scholar]
- Heddleston JM, Wu Q, Rivera M, Minhas S, Lathia JD, Sloan AE, Iliopoulos O, Hjelmeland AB, Rich JN. Hypoxia-induced mixed-lineage leukemia 1 regulates glioma stem cell tumorigenic potential. Cell Death & Differentiation. 2012;19 (3):428–439. doi: 10.1038/cdd.2011.109. [DOI] [PMC free article] [PubMed] [Google Scholar]
- Her E, Zor U. Glucocorticoid inhibition of antigen-induced inositol phosphate formation: possible involvement of phosphatases. Journal of basic and clinical physiology and pharmacology. 1991;2 (3):217–222. doi: 10.1515/jbcpp.1991.2.3.217. [DOI] [PubMed] [Google Scholar]
- Kandilci A, Grosveld GC. SET-induced calcium signaling and MAPK/ERK pathway activation mediate dendritic cell-like differentiation of u937 cells. Leukemia. 2005;19 (8):1439–1445. doi: 10.1038/sj.leu.2403826. [DOI] [PubMed] [Google Scholar]
- Kullback S, Leibler RA. On Information and Sufficiency. The Annals of Mathematical Statistics. 1951;22:79–86. [Google Scholar]
- Mohle R, Bautz F, Rafii S, Moore MAS, Brugger W, Kanz L. The chemokine receptor CXCR-4 is expressed on CD34+Hematopoietic progenitors and leukemic cells and mediates transendothelial migration induced by stromal cell-derived factor-1. Blood. 1998;91 (12):4523–4530. [PubMed] [Google Scholar]
- Ogata H, Goto S, Sato K, Fujibuchi W, Bono H, Kanehisa M. KEGG: Kyoto Encyclopedia of Genes and Genomes. Nucleic Acids Research. 1999;27 (1):29–34. doi: 10.1093/nar/27.1.29. [DOI] [PMC free article] [PubMed] [Google Scholar]
- Perry JR, Brown MT, Gockerman JP. Acute leukemia following treatment of malignant glioma. Journal of Neuro-Oncology. 1998;40 (1):39–46. doi: 10.1023/a:1006175831785. [DOI] [PubMed] [Google Scholar]
- Puig-Kroger A, Lpez-Rodrguez C, Relloso M, Snchez-Elsner T, Nueda A, Munoz E, Bernabeu C, Corb AL. Polyomavirus enhancer-binding protein 2/Core binding Factor/Acute myeloid leukemia factors contribute to the cell type-specific activity of the CD11a integrin gene promoter. Journal of Biological Chemistry. 2000;275 (37):28507–28512. doi: 10.1074/jbc.M004323200. [DOI] [PubMed] [Google Scholar]
- Ramsay AG, Gribben JG. Immune dysfunction in chronic lymphocytic leukemia t cells and lenalidomide as an immunomodulatory drug. Haematologica. 2009;94 (9):1198–1202. doi: 10.3324/haematol.2009.009274. [DOI] [PMC free article] [PubMed] [Google Scholar]
- Rizo A. Signaling pathways in self-renewing hematopoietic and leukemic stem cells: do all stem cells need a niche? Human Molecular Genetics. 2006;15 :R210–R219. doi: 10.1093/hmg/ddl175. Review Issue 2. [DOI] [PubMed] [Google Scholar]
- Schwarz G. Estimating the dimension of a model. Annals of Statistics. 1978;6 (2):461–464. [Google Scholar]
- Singh D, Febbo PG, Ross K, Jackson DG, Manola J, Ladd C, Tamayo P, Renshaw AA, D’Amico AV, Richie JP, Lander ES, Loda M, Kantoff PW, Golub TR, Sellers WR. Gene expression correlates of clinical prostate cancer behavior. Cancer Cell. 2002;1:203–209. doi: 10.1016/s1535-6108(02)00030-2. [DOI] [PubMed] [Google Scholar]
- Smyth GK. Linear models and empirical bayes methods for assessing differential expression in microarray experiments. Statistical Applications in Genetics and Molecular Biology. 2004;3:Article 1. doi: 10.2202/1544-6115.1027. [DOI] [PubMed] [Google Scholar]
- Thomas X, Anglaret B. Cell adhesion molecules: expression and function in acute myeloid leukemia. Bulletin du cancer. 1999;86 (3):265–277. [PubMed] [Google Scholar]
- Valentin H, Hamaia S, Konig S, Gazzolo L. Vascular cell adhesion molecule-1 induced by human t-cell leukaemia virus type 1 tax protein in t-cells stimulates proliferation of human t-lymphocytes. Journal of General Virology. 2001;82 (4):831–835. doi: 10.1099/0022-1317-82-4-831. [DOI] [PubMed] [Google Scholar]
- Walther T, Balschun D, Voigt JP, Fink H, Zuschratter W, Birchmeier C, Ganten D, Bader M. Sustained long term potentiation and anxiety in mice lacking the Mas protooncogene. Journal of Biological Chemistry. 1998;273 (19):11867–11873. doi: 10.1074/jbc.273.19.11867. [DOI] [PubMed] [Google Scholar]
- Zhao S, Konopleva M, Cabreira-Hansen M, Xie Z, Hu W, Milella M, Estrov Z, Mills GB, Andreeff M. Inhibition of phosphatidylinositol 3-kinase dephosphorylates BAD and promotes apoptosis in myeloid leukemias. Leukemia. 2004;18 (2):267–275. doi: 10.1038/sj.leu.2403220. [DOI] [PubMed] [Google Scholar]


