Abstract
Designed self-assembled DNA crystals consist of rigid DNA motifs that are held together by cohesive sticky-ended interactions. A prominent application of such systems is that they might be able to act as macromolecular hosts for macromolecular guests, thereby alleviating the crystallization problem of structural biology. We have recently demonstrated that it is indeed possible to design and construct such crystals and to determine their structures by X-ray diffraction procedures. To act as useful hosts that organize biological macromolecules for crystallographic purposes, maximizing the resolution of the crystals will maximize the utility of the approach. The structures reported so far have diffracted only to about 4 Å, so we have examined two factors that might have impact on the resolution. We find no difference in the resolution whether the DNA is synthetic or PCR-generated. However, we find that the presence of a phosphate on the 5′ end of the strands improves the resolution of the crystals markedly.
Keywords: Self-Assembled 3D DNA Crystals, Crystal Resolution, Phosphorylated DNA, Natural and Synthetic DNA, X-Ray Diffraction, Designed Crystals
Our laboratory has been working to self-assemble crystals from branched DNA motifs for over 30 years.1 Recently, we reported the first successful self-assembly of a designed crystal (RSCB id 3GBI), whose resolution was about 4 Å on beam line ID19 at the Advanced Photon Source (APS -- Argonne National Laboratory, Argonne, IL, USA), and about 5 Å on a less intense beam line (NSLS-X25) at the National Synchrotron Light Source (NSLS -- Brookhaven National Laboratory, Upton, New York, USA).2 The motif that we used was based on the ‘tensegrity triangle’ 3D motif, first reported by Mao and his colleagues.3 The edges of the triangle consist of two turns of B-DNA (21 nucleotide pairs), and the sticky ends are formed from two nucleotides each; we found that the crystals diffracted somewhat better if the system was 3-fold symmetric. Subsequently, we have been able to design, self-assemble, and determine the structures of two related crystal forms. One crystal was designed to contain two independent triangles per asymmetric unit.4 In this instance, we demonstrated that we could control the colors of the crystals by attaching the dyes Cy3 or Cy5 to the DNA components of the crystals. A second related crystal contained triangles whose edges consist of three turns of DNA (31 nucleotide pairs).5 The crystal with two molecules per asymmetric unit diffracted to 5 Å resolution (NSLS-X6A, a beam line with lower intensity than X-25) and the 3-turn triangle diffracted to 6.7 Å resolution (NSLS-X25). The initial goal of the self-assembling crystal system was to have DNA crystals that could act as macromolecular hosts for macromolecular guests, thereby alleviating the macromolecular crystallization problem.1 However, the resolutions of the crystals self-assembled so far are inadequate for this purpose.
We are analyzing the causes of the relatively poor resolution found in these crystals. During the last two decades, we have found two instances where synthetic DNA did not produce the results expected from it, when used as an enzymatic substrate; by contrast, DNA generated by the polymerase chain reaction (PCR) was an effective substrate. One example was the low level at which a synthetic DNA molecule was transcribed by T7 RNA polymerase to produce an RNA knot;6,7 the other instance was the incomplete restriction of a DNA graph assembled from synthetic branched junctions.8 We concluded that chemical errors had likely arisen in the course of producing these molecules by conventional DNA synthesis.9 Consequently, we felt it was important to examine the effect of using PCR-generated DNA on the resolution of self-assembled DNA crystals. We report here the results of that study. We find that there is little increase in the resolution of the crystals when the strands are produced by PCR-generated DNA, but we have discovered a marked improvement when the DNA contains a 5′ phosphate.
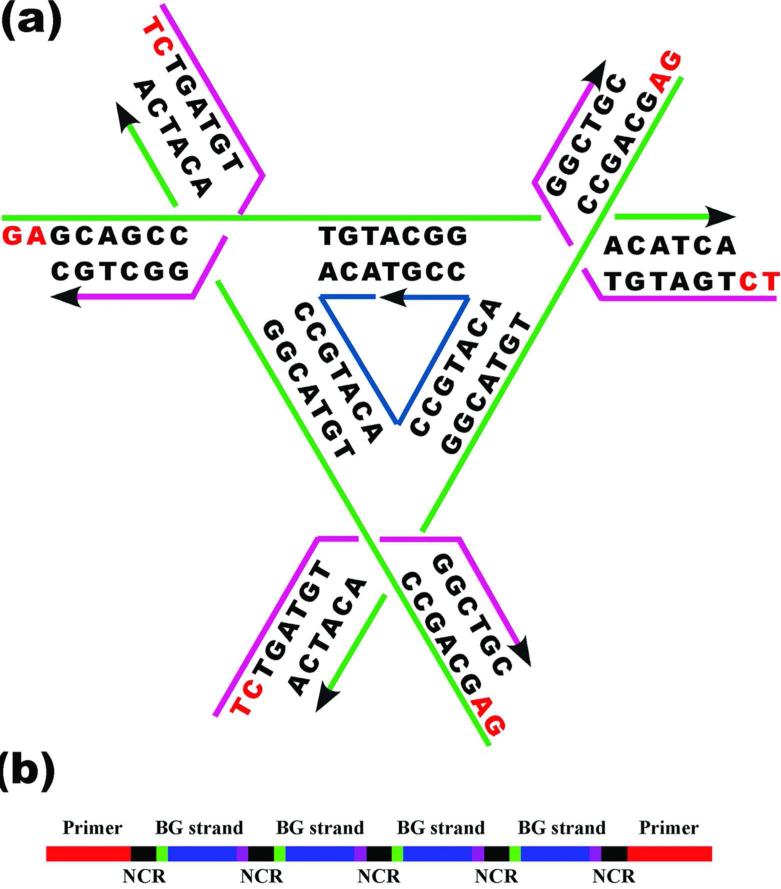
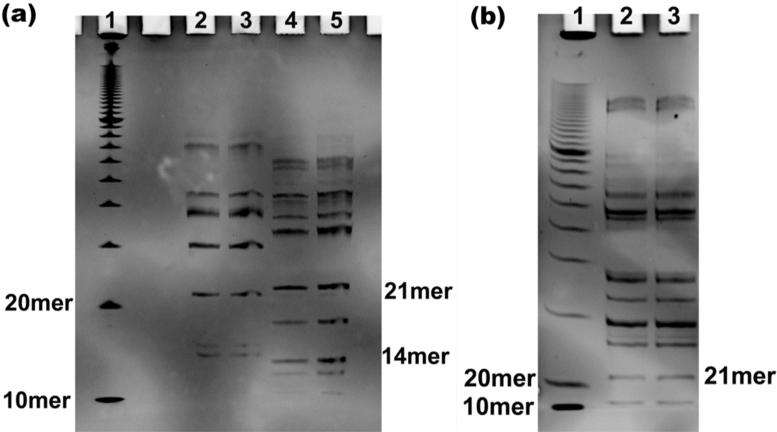
We have used the same triangle design that was first reported in reference 2 (Figure 1a). The schematic drawing of the construct for each of the three different PCR products is shown in Figure 1b. The DNA duplex generated by PCR has primer regions (red) at both ends, four regions (blue) that contain DNA sequences for self-assembling DNA triangle crystals, four green and purple sites for the restriction enzymes cutting the DNA strands out of DNA duplex and five non-coding regions (black) to separate restriction sites. So as to generate the DNA strands having the exact sequences we want, it is necessary to select restriction enzymes carefully: First, the remaining base of the cutting site after restriction must match the 5′ or 3′ terminal sequence of the desired DNA strands. Second, the restriction enzymes must create a 5′ overhang at one end of the restriction fragment, and a 3′ overhang at the other end; in this way, the restricted fragments will have different lengths from their complementary strands, thereby facilitating separation in a denaturing gel. We selected restriction enzymes Pst I and Bgl II to digest the PCR product for strand 1 to generate the sequence 5′-GAGCAGCCTGTACGGACATCA-3′, Hae II and Afl II to digest the PCR product for strand 2 to generate the sequence 5′-TCTGATGTGGCTGC-3′ and Nla III and Xba I to digest the PCR product for strand 3 to generate the sequence 5′-ACACCGTACACCGTACACCGT-3′. The cutting sites for those six restriction enzymes are shown in the supplemental information S2. The lengths of the desired sequences are unique in all of the restricted fragments and were readily purified by denaturing gels, as shown in Figure 2.
Figure 1. Schematic Representations of Constructions Used in This Work.
(a) The sequence of the 3-fold symmetric triangle. There are three unique strands, the 21-mer green strands (Strand 1), present three times, the 14-mer magenta strands (Strand 2), also present three times, and the inner dark blue strand (Strand 3), with a 3-fold repeating sequence. The sticky ends are shown in red. (b) The unit to be used for PCR. This is one of the three different units used. Each unit contains PCR primers (red), and four repeats of the same strand (blue). There are five non-coding (NCR) components consisting of 5-6 nucleotides of random sequence (black), and four copies of the strand to be PCR generated (blue), flanked by restriction sites (green and magenta).
Figure 2. Gels Containing PCR Digestion Fragments.
(a) Gel containing the digestion fragments from the PCR products for strand 1 (21mer) and strand 2 (14mer). This is a 20% denaturing gel run at 55 °C in TBE buffer. Lane 1 contains a 10 bp DNA ladder. Lanes 2 and 3 contain the digestion fragments from the PCR products for Strand 1. Lanes 4 and 5 contain the digestion fragments from the PCR products for Strand 2. (b) Gel containing the digestion fragments from PCR products for strand 3 (21mer). This is also a 20% denaturing gel run at 55 °C in TBE buffer. Lane 1 contains 10 bp DNA ladder. Lanes 2 and 3 contain the digestion fragments from the PCR products for Strand 3.
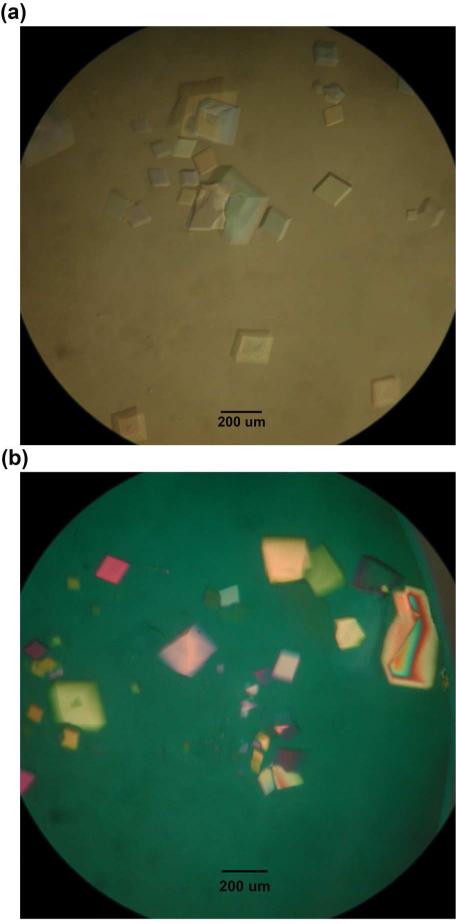
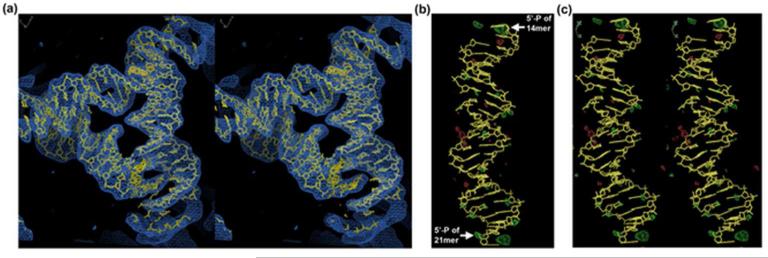
After getting pure DNA strands from PCR and restriction cleavage, we self-assembled the DNA triangle crystal by following the protocol in reference 2. An image of the crystals is shown in Figure 3. After crystals were flash frozen by immersion into liquid nitrogen, X-ray diffraction data were collected on beamline X25 at NSLS to a maximum resolution of 4.5 Å. The diffraction data were processed in space group R3 using HKL-200010 and the structure was determined via molecular replacement using the PHENIX program package.11 The structure was substantially the same as that described in reference 2, as shown in Figure 4a, which shows the electron density produced from the crystals containing PCR-generated strands superimposed on the model of reference 2. Figure 4b contains an electron density difference map between one edge of the PCR-generated molecule and the 3GBI structure used for phase generation. The 5′ phosphate groups are seen prominently as the two green (positive) peaks in the stereographic projection (Figure 4c).
Figure 3. Crystals Produced from PCR-Generated Strands and Synthetic Strands with Phosphate Groups at their 5′ Ends.
(a) This is an optical image of the DNA tensegrity triangle crystals self-assembled from the PCR generated DNA strands. (b) This is an optical image of the DNA tensegrity triangle crystals self-assembled from synthetic DNA strands with phosphate groups at 5′ end. The appearance of both crystals is very much like those in reference 2.
Figure 4. Electron Density Maps of Self-Assembled Crystals from PCR-Generated Strands.
(a) A stereographic projection of the refined model flanked by its electron density. This image shows the whole triangle structure (three asymmetric units) refined from the coordinates of 3GBI. Some electron density is visible in this view from adjacent triangles related by crystal symmetry The electron density map is contoured at 1.5 sigma (b) A single triangle edge showing difference electron density that highlights the phosphate positions. The difference density is calculated from diffraction data from the PCR-generated strands and the synthesis-generated triangle without a phosphate group. The map has been contoured to a level of 3.2 σ; positive features are shown in green, negative features are red. Two positive peaks correspond to the expected locations of the 5′-end phosphate groups. (c) The same image as in (b), shown in stereographic projection.
These peaks are located at the top and bottom of the model shown. The highest green peak at the upper right corner is due to the phosphate at the 5′-end of the 14-mer strand. The smaller peak directly to the left of this one is due to the phosphate at the 5′-end of the 21-mer strand of a symmetry-related molecule. The same features are seen at the bottom of the figure, where the larger peak belongs to a 14-mer of a symmetry related molecule, while the smaller is attributed the 5′-end phosphate of the 21-mer strand. The difference in size might well be due to repositioning of the 5′-hydroxyl group but the resolution of the data does not permit any detailed explanation.
The procedure described above did not emulate the synthetic DNA used in reference 2 exactly. An additional phosphate group remains on the 5′ ends of the strands produced by restriction of the PCR-generated DNA. So as to distinguish which of the factors had led to apparently improved resolution at X25, we synthesized the three strands with 5′ phosphate groups and crystallized them. The comparison of the four crystal forms discussed here is shown in Table 1. The diffraction of 5′-phosphate-containing crystals extends further than the 5 Å observed at the same beam line for the crystals lacking the phosphates in both cases. Indeed, the resolution of crystals self-assembled from the synthetic molecules appears to be slightly better than that from the PCR-generated molecules. Comparison (at the same beam line) suggests that the key element in improvement of crystal quality appears to be the presence of a 5′ phosphate group, not the source of the DNA. The phosphate-containing molecules have yet to be examined at APS-ID19.
Table 1.
Data collection and processing:
| Strands (synchrotron source) | Synthetic without PO4 (APS-ID19)2 | Synthetic without PO4 (NSLS-X25) | PCR with PO4 (NSLS-X25) | Synthetic with PO4 (NSLS-X25) |
|---|---|---|---|---|
| Unit cell (R3) | a = 69.22 Å, α = 101.44° | a = 69 . 14 Å, α = 101.07° | a = 69 . 71 Å, α = 100.82° | a = 69.28 Å, α = 100.96° |
| Volume (Å3) of unit cell | 308708 | 309193 | 318016 | 311493 |
| Content of unit cell | One triangle | One triangle | One triangle | One triangle |
| Resolution (Å) | 17.3-4.0 | 50.0-4.9 | 42.5-4.5 | 50.0-4.1 |
| Wavelength (Å) | 1.00 | 0.98 | 0.98 | 0.98 |
| Redundancy | 7.3 | 9.5 | 18.7 | 9.2 |
| Completeness (%) | 96.1 | 93.9 | 95.2 | 79.4 |
| Rmerge | 0.067 | 0.041 | 0.072 | 0.073 |
| I/σ | 10.9 | 66.5 | 27.7 | 19.6 |
| Refinement statistics: | ||||
| Resolution (Å) | 17.3-4.0 | 22.8-4.9 | 33.3-4.5 | 50.0-4.1 |
| Rwork/Rfree | 0.2400/0.3090 | 0.1906/0.2178 | 0.2144/0.2385 | 0.2257/0.2503 |
| R.m.s.d. of angle and bond | 1.364°/0.016Å | 1.372°/0.004Å | 1.372°/0.004Å | 1.371°/0.004Å |
We have demonstrated that it is possible to produce self-assembled 3D DNA crystals from PCR-generated strands. Crystals self-assembled from those strands diffract better than the synthetic strands of reference 2, under the same conditions. However, the difference cannot be attributed to the differences between synthetic and PCR-generated DNA in this case. Rather, we have shown that it is the presence of a phosphate group on the 5′ end of each strand that results in the improvement of resolution. The important control experiment demonstrating this fact was assembling crystals from synthetic strands containing the phosphate group that diffract at least as well as the PCR-generated strands. The improvement of resolution as a consequence of a phosphate group on the 5′ end is strictly a phenomenological observation, for which we have no explanation at this time.
We have become aware that another group [B. Högberg, personal communication], from the Karolinska Institute and the Wyss Institute, has also generated these crystals from natural DNA [C. Ducani, C. Koul, M. Moche, W.M. Shih and B. Högberg]. Their method of natural DNA preparation is somewhat different from ours, but their electron density appears to be similar to ours. They have not, to our knowledge, examined the impact of phosphorylation on diffraction quality.
Methods
Synthesis and Purification of DNA strands
All DNA templates and primers for PCR were synthesized on an Applied Biosystems 394 DNA synthesizer, removed from the support, and deprotected using routine phosphoramidite procedures. All DNA strands have been purified by denaturing polyacrylamide gel electrophoresis.
Polymerase Chain Reaction
Phusion High-Fidelity PCR Master Mix with HF Buffer (New England Biolabs) was used in all of PCR by following supplier's protocol. All products of PCR were purified by 8% nondenaturing polyacrylamide gel.
Restriction Reaction
Restriction enzymes (Pst I, Bgl II, Hae II, Afl II, Nla III and Xba I) were purchased from New England Biolabs and used in buffers suggested by the supplier. All of restricted products were purified by 20% denaturing polyacrylamide gel.
Crystallization
Crystals were grown from 80-μl sitting drops in a thermally controlled incubator containing 6 μM DNA, 30 mM sodium cacodylate, 50 mM magnesium acetate, 50 mM ammonium sulphate, 5 mM magnesium chloride and 25 mM Tris (pH 8.5), equilibrated against a 1.5 ml reservoir of 1.4 M ammonium sulphate. Crystals were obtained by slow annealing, in which the temperature was decreased from 60°C to room temperature (~20°C) with a cooling rate of 0.2°C per hour over a period of 7days, during which the volume of the drop diminished by about 90%.
Data collection
Crystals were transferred to a cryosolvent of 30% glycerol, 400 mM ammonium sulphate, 40 mM MgCl2 and 50 mM Tris and were flash frozen by immersion into liquid nitrogen. X-ray diffraction data were collected at beam line NSLS-X25 of the National Synchrotron Light Source (Brookhaven National Laboratory, Upton, New York, USA).
Structure Solution
The diffraction data were processed in space group R3 using HKL-2000 and molecular replacement (MR) was done by using PHENIX program package and the search model was the previously determined DNA triangle structure (PDB code 3GBI). The resulting model from MR was first refined with rigid body strategy and then TLS (translation/libration/screw) parameters with restrained helices and base pairs. The PHENIX program package was used to generate electron density maps.
Supplementary Material
Acknowledgements
We thank Dr. Björn Högberg for pre-publication information about the crystallographic study performed by him and his colleagues on crystals of this system derived from natural DNA. We acknowledge support by grant GM-29554 from NIGMS, grants CTS-0608889 and CCF-0726378 from the NSF, grant W911FF-08-C-0057 from ARO, via Pegasus Corporation, MURI W911NF-07-1-0439 from ARO, grants N000140910181 and N000140911118 from ONR and DE-SC0007991 from DOE. The National Synchrotron Light Source, Brookhaven National Laboratory is supported by the U.S. Department of Energy under contract No.DE-AC02-98CH10886.
Footnotes
Supporting Information Available: Supporting information contains the following sections: S1, a gel showing the purified PCR products; S2 the restriction enzymes used to obtain the strands; S3, the constructs for the PCR templates, and the restricted fragments; and S4, the sequences of the PCR templates and primers. This material is available free of charge via the Internet at http://pubs.acs.org.
References
- 1.Seeman NC. Nucleic Acid Junctions and Lattices. J. Theor. Biol. 1982;99:237–247. doi: 10.1016/0022-5193(82)90002-9. [DOI] [PubMed] [Google Scholar]
- 2.Zheng J, Birktoft JJ, Chen Y, Wang T, Sha R, Constantinou PE, Ginell SL, Mao C, Seeman NC. From molecular to macroscopic via the rational design of a self-assembled 3D DNA crystal. Nature. 2009;461:74–77. doi: 10.1038/nature08274. [DOI] [PMC free article] [PubMed] [Google Scholar]
- 3.Liu D, Wang W, Deng Z, Walulu R, Mao C. Tensegrity: Construction of rigid DNA triangles with flexible four-arm junctions. J. Am. Chem. Soc. 2004;126:2324–2325. doi: 10.1021/ja031754r. [DOI] [PubMed] [Google Scholar]
- 4.Wang T, Sha R, Birktoft JJ, Zheng J, Mao C, Seeman NC. A DNA crystal designed to contain two molecules per asymmetric unit. J. Am. Chem. Soc. 2010;132:15471–15473. doi: 10.1021/ja104833t. [DOI] [PMC free article] [PubMed] [Google Scholar]
- 5.Nguyen N, Birktoft JJ, Sha R, Wang T, Zheng J, Constantinou PE, Ginell SL, Chen Y, Mao C, N.C. Seeman NC. The Absence of Tertiary Interactions in a Self-Assembled DNA Crystal Structure. J. Mol. Recognition. 2012;25:234–237. doi: 10.1002/jmr.2183. [DOI] [PMC free article] [PubMed] [Google Scholar]
- 6.Wang H, Di Gate RJ, Seeman NC. An RNA Topoisomerase. Proc. Nat. Acad. Sci. (USA) 1996;93:9477–9482. doi: 10.1073/pnas.93.18.9477. [DOI] [PMC free article] [PubMed] [Google Scholar]
- 7.Wang H, Di Gate RJ, Seeman NC. The Construction of an RNA Knot and its Role in Demonstrating that E. coli DNA Topoisomerase III is an RNA Topoisomerase. In: Sarma RH, Sarma MH, editors. Structure, Motion, Interaction and Expression of Biological Macromolecules. Adenine Press; New York: 1998. pp. 103–116. [Google Scholar]
- 8.Wu G, Jonoska N, Seeman NC. Construction of a DNA Nano-Object Directly Demonstrates Computation. Biosystems. 2009;98:80–84. doi: 10.1016/j.biosystems.2009.07.004. [DOI] [PMC free article] [PubMed] [Google Scholar]
- 9.Caruthers MH. Gene synthesis machines: DNA chemistry and its uses. Science. 1985;230:281–285. doi: 10.1126/science.3863253. [DOI] [PubMed] [Google Scholar]
- 10.Otwinowski Z, Minor W. Processing of X-ray diffraction data collected in oscillation mode. Methods Enzymol. 1997;276:307–326. doi: 10.1016/S0076-6879(97)76066-X. [DOI] [PubMed] [Google Scholar]
- 11.Adams PD, Grosse-Kunstleve RW, Hung L-W, Ioerger TR, McCoy AJ, Moriarty NW, Read RJ, Sacchettini JC, Sauter NK, Terwilliger TC. PHENIX: building new software for automated crystallographic structure determination. Acta Cryst. 2002;D58:1948–1954. doi: 10.1107/s0907444902016657. [DOI] [PubMed] [Google Scholar]
Associated Data
This section collects any data citations, data availability statements, or supplementary materials included in this article.


