

Abstract
The pharmacokinetic disposition of a dietary cancer chemopreventive compound dibenzoylmethane (DBM) was studied in male Sprague-Dawley rats after intravenous (i.v.) and oral (p.o.) administrations. Following a single i.v. bolus dose, the mean plasma clearance (CL) of DBM was low as compared to the hepatic blood flow. DBM displayed a high volume of distribution (Vss). The elimination terminal t1/2 was long. The mean CL, Vss and AUC0-∞/dose were similar between the i.v. 10 and 10 mg/kg doses. After single oral doses (10, 50, and 250 mg/kg), the absolute oral bioavailability (F*) of DBM was 7.4 to 13.6%. The increase in AUC was not proportional to the oral doses, suggesting non-linearity. In silico prediction of oral absorption also demonstrated low DBM absorption in vivo. An oil-in-water nanoemulsion containing DBM was formulated to potentially overcome low F* due to poor water solubility of DBM, with enhanced oral absorption. Finally, to examine the role of Nrf2 on the pharmacokinetics of DBM since DBM activates the Nrf2-dependent detoxification pathways, the Nrf2 wild-type (+/+) mice and Nrf2 knockout (−/−) mice were utilized. There was an increased systemic plasma exposure of DBM in Nrf2 (−/−) mice, suggesting that Nrf2 genotype could also play a role in the pharmacokinetic disposition of DBM. Taken together, our results show that DBM has low oral bioavailability which could be due in part to poor water-solubility and this could be overcome by nanotechnology-based drug delivery system and furthermore Nrf2 genotype could also play a role in the pharmacokinetics of DBM.
Introduction
Dibenzoylmethane (DBM, 1,3-diphenyl-propanedion), as shown in Figure 1, is a natural phytochemical found as a minor constituent in the root of licorice [1]. It is a beta-diketone compound with a variety of anti-cancer activities. DBM has been reported to suppress the 7,12-dimethylbenz[a]anthracene (DMBA)-induced and estradiol (E2)-induced mammary tumorgenesis both in vivo and in vitro [2–6]. The potential mechanisms of preventing DMBA-induced mammary tumor by DBM include its inhibition of DMBA metabolism and the formation of DMBA-DNA adducts, as well as facilitating the excretion of DMBA-related toxic metabolites by inducing Phase II detoxification enzymes [3; 4]. DBM also has been shown to inhibit E2-induced cell proliferation in human breast cancer cells and mouse mammary glands through the E2-ER-ERE dependent pathway [2]. Moreover, DBM has also been used as a sunscreen to prevent the injurious effects of overexposure to solar radiation. It has the anticarcinogenic effects in TPA-induced skin inflammation/tumor promotion in a mouse model [5]. Induction of Phase I/Phase II enzymes was considered as one major mechanism of how DBM could block/retard the carcinogenesis process. In a rat model, both Phase II enzymes including glutathione transferases and NAD(P)H: quinine reductase were induced by consumption of 1% DBM diet [6]. In addition, DBM was also able to modulate Phase I enzymes cytochromes P450 (CYP) 1A1, 1A2, and 1B1 [7; 8]. DBM has also been found to inhibit cell growth and to induce cell cycle arrest in human prostate cancer cells [9] and human colon cancer cells [10]. A recent investigation in our lab revealed that DBM could significantly inhibited intestinal and colon tumorigenesis in ApcMin/+ mice [11, 12].
Figure 1.
Chemical structure of DBM.
Although DBM has been recognized as a very promising cancer chemopreventive agent, to our knowledge, the pharmacokinetics of DBM has not been reported. Recently, we have developed and validated an HPLC-UV analytical method to quantify the concentrations of DBM in rat plasma [13]. Using this method, we evaluated the in vivo pharmacokinetics of DBM following i.v. and oral administrations in the rats. In order to enhance the drug absorption across the gastrointestinal tract following oral administration, the nanoparticle emulsion containing DBM was developed and higher bioavailability (F*) value was obtained with this nanoemulsion.
A recent study has found that DBM activates Nrf2-dependent signaling pathways [14]. Nrf2 belongs to the CNC (Cap-N-Collar) family of transcription factors and possess a highly conserved basic region-leucine zipper (bZip) structure. Its important role in the regulation of the expression of many mammalian drug metabolizing/detoxifying, transporters (e.g., multidrug resistance-associated proteins, MRP and organic anion-transporting polypeptide, OATPs) and antioxidant enzymes under oxidative or electrophilic stress has been verified in different Nrf2-deficient mice experiments, in which the expression of these enzymes are dramatically attenuated and the Nrf2 knockout (−/−) mice are more susceptible to carcinogen-induced carcinogenesis (reviewed in [15–18]). Our present study shows that Nrf2 has substantial impact on the in vivo disposition of DBM in mice.
Materials and Methods
Chemicals
1,3-Diphenyl-1,3-propanedione (dibenzoylmethane, DBM, ) and internal standard (I.S.) 1-(5-Chloro-2-hydroxy-4-methylphenyl)-3-phenyl-1,3-propanedione (CHMPP), Uridine 5-diphosphoglucuronic acid trisodium salt (UDPGA), Nicotinamide adenine dinuclotide phosphate (NADP), glucose 6-phosphate, glucose-6-phosphate dehydrogenase, MgCl2 were purchased from Sigma-Aldrich (St. Louis) at purity of more than 98%. Acetonitrile and methanol were all HPLC grade from Fisher Scientific. Trifluoroacetic acid (TFA) was spectrophotometric grade (> 99%, Aldrich, WI, USA). Ethyl acetate was purchased from Sigma with purity of 99.9%. Other chemicals used in this study were all in analytical grade unless specified.
Intravenous and oral administrations of DBM to rats
Male Sprague-Dawley rats weighing between 250–300 g with implanted jugular vein cannulae were purchased from Hilltop Laboratory Animals Inc. (Scottdale, PA USA). The rats were housed at Animal Care Facility of Rutgers University under 12 h light-dark cycles with free access to food and water. Upon arrival, rats were given AIN-76A diet (Research Diets, NJ, USA) free of antioxidant and acclimatized for 3 days. Rats (n = 3 or 4) were fasted overnight and given DBM at doses of 10, 50 and 250 mg/kg in a vehicle of Cremophor EL/tween-80/ethanol/water (2:1:1:6, v/v/v/v) or nanoemulsion (250 mg/kg only) by oral gavages (p.o.). Separate group of rats (n = 3 or 4) were also given DBM at doses of 10 and 20 mg/kg in the same vehicle as the intravenous (i.v.) route through the jugular vein cannulae. Blood samples (200 μL) were collected at 2 (i.v. only), 7.5, 15, 30 min, 1, 1.5, 2, 4, 6, 8, 12, 24, and 36 h post-dose. Plasma was separated immediately by centrifugation and stored at − 80°C until analysis.
Blood cell partitioning
The blood to plasma partitioning ratio (CB/CP) for DBM was performed in fresh, pooled rat blood obtained from Bioreclamation Inc (Hicksville, NY). DBM (1000 μg/mL) in methanol was spiked into blood at a ratio of 1:100 to give a final concentration of 10 μg/mL. Samples were incubated at 37°C in a shaking water bath for 2 h. Plasma was separated immediately by centrifugation and analyzed by HPLC-UV detection method. This experiment was carried out in triplicate.
Intra-peritoneal and oral administrations of DBM to mice
Age-matched (10~15 weeks old) male Nrf2 wild type C57BL/6J (+/+) mice and Nrf2 knockout C57BL/6J (−/−) mice were used. Mice were bred at the Nelson Animal Facility (wild type) and Animal Facility of Laboratory for Cancer Research (Nrf2 knockout) at Rutgers University. After weaning, mice were housed at Rutgers University Animal Facility at Gordon Road under 12 h light/dark cycles with free access to food and water. Mice were given AIN-76A diet 3 days before the experiments. The study was designed by a composite blood sampling approach. For oral administration, mice were fasted overnight and given DBM at a dose of 500 mg/kg in a vehicle of Cremophor EL/tween-80/ethanol/water (2:1:1:6, v/v/v/v) by oral gavages. Mice were also given DBM at dose of 100 mg/kg in the same vehicle by intraperitoneal (i.p.) injection. Blood samples were collected at time point of 2 (i.p. only), 7.5, 15, 30 min, 1, 1.5, 2, 4, 6, 8, 12, 24, and 36 h post-dose by heart puncture. Three mice were used for each time point in the pharmacokinetic studies. Plasma was separated immediately by centrifugation and stored at −80°C until analysis.
Preparation of DBM in nanoparticle vehicle
The components of the emulsion were DBM/tween 20/glycerol monooleate medium-chain triglycerides (MCT)/water (2:3:3:15:77, v/v/v/v). DBM was first dissolved in the MCT. The aqueous phase was mixed to ensure complete dissolution of all additives. Subsequently, the MCT and the water mixture were mixed by stirring for ~ 1 min. After mixing, the crude emulsion was homogenized by high speed homogenizer (24,000 rpm) for ~1 min. Finally, the emulsion was passed through a high pressure homogenizer (1500 bar) for 10 cycles (70 nm). The hydrodynamic oil droplet diameter in DBM-containing nanoemulsion was measured using a light scattering method with ZetaPALS system (Holtville, NY). Average particle size was found to be 100 to 110 nm.
HPLC analysis of DBM
Rat plasma concentrations of DBM were determined by a validated HPLC-UV detection method [13]. Briefly, a 50 μL aliquot of the plasma samples was spiked with the internal standard (CHMPP) working solution and extracted twice with 200 μL ethyl acetate/methanol (95:5, v/v) solution. The organic layer was separated by centrifugation and evaporated to dryness under nitrogen gas at room temperature. The residue was reconstituted in 100 μL of acetonitrile/water (50:50, v/v) solution, and 20 μL was injected onto a HPLC column. Analyses were performed using a Shimadzu HPLC system at 4°C with a reverse phase column (Gemini™ C18 column, 150 × 2.0 mm, 5-μm, Phenomenex, Torrance, CA USA) protected with a SecurityGuard™ cartridge system (Phenomenex) and a 0.45-μm in-line filter. The binary gradient mobile phase (mobile phase A: water/methanol (80:20, v/v) with 0.1 % TFA and mobile phase B: acetonitrile with 0.1 % TFA) were pumped at the flow rate of 0.2 mL/min. The UV detector was set at a single wavelength of 335 nm. The Class-VP software version 7.1.1 (Shimadzu, MD USA) was used for instrument control and data analysis. The retention time for DBM and internal standard (CHMPP) were 21.4 and 24.0 min, respectively. The lower limit of quantification for DBM was 0.05 μg/mL and limit of detection was 10 ng/mL. The linear calibration curves were obtained in the concentration range of 0.05–20 μg/mL. The intra- and inter-day precision and accuracy determination of quality control samples were below 15%.
Pharmacokinetic analysis
The DBM plasma concentration data was analyzed by a non-compartmental analysis using WinNonlin 4.0 software (Pharsight, CA USA) to obtain the pharmacokinetic parameters. The peak plasma concentrations (Cmax) and times they occurred (Tmax) were recorded. The area under the plasma concentration versus time curve (AUC0-t) from time zero to the time of last measured concentration (Clast) was determined using the log-linear trapezoidal rule. The AUC zero to infinite (AUC0-∞) was obtained by the addition of AUC0-t and the extrapolated area calculated by Clast/kel. The elimination rate constant (kel) was estimated from the slope of terminal phase and the half-life (t1/2) was calculated using the equation t1/2 = ln2/kel. The mean residence time (MRT) was calculated as AUMC0-∞/AUC0-∞, where AUMC0-∞ is the area under the first moment versus time curve. Clearance (CL) was estimated by Dose/AUC0-∞ from i.v administration. The volume of distribution at steady state (Vdss) was calculated as CL × MRTIV. The maximum plasma concentration (Cmax) and the time to reach the Cmax were obtained directly from the plasma concentration-time profile. The absorption rate (ka) was calculated using Gastroplus software (Simulationplus, Lancaster, CA). by simultaneous fitting with a three-compartment model.. The absolute bioavailability (F*) was determined by the ratio of the dose-normalized AUC0-∞ following oral and intravenous administration. Deconvolution analysis was performed in conjunction with a 3-compartmental analysis of DBM data obtained from with the i.v. administration at 10 mg/kg.
In silico prediction of physicalchemical properties of DBM
The prediction of the physico-chemical properties of DBM was performed in GastroPlus™ software, version 6.0 (Simulationplus, Lancaster, CA). Chemical structure was compiled with ISIS Draw software, version 2.5 (MDL Information System, Los Altos, CA)
Preparation of liver microsomes
Pooled Nrf2 wild type (+/+) or Nrf2 knockout (−/−) C57BL/6J mice liver (3 g) were thawed in 12 ml potassium phosphate buffer (0.1 M, pH 7.4, 0.125 M KCl, 1.0 mM EDTA and 0.25 M sucrose), cut into small pieces with blade and homogenized with a rotor homogenizer ( 10 strikes) on ice. Homogenates were then centrifuged at 4°C for 20 min using a Soval SS34 rotor (9000 rpm, about 10,000 g), the supernatant was poured into a new ultra-centrifugation tube and ultra-centrifugation was performed at 43,000 rpm (100,000 g) using the Ti90 rotor on a Beckman ultracentrifugation machine for 90 min at 4°C. The supernatant were stored at −80°C as cytosol fraction. The pellet was washed with washing buffer (0.1M Tris-HCl, pH 7.4, 0.125 M KCl and 1 mM EDTA) once and ultracentrifuged for 60 min with the same conditions described above. The resulted pellet (microsome) was resuspended in 1 ml of stocking buffer (0.25 M sucrose, 0.1 mM ETDA), and the microsomes were stored at −80°C after protein concentration determination, until further analyses as described below.
In vitro liver microsomes stability assay
The stability of DBM was examined in pooled mouse microsomes in the presence of NADPH and UPDGA. Mouse liver microsomes (1 mg protein/mL) in 100 mM potassium phosphate buffer (pH 7.4) were preincubated with DBM (50 μM, final concentration) for 5 min in a water bath with shaking speed of 100 rpm at 37°C. The reactions were initiated by the addition of an NADPH-generating system (at a final concentration of 1 mM NADP+, 10 mM glucose 6-phosphate, 2 U/mL glucose-6-phosphate dehydrogenase, 10 mM magnesium chloride), with UDPGA (4 mM), with the final volume of the reaction mixture of 500 μL. Reactions were carried out for 1 h: A 50 μL of reaction mixture was sampled at different time point (0, 2, 5, 10, 20, 30 and 45 min) during the incubation and mixed with 200 μL ethyl acetate/methanol mixture (95:5, v/v) twice to extract DBM. After centrifugation, pooled supernatants were dried under a stream of nitrogen gas and reconstituted in 100 μL of acetonitrile/water (50:5, v/v) before subjecting to HPCL/UV analysis as described earlier.
Statistical analysis
Statistical analysis was conducted using a one-way ANOVA followed by Bonferroni’s test or Student t-test using SigmaPlot, V11. Statistical significance was set at p < 0.05.
Results and Discussion
The dietary compound DBM is a minor constituent in licorice and possesses potent anti-carcinogenesis effect. However, many basic properties of this compound, such as pharmacokinetics of DBM, are still unknown. In the present study, we investigated the dose-dependent plasma systemic exposure and oral bioavailability (F*) of DBM in a rat model with doses range from 10 to 250 mg/kg. As the predicted solubility of DBM is very low (22 μg/mL), we also tested the bioavailability of DBM in the nanoparticle emulsion.
The mean plasma concentration-time profiles of DBM after an i.v. administration of 10 and 20 mg/kg in rats are shown on Figure 2A. The pharmacokinetic parameters determined by a noncompartmental analysis are summarized in Table 1. Following a single i.v. administration at dose of 10 and 20 mg/kg, AUC0-∞ values were 16.5 ± 7.85 and 27.9 ± 2.40 μg·h/mL, respectively. The dose-normalized plasma concentration-time profiles, presented in Figure 2B, were superimposable. In addition, the mean values of dose-normalized AUC0-∞ were 1.65 and 1.40 (μg · h/mL)/(mg/kg) at doses of 10 and 20 mg/kg, which is not significantly different between 10 and 20 mg/kg (p > 0.05). These results suggest that DBM follows linear pharmacokinetics within the dose range tested in male rats. Following a single i.v. administration at dose of 10 and 20 mg/kg, DBM was eliminated with a systemic plasma clearance of 0.71 ± 0.32 and 0.72 ± 0.07 L/h/kg, respectively. The terminal t1/2 were 14.4 ± 5.00 and 12.0 ± 5.34 h, respectively. The plasma clearance and half-life of DBM remain unchanged with increased doses, again suggesting linear pharmacokinetics of DBM in rats after an i.v. administration. The steady state volume of distribution (Vdss) of DBM was 6.75 ± 1.85 and 7.35 ± 4.26 L/kg at doses of 10 and 20 mg/kg, respectively. The values are greater than total body water of 0.67 L/kg, suggesting that DBM may be widely distributed into tissues. The extensive tissue distribution of DBM may result from its structural properties of lipophilicity (log P 2.7). Mean residence time (MRT) value of DBM after the i.v. 10 mg/kg was calculated to be 10.4 ± 3.33 h, which was similar to that of the 20 mg/kg dose (10.2 ± 6.10 h). Overall, DBM shows very similar pharmacokinetic patterns between the 10 and 20 mg/kg due to its linear pharmacokinetics.
Figure 2.


(A)The mean plasma concentration-time profiles of DBM after intravenous administration. Rats were dosed intravenously with 10 or 20 mg/kg of DBM. Data are expressed as mean ± SD, n = 4. (B) The dose-normalized mean plasma concentration-time profiles of DBM in rats after intravenous administration. Rats were dosed with 10 or 20 mg/kg of DBM.
Table 1.
Pharmacokinetics characteristics of DBM after intravenous (i.v.) administration.
| Parameters | Dose, mg/kg | |
|---|---|---|
| 10 | 20 | |
| Number of animals | 4 | 4 |
| CL, L/h/kg* | 0.71 ± 0.32 | 0.72 ± 0.07 |
| VSS, L/kg* | 6.75 ± 1.85 | 7.35 ± 4.26 |
| AUC0-∞, μg·h/mL | 16.5 ± 7.85 | 28.0 ± 2.40 |
| AUC0-∞ /Dose, (μg·h/mL)/(mg/kg)* | 1.65 ± 0.79 | 1.40 ± 0.12 |
| Terminal t1/2, h* | 14.4 ± 5.00 | 12.0 ± 5.34 |
| MRT, h* | 10.4 ± 3.33 | 10.2 ± 6.10 |
No significant difference from corresponding parameters between two groups (p > 0.05)
The blood-to-plasma concentration ratio (CB/CP) of DBM in the rats was 0.93 ± 0.19, after a 2 h-incubation at 37°C. DBM appears to be equally distributed between plasma and blood cells in the rats. The systemic blood clearance of DBM was calculated to be about 12.7 mL/min/kg. Therefore, the hepatic extraction ratio (EH) was estimated in the range of 0.16–0.25 using literature values of hepatic blood flow in the rat (QH, about 55–80 mL/min/kg) [19; 20], suggesting DBM is a low-clearance compound with a poor extraction through the liver in Sprague-Dawley rats.
The mean plasma concentration-time profiles of DBM after single oral administrations of 10, 50, and 250 mg/kg in rats are shown on Figure 4. The noncompartmental analysis was performed to obtain the basic pharmacokinetic parameters as listed in Table 2. Following an oral administration at 10, 50 and 250 mg/kg, DBM reached Cmax of 0.34 ± 0.04, 1.50 ± 0.41, and 2.88 ± 0.74 μg/mL at Tmax of 2.00 ± 1.35, 2.00 ± 0.00, and 3.33 ± 1.15 h, respectively. The AUC0-∞ values were 2.25 ± 0.33, 9.46 ± 1.62, 30.4 ± 6.89 μg·h/mL at doses of 10, 50, and 250 mg/kg, respectively. The increase of Cmax and AUC0-∞ were less than dose-proportional, suggesting possible of absorption-limited pharmacokinetic properties of DBM at higher oral doses. This absorptive mechanism of DBM may involve capacity-limited uptake transport system and may reach the saturation at the highest dose. Thus, the absorption could be the rate-limiting step when DBM is administered orally. Based on data from oral and i.v. administrations of 10 mg/kg, absorption rate constant ka was estimated to be 0.026 h−1. This result suggests that absorption of DBM was relatively slow in the rats with the current emulsion vehicle. The value of ka dropped to 0.005 ± 0.0015 h−1 at dose level of 250 mg/kg, suggesting a slower absorption at high dose. The slow absorption process could result from the precipitation of DBM from vehicle in the GIT. Such an event might be more significant at high dose levels, which cause lower oral bioavailability. However, further future in vitro experiments are required to prove these above assumptions.
Figure 4.


(A) The mean plasma concentration-time profiles of DBM after oral administration in nanoemulsion or regular emulsion with 250 mg/kg of DBM. Data are expressed as mean ± SD, n = 4. (B) DBM cumulative fraction absorbed (Fabs) after oral administration in nanoemulsion or regular emulsion with 250 mg/kg
Table 2.
Pharmacokinetics characteristics of DBM after oral administration.
| Parameters | Dose, mg/kg | |||
|---|---|---|---|---|
| 10 | 50 | 250 | 250 (nanoemulsion) | |
| Number of animals | 4 | 3 | 4 | 4 |
| Tmax, h | 2.00 ± 1.35 | 2.00 ± 0.00 | 4.0 ± 2.0 | 1.67 ± 0.29 |
| Cmax, μg/mL | 0.34 ± 0.04 | 1.50 ± 0.41 | 3.02 ± 0.66 | 4.00 ± 1.07 |
| AUC0-∞, μg·h/mL | 2.25 ± 0.33 | 9.46 ± 1.62a | 30.4 ± 6.89a | 94.2 ± 24.8b |
| AUC0-∞ /Dose, (μg·h/mL)/(mg/kg) | 0.225 ± 0.033 | 0.199 ± 0.032a | 0.122 ± 0.027a | 0.377 ± 0.099b |
| Apparent terminal | 11 ± 3.0 | 9.3 ± 2.0 | 11 ± 8.0 | 10 ± 8.2 |
| t1/2, h | ||||
| MRT, h | 7.6 ± 2.3 | 9.4 ± 2.0 | 12 ± 4.3 | 10 ± 6.8 |
| Ka, h−1 | 0.026 ± 0.044 | 0.029 ± 0.046 | 0.0005 ± 0.0015 | 0.014 ± 0.018 |
| F*, % | 13.6 ± 2.3 | 11.5 ± 1.94 a | 7.38 ± 1.66 a | 22.8 ± 6.0 b |
Significant difference from corresponding parameters in comparison to 10 mg/kg in regular emulsion (p< 0.05)
Significant difference from corresponding parameters between groups of 250 mg/kg in regular emulsion versus nanoemulsion (p< 0.05)
Following single oral doses of DBM at 10, 50, and 250 mg/kg, respectively, the absolute bioavailability (F*) of DBM was estimated to be 13.6, 11.5 and 7.38%, respectively (Table 2). The F* of DBM declined with increasing doses, and reduction of F* was statistically significant as the dose increased. Reduction of F* might result from the lower fraction being absorbed at the higher dose as discussed above. This low oral F* of DBM in the rats might be related to its poor absorption in the GIT.
The fraction absorbed (Fabs) is determined mainly by the solubility and stability of the drug in the GIT and the permeability across the intestinal membrane. We performed in silico prediction of in vivo absorption of DBM using software GastroPlus (Simulations, CA). DBM is a lipophilic drug with the Log P value of 2.7 and Log D value is 2.72 at pH 6.8, calculated by GastroPlus. The pKa of DBM was predicted to be 8.64, so it is a weak acid that might precipitate in the stomach. The solubility of DBM was predicted to be as low as 22 μg/mL at pH6.8.
The predicted absorption of DBM by Gastroplus software in rat jejunum was about 17.6% and total absorption in GI tract was about 36.0% at the dose of 100 mg/kg (Fig. 5). Results from in silico prediction further confirmed the notion that poor absorption in GIT would cause the low bioavailability. In order to identify whether the low absorption was caused by either low permeability or low solubility, we performed parameter sensitivity analysis with Gastroplus software. The result demonstrated that fraction absorbed of DBM was equally sensitive to permeability and solubility (data not shown).
Figure 5.

In silico prediction of compartmental absorption of DBM in GI tract after oral administration in regular emulsion with 100 mg/kg of DBM in rats.
Since it would be difficult to improve the permeability of DBM at this point, in the present study, we formulated the drug in nanoemulsion made with monooleate medium-chain triglycerides in order to enhance the absorption of DBM in this study. The mean plasma concentration-time profiles after oral administration of DBM with nanoemulsion and regular emulsion at 250 mg/kg are shown in Fig. 4A with some relevant pharmacokinetic parameters listed in Table 2. The mean plasma concentration of DBM with nanoemulsion reached its peak at ~1.7 h (Tmax), as compared to a Tmax of 3.3 h with regular emulsion. The ka value increased to 0.014 ± 0.018 h−1 with nanopartical formulation as compared to 0.0005 ± 0.0015 h−1 with regular emulsion. These results indicate that DBM administrated in the nanoemulsion was absorbed much faster than in the regular emulsion. The plasma concentrations of DBM with nanoemulsion were numerically higher than those with regular emulsion at all investigated time points post orally dosing. The AUC0-∞ values of orally dosed DBM in nanoemulsion and regular emulsion were 94.2 ± 24.8 and 30.4 ± 6.89 μg·h/mL, respectively. Statistically, AUC of DBM in nanoemulsion was significantly higher than that in regular emulsion (Table 2). As compared to the bioavailability of 7.38% of DBM in regular emulsion upon oral administration, the oil-in-water (o/w) nanoemulsions of DBM afforded the bioavailability of 22.8%, which was 3-fold higher than the regular emulsion of DBM. Next, we performed a deconvolution analysis using WinNonlin software. As shown in Fig. 4B, the fraction absorbed in GIT was about 23.4% with nanoparticle emulsion, compared to 10.8% with regular emulsion. Furthermore, the slope of the absorption curve with nanoparticle emulsion was steeper than regular emulsion, indicating a faster absorption rate. The nanoparticle formulation of DBM might have resulted better solubility, thus could achieve improved absorption in GIT. The results lend support to our initial speculation that poor absorption of DBM in GIT could have contributed considerably to the low F* in rats.
Our findings pointed out that the nanoparticle emulsion is more effective in increasing the absorption and exposure of DBM in rats. Nanoparticle drug delivery system for DBM seems to be effective in increasing the absorption in rats and increasing exposure. With increasing interest in DBM as a potential cancer chemopreventive agent, there is a growing necessity to address certain factors about its chemical and pharmacokinetics properties, such as its poor aqueous solubility, resulting in low ka and bioavailability. Therefore, we proposed a new drug delivery system, one that uses the nanotechnology in an effort to overcome the possible problem of DBM precipitating out of the drug delivery vehicle due to its poor solubility in water and to increase the absorption of DBM in GIT. The results of this study indicate that the nanoparticle emulsion may be a promising strategy to deliver DBM more efficiently.
Similar to many isothiocyanates cancer chemopreventive compounds, the pharmacodynamic/chemopreventive activity of DBM appears to be closely related to its activation of Nrf2-mediated drug metabolizing/detoxifying, and antioxidant enzymes. However, the impact of Nrf2 knockout genotype on the pharmacokinetics of drugs has not been investigated. T h i s is important particularly for the long-term therapeutics use of chemopreventive compounds which are Nrf2 activators. Therefore, we compared the pharmacokinetics of DBM in Nrf2 (+/+, wildtype) and Nrf2 (−/−, knockout) mice. The DBM mean plasma concentration-time profiles are shown in Fig. 6A. The basic pharmacokinetics parameters obtained from the non-compartment analysis are listed in Table 3. The terminal half-life of DBM in Nrf (+/+) mice was 6 h, which was shorter than that in the rats. After an i.p. administration of DBM at 100 mg/kg, the concentration of DBM reached its peak of 4.56 μg/mL (20.4 μM) at 15 min. After an oral administration of DBM at 500 mg/kg, the concentration of DBM reached its peak of 17.4 μg/mL (77.5 μM) at 15 min (Fig.7A). In the Nrf2 (−/−) mice, as compared to that in the Nrf2 wild type mice, not only the peak concentration, mean plasma concentrations, but also the mean plasma concentrations at the earlier time points were always lower than their respective concentrations in the wild type mice (Fig. 6B). This interesting phenomenon suggests that DBM has poorer oral absorption in Nrf2 knockout mice than that in the wild type C57BL6J mice. However, in contrast to the early time points, the mean plasma concentrations of DBM at later time points were consistently higher in the Nrf2 knockout mice (Fig. 6B), suggesting that the Nrf2 knockout mice might metabolize DBM slower than the wild type mice. Similarly, the mean plasma concentrations of DBM were always higher in the Nrf2 knockout mice than that in the wild type mice after the i.p. administration (Fig. 6A). This phenomenon was also accompanied with a 2-fold increase in the apparent terminal half-life and a 2.3-fold increase of the plasma AUC0-∞ (Table 3) in Nrf2 knockout mice after the i.p. administration. Since the i.p. administration avoids the small intestinal absorption as well as the metabolic processes as commonly encountered after the oral administration, these results suggest that the Nrf2 knockout mice might have poorer intestinal absorption and slower systemic elimination process for DBM as compared with that in Nrf2 wild type mice. It has been shown previously that sulforaphane, another potent activator of Nrf2 [21–24], induces cytochrome P450 enzymes, therefore the Nrf2 deficiency could possibly result in a decrease of Vmax in the overall enzyme kinetics involved in the metabolism of DBM in the liver and or extra-hepatic, resulting in slower systemic elimination process.
Figure 6.


(A) The mean plasma concentration-time profiles of DBM in Nrf2(+/+) and Nrf2(−/−) C57BL/6J mice after oral (p.o.) and intraperitoneal (i.p.) administration. Data are expressed as mean ± SD, n = 3 or 4. (B) DBM plasma concentrations at early time points (from 2 min to 1 h). (C) Genetic impact of Nrf2 on the stability of DBM (50 μM) in mouse liver microsomes.
Table 3.
Pharmacokinetic parameters of DBM in Nrf2(+/+) and Nrf2(−/−) C57BL/6J mice after an oral (500 mg/kg) and intraperitoneal (100 mg/kg) administration by a noncompartment analysis.
| Route | p.o. | i.p. | ||
|---|---|---|---|---|
| Genotype | Nrf2(+/+) | Nrf2(−/−) | Nrf2(+/+) | Nrf2(−/−) |
| Number of animals | 3 | 3 | 3 | 3 |
| Cmax, μg/mL | 23.2 | 17.4 | 4.56 | 6.86 |
| Tmax, h | 0.25 | 0.25 | 0.25 | 0.25 |
| AUC, μg·h/mL | 64.6 | 85.6 (↑1.3)* | 9.62 | 22.1 (↑2.3)* |
| AUC0-∞ /Dose, (μg·h/mL)/(mg/kg) | 0.129 | 0.171 | 0.096 | 0.221 |
| Apparent terminal t1/2, h | 6.09 | 8.52 | 2.35 | 5.04 |
| MRT, h | 4.73 | 6.36 | 2.76 | 5.15 |
folds increase over the Nrf2(−/−) mice, P > 0.05
The two major Phase II conjugating enzyme sulfotransferase SULT1B1 and UDP-glucuronyltransferase UGT2B5 were shown to be down-regulated by 2.5- and 2.3-fold in the liver of Nrf2 knockout mice (unpublished data in our lab). DBM appears to be hydroxylated by cytochrome P450 enzymes and then forms conjugates by sulfation and glucuronidation (unpublished observations). Since forming more water-soluble Phase II conjugates after Phase I metabolism is one of the most important pathways to eliminate xenobiotics (such as toxins and drugs), the impaired expression of SULT1B1 and UGT2B5 in the Nrf2 knockout mice liver might cause the significant accumulation of DBM phase I metabolite (hydroxylated DBM); increased concentration of Phase I reaction products may also slowdown the metabolism of DBM by the Phase I enzymes (product inhibition). To validate this speculation, we next performed a stability assay of DBM (50 μM) in liver microsomes from Nrf2 (+/+) and Nrf2 (−/−) mice. As shown in Fig. 6C, in the presence of NADPH and UDPGA, the Nrf2(−/−) liver microsomes metabolized the DBM at 50 μM slower than the Nrf2 (+/+) liver microsomes. After an oral administration of 500 mg/kg DBM, DBM concentration were in the range of 31~95 μM within 4 h after dosing, therefore, we chose 50 μM DBM for testing. Using Gastroplus simulation, the liver concentration of DBM was estimated to be about 2-fold higher than its plasma concentrations (data not shown). The impaired liver microsomal activity in Nrf2 knockout mice at higher DBM concentration may cause more accumulation of DBM in Nrf2 knockout mice, which could be of the explanations for the higher concentrations of DBM observed in Nrf2 knockout mice at later time points. Taken together, the changes in expression of Phase II conjugating enzymes caused by genetic knockout of Nrf2 gene could contribute to alteration of the pharmacokinetics profile of DBM in mice, which resulted in an overall increased of DBM plasma exposure (AUC0-∞) in the Nrf2 knockout mice.
In conclusion, the pharmacokinetics of DBM was studied after a single i.v. and oral administration in the rats. DBM demonstrated linear pharmacokinetics in the dose range from 10 to 20 mg/kg following i.v. administration. DBM is a low CL natural dietary compound with a relatively long half-life. DBM has a low oral bioavailability (below 13 %) and appears to be distributed quite extensively to the tissues in the rats. Higher F* of DBM was achieved with a nanoparticle emulsion, which appears to overcome its poor absorption in the GIT. The potential differential gene expression of Phase II conjugating enzymes caused by the deficiency of Nrf2 gene in mice could lead to alteration of the pharmacokinetic profiles of DBM, which results in an overall increase in DBM plasma level and exposure.
Figure 3.
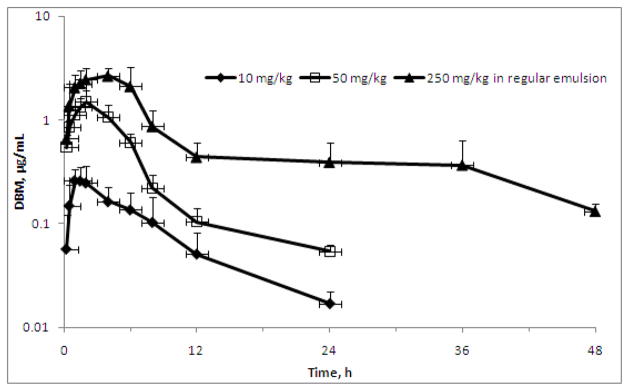
The mean plasma concentration-time profiles of DBM after oral administration. Rats were dosed by oral gavage with 10, 50, or 250 mg/kg of DBM. Data are expressed as mean ± SD, n = 3 or 4.
Acknowledgments
This study was supported in part by NIH Grants R01-CA094828 and R01-CA118947. The authors thank Pin-Wen Wang at Novartis for her assistance in statistics as well as the reviewers for the very constructive comments during the review of this manuscript.
References
- 1.Fukai T, Nomura T. Five isoprenoid-substituted flavonoids from Glycyrrhiza eurycarpa. Phytochemistry. 1994;35:515–519. [Google Scholar]
- 2.Lin CC, Tsai YL, Huang MT, et al. Inhibition of estradiol-induced mammary proliferation by dibenzoylmethane through the E2-ER-ERE-dependent pathway. Carcinogenesis. 2006;27:131–136. doi: 10.1093/carcin/bgi199. [DOI] [PubMed] [Google Scholar]
- 3.Lin CC, Lu YP, Lou YR, et al. Inhibition by dietary dibenzoylmethane of mammary gland proliferation, formation of DMBA-DNA adducts in mammary glands, and mammary tumorigenesis in Sencar mice. Cancer Lett. 2001;168:125–132. doi: 10.1016/s0304-3835(01)00506-7. [DOI] [PubMed] [Google Scholar]
- 4.Lin CC, Ho CT, Huang MT. Mechanistic studies on the inhibitory action of dietary dibenzoylmethane, a beta-diketone analogue of curcumin, on 7,12-dimethylbenz[a]anthracene-induced mammary tumorigenesis. Proc Natl Sci Counc Repub China B. 2001;25:158–165. [PubMed] [Google Scholar]
- 5.Huang MT, Lou YR, Xie JG, et al. Effect of dietary curcumin and dibenzoylmethane on formation of 7,12-dimethylbenz[a]anthracene-induced mammary tumors and lymphomas/leukemias in Sencar mice. Carcinogenesis. 1998;19:1697–1700. doi: 10.1093/carcin/19.9.1697. [DOI] [PubMed] [Google Scholar]
- 6.Singletary K, MacDonald C, Iovinelli M, Fisher C, Wallig M. Effect of the beta-diketones diferuloylmethane (curcumin) and dibenzoylmethane on rat mammary DNA adducts and tumors induced by 7,12-dimethylbenz[a]anthracene. Carcinogenesis. 1998;19:1039–1043. doi: 10.1093/carcin/19.6.1039. [DOI] [PubMed] [Google Scholar]
- 7.MacDonald CJ, Ciolino HP, Yeh GC. Dibenzoylmethane modulates aryl hydrocarbon receptor function and expression of cytochromes P50 1A1, 1A2, and 1B1. Cancer Res. 2001;61:3919–3924. [PubMed] [Google Scholar]
- 8.Dinkova-Kostova AT, Talalay P. Relation of structure of curcumin analogs to their potencies as inducers of Phase 2 detoxification enzymes. Carcinogenesis. 1999;20:911–914. doi: 10.1093/carcin/20.5.911. [DOI] [PubMed] [Google Scholar]
- 9.Jackson KM, DeLeon M, Verret CR, Harris WB. Dibenzoylmethane induces cell cycle deregulation in human prostate cancer cells. Cancer Lett. 2002;178:161–165. doi: 10.1016/s0304-3835(01)00844-8. [DOI] [PubMed] [Google Scholar]
- 10.Pan MH, Huang MC, Wang YJ, Lin JK, Lin CH. Induction of apoptosis by hydroxydibenzoylmethane through coordinative modulation of cyclin D3, Bcl-X(L), and Bax, release of cytochrome c, and sequential activation of caspases in human colorectal carcinoma cells. J Agric Food Chem. 2003;51:3977–3984. doi: 10.1021/jf034094i. [DOI] [PubMed] [Google Scholar]
- 11.Shen G, Khor TO, Hu R, et al. Chemoprevention of familial adenomatous polyposis by natural dietary compounds sulforaphane and dibenzoylmethane alone and in combination in ApcMin/+ mouse. Cancer Res. 2007;67:9937–9944. doi: 10.1158/0008-5472.CAN-07-1112. [DOI] [PubMed] [Google Scholar]
- 12.Khor TO, Yu S, Barve A, et al. Dietary feeding of dibenzoylmethane inhibits prostate cancer in transgenic adenocarcinoma of the mouse prostate model. Cancer Res. 2009;69:7096–7102. doi: 10.1158/0008-5472.CAN-09-0597. [DOI] [PubMed] [Google Scholar]
- 13.Shen G, Hong JL, Kong AN. Development and validation of an HPLC method for the determination of dibenzoylmethane in rat plasma and its application to the pharmacokinetic study. J Chromatogr B Analyt Technol Biomed Life Sci. 2007;852:56–61. doi: 10.1016/j.jchromb.2006.12.042. [DOI] [PubMed] [Google Scholar]
- 14.Thimmulappa RK, Rangasamy T, Alam J, Biswal S. Dibenzoylmethane activates Nrf2-dependent detoxification pathway and inhibits benzo(a)pyrene induced DNA adducts in lungs. Med Chem. 2008;4:473–481. doi: 10.2174/157340608785700199. [DOI] [PubMed] [Google Scholar]
- 15.Khor TO, Huang MT, Prawan A, et al. Increased susceptibility of Nrf2 knockout mice to colitis-associated colorectal cancer. Cancer Prev Res. 2008;1:187–91. doi: 10.1158/1940-6207.CAPR-08-0028. [DOI] [PMC free article] [PubMed] [Google Scholar]
- 16.Shen G, Kong AN. Nrf2 plays an important role in coordinated regulation of Phase II drug metabolism enzymes and Phase III drug transporters. Biopharm Drug Dispos. 2009;30:345–55. doi: 10.1002/bdd.680. [DOI] [PMC free article] [PubMed] [Google Scholar]
- 17.Kobayashi M, Yamamoto M. Molecular mechanisms activating the Nrf2-Keap1 pathway of antioxidant gene regulation. Antioxid Redox Signal. 2005;7:385–94. doi: 10.1089/ars.2005.7.385. [DOI] [PubMed] [Google Scholar]
- 18.Zhang DD. Mechanistic studies of the Nrf2-Keap1 signaling pathway. Drug Metab Rev. 2006;38:769–89. doi: 10.1080/03602530600971974. [DOI] [PubMed] [Google Scholar]
- 19.Davies B, Morris T. Physiological parameters in laboratory animals and humans. Pharm Res. 1993;10:1093–1095. doi: 10.1023/a:1018943613122. [DOI] [PubMed] [Google Scholar]
- 20.Grundy JS, Eliot LA, Foster RT. Extrahepatic first-pass metabolism of nifedipine in the rat. Biopharm Drug Dispos. 1997;18:509–522. doi: 10.1002/(sici)1099-081x(199708)18:6<509::aid-bdd38>3.0.co;2-5. [DOI] [PubMed] [Google Scholar]
- 21.Hanlon N, Okpara A, Coldham N, Sauer MJ, Ioannides C. Modulation of rat hepatic and pulmonary cytochromes P450 and phase II enzyme systems by erucin, an isothiocyanate structurally related to sulforaphane. J Agric Food Chem. 2008;56:7866–7871. doi: 10.1021/jf801456h. [DOI] [PubMed] [Google Scholar]
- 22.Hu R, Hebbar V, Kim BR, et al. In vivo pharmacokinetics and regulation of gene expression profiles by isothiocyanate sulforaphane in the rat. J Pharmacol Exp Ther. 2004;310:263–271. doi: 10.1124/jpet.103.064261. [DOI] [PubMed] [Google Scholar]
- 23.Paolini M, Perocco P, Canistro D, et al. Induction of cytochrome P450, generation of oxidative stress and in vitro cell-transforming and DNA-damaging activities by glucoraphanin, the bioprecursor of the chemopreventive agent sulforaphane found in broccoli. Carcinogenesis. 2004;25:61–67. doi: 10.1093/carcin/bgg174. [DOI] [PubMed] [Google Scholar]
- 24.Yoxall V, Kentish P, Coldham N, et al. Modulation of hepatic cytochromes P450 and phase II enzymes by dietary doses of sulforaphane in rats: Implications for its chemopreventive activity. Int J Cancer. 2005;117:356–362. doi: 10.1002/ijc.21191. [DOI] [PubMed] [Google Scholar]