

Abstract
Background
Physician-reported performance status (PS) is an important prognostic factor, and frequently influences treatment decisions. The extent, prognostic importance, and predictors of disagreements in PS assessment between physicians and patients have not been adequately examined.
Methods
Using NCCTG clinical trial data from 1987–1990, we compared PS (ECOG and Karnofsky [KPS]) and nutrition scores reported by physicians and patients individually. Differences were analyzed using paired t-test and degree of disagreement by kappa statistic. Effect of disagreement on overall survival was determined by Kaplan-Meier method and Cox regression analysis. Predictors of disagreement were identified by logistic regression.
Results
1,636 patients with advanced lung and colorectal cancer had a median survival of 9.8 months (95% CI, 9.4 to 10.4). Percent disagreement between patients and physicians about KPS, ECOG PS, and nutrition score was 67.1%, 56.6% and 58.0% respectively. Physicians were more likely to rate patients better than individual patients were to rate themselves: ECOG (Mean 0.91 vs. 1.30, p<.0001), KPS (Mean 83.3 vs. 81.7, p<0.0001), nutrition score (Mean 1.6 vs. 2.1, p<0.0001). Disagreement between patients and their physicians was associated with increased risk of death: KPS (HR 1.16, 95% CI 1.04 to 1.30, p=0.008) and nutrition scores (HR 1.44, 95% CI 1.29 to 1.61, p<0.0001) after adjustment for covariates. Patient socio-demographic factors that predict disagreement were identified.
Conclusions
Physicians and patients frequently disagree about PS and nutritional status. Disagreement is associated with an increased risk of death in patients with advanced malignancies. These findings illustrate the limitations of physician-only assessed PS.
Keywords: performance status, patient-physician communication, prognosis, survival, advanced cancer, Karnofsky, ECOG
INTRODUCTION
Performance status (PS) is a commonly utilized prognostic factor in advanced malignancies. Several investigators have evaluated the validity and reliability of the Karnofsky Performance Status (KPS) and found that a low KPS (≤ 50) predicts death within a relatively short period of time and that there is a direct relationship between the KPS and survival1, 2. The KPS has been applied in cancer research to select and stratify patients for inclusion in treatment trials, to measure the efficacy of treatment, and to estimate prognosis.
Similarly, the Eastern Cooperative Oncology Group Performance Status Scale (ECOG PS) is widely used to assess the functional status of cancer patients. Both the KPS and the ECOG PS scales are highly correlated3, 4, and are used interchangeably; the ECOG PS is often preferred for its simplicity.
The KPS has varying degrees of inter-rater reliability, with differences noted depending on the setting (home vs. clinic) of assessment5. Importantly, PS is routinely assessed by the clinician and, as a rule, has not been reported by patients in past studies.
Like poor performance status, the presence of anorexia has been validated as a marker of poor prognosis in patients in terminally ill cancer patients6. Anorexia and cachexia affect up 87% of patients with malignancies and has been implicated as a contributor to cancer-related mortality7. Nutritional impairment correlates with the response to therapy and may be directly related to therapeutic results and severity of treatment-related toxicity8. Despite its prognostic value, nutritional status is not routinely evaluated in most oncologic settings by either physicians or patients.
Loprinzi and colleagues developed an instrument to measure patient-reported ECOG PS, KPS, and appetite/food intake. Using a Cox proportional hazards model, they demonstrated that patient and physician-reported ECOG PS, KPS, and nutritional assessments independently provide strong predictive information about survival. Importantly, patient-judged PS and nutrition was found to be complementary to, but not interchangeable with, physician judged PS and nutrition. Furthermore, this study raised important questions about the extent to which physician and patient scores agreed (and disagreed) about PS and nutrition; it also raised questions about the meaning of these disagreements9.
A small, single institution study by Blagden and colleagues of consecutive patients with a suspected diagnosis of lung cancer assessed agreement between patients and their oncologists using ECOG PS. They reported a weighted kappa of 0.45 (95% CI 0.33, 0.59), indicating a moderate degree of agreement10. Although the authors concluded that patients in that study were “marginally less optimistic” than their oncologists, the study was too small in number to draw meaningful statistical conclusions.
The goals of this current study was to use a large patient cohort within a multi-institutional research setting to evaluate the extent to which patients and physicians disagree about PS and nutritional assessments, to characterize the direction of such disagreement, to identify patient social demographic factors that predict disagreement, and to determine if disagreement is associated with an increased risk of death.
Making use of the statistical power of large patient numbers, this study also evaluated the frequency of ratings over different PS and nutrition scores. It compared the measurement techniques themselves as well as the operating characteristics of patient versus physician reports of PS as predictors of patient survival, in order to gauge if patient report adds precision to physician reported PS.
While previous studies have focused on comparing patient- and physician-reported performance status, the focus on understanding the nature and implications of disagreement between patients and their physicians is the novel aim of this investigation.
METHODS
Patients and Performance Status
Sixteen hundred and thirty six patients with advanced colorectal and lung cancer from six NCCTG cancer treatment trials for advanced incurable cancer conducted between the years of 1987 and 1990 were included in this study.
The original research involved the development of a 30-item questionnaire completed by both patients and physicians for purposes of refinement. The previously published results used variable selection and model building using data from 1,560 patients and demonstrated that the following subset of four items was prognostic for survival: physician assessment of (1) performance status and (2) likelihood of survival, (3) patient assessments of performance status, and (4) patients' report of food intake/appetite9, 11.
Patients' performance status (ECOG and Karnofsky) scores and nutritional status scales were completed by both physicians and patients themselves once at the time of study enrollment into each of the respective trials. Physician-reported assessments were recorded by the attending medical oncologist as part of routine pre-trial screening. Information from patients was collected using a questionnaire developed by Loprinzi and colleagues to ask patients to rate their own ECOG PS, KPS, and food intake/appetite. No formal training was provided to physicians or patients. Nurse investigators closely evaluated the patient-completed questionnaires and documented the questions that patients had difficulty understanding or answering. These questions were subsequently reworded or refined for better patient lay clarification. At the same time, patients were also provided a questionnaire in which they defined their own religious faith and activity, level of education, working status, and depression using check marks. For depression, possible answers were, “Half the time or more” or “No or seldom”. The checked answers were subsequently collected and tabulated9.
Definitions of ECOG score (0, 1, 2, 3 and 4) and Karnofsky score (100, 90, 80, 70, 60, 50, 40, 30) in physician and patient assessment forms were virtually identical. The patient-reported food intake score, which had six response options (1, 2, 3, 4, 5, 6), was modified to match the physician-completed nutrition score, which had only five response options (0, 1, 2, 3, 4). Briefly, a patient's food intake score of 1 or 2 (increased or the same) was recoded to match a physician's nutrition score of 0 (normal); a patient's score of 3 (slightly reduced) was recoded to match a physician's score of 1 (slightly impaired); a patient's score of 4 (moderately reduced) was recoded to match a physician's score of 2 (moderately impaired); a patient's score of 5 (markedly reduced) was recoded to match a physician's score 3 (considerable impaired); and a patient's score of 6 (severely reduced) was recoded to match a physician's score 4 (severely impaired).
Identical scores between physician and patient on prognostic performance and nutritional status were defined as physician-patient agreement; score discrepancies between physician and patient were identified as any physician-patient disagreement.
Statistical Analysis
Statistical analyses were performed by SAS version 9.1 (SAS Inc., Cary, NC). Overall survival (OS) was calculated from the date of enrollment to the date of death or last follow-up. The distributions of scores from both the physician and the patient as well as the proportions of levels of discrepancy were examined using frequency analysis. The degree of score difference and agreement between the physician- and the patient-completed ECOG and Karnofsky performance status scores as well as between the physicians' nutritional scores (nutrition) and the modified patients' food intake scores (food intake) were examined by a paired t-test and a Kappa statistic. The impact of physician-patient disagreement and factors with significant influence on OS were determined by the Kaplan-Meier method and Cox regression. The potential association between patients' social-demographic factors and physician-patient disagreement were assessed by logistic regression. All reported p values are two-sided and a value of p <0.05 was considered significant.
RESULTS
Patient Social-Demographic Factors and Their Association with Overall Survival
1,636 patients (55% male and 97% white) were entered onto this study. The patients were concurrently participating in one of six clinical trials for advanced lung cancer or advanced colorectal cancer. Their median age was 63 years, with a range of 17 to 85 years.
The median survival of the enrolled patients was 9.8 months (95% CI 9.4 to 10.4 months). The median follow-up time for patients alive (n=55) at last contact was 4.45 years (range 1.2 to 6.9 years). The median follow-up time for patients dead at last contact was 9.5 months (range 0.03 months to 5.4 years). Physician data were available for all 1636 patients. Patient-reported data were available for over 95% of patients. Of the patient social-demographic factors listed in Table 1, male gender, older age, inability to work prior to retirement, and depression were significantly associated with shorter median overall survival.
Table 1.
| Factors* | Distribution | KM Survival Estimation | P Value* |
|---|---|---|---|
| No. Pt (%) | Median (Months) | (Log-rank) | |
| Age (Years) | |||
| Median | 63 | ||
| Younger that 55 | 346 (21) | 9.9 | 0.03 |
| 55 to 64 | 534 (33) | 10.9 | |
| 65 to 69 | 333 (21) | 10.3 | |
| 70 or older | 399 (25) | 8.3 | |
| Race | |||
| White | 1405 (97) | 9.8 | NS |
| Other | 47 (3) | 9.5 | |
| Sex | |||
| Male | 900 (55) | 8.7 | <0.0001 |
| Female | 713 (44) | 11.4 | |
| Working Status | |||
| Work full-time | 295 (20) | 12.2 | <0.0001 |
| Work part-time | 227 (15) | 10.8 | |
| Unable to work | 286 (19) | 7.1 | |
| Retired | 706 (47) | 9.7 | |
| Education | |||
| Less than high school | 535 (34) | 9.5 | NS |
| High school | 621 (40) | 10.6 | |
| Less than college | 249 (16) | 9.6 | |
| College or higher | 164 (10) | 9.4 | |
| Religious Faith | |||
| Strong | 883 (58) | 9.6 | NS |
| Average | 442 (29) | 10.4 | |
| Low | 189 (12) | 10.1 | |
| Religious Activity | |||
| Very active | 566 (36) | 9.6 | NS |
| Average | 576 (37) | 10.5 | |
| Not active | 416 (27) | 9.8 | |
| Depression | |||
| Half the time or more | 415 (27) | 8.3 | 0.01 |
| No or seldom | 1123 (73) | 10.2 |
P > 0.15 listed as not significant (NS)
Agreement and Disagreement between Physicians and Patients
More than half of patients disagreed with their physician on ECOG PS, KPS or nutritional assessment (56.6%, 67.1% and 58.0%, respectively).
When there was disagreement, physicians were more likely to rate patients better than patients were to rate themselves better in all three scores: ECOG PS (MD better 75.1% vs. patient better 24.9%), Karnofsky score (MD better 57.4% vs. patient better 42.6%) and nutritional score (MD better 75.4% vs. patient better 24.6%) [data not shown]. Mean physicians' ratings of patients were better than mean patients' ratings of themselves in all three variables and the mean differences between physician and patient ratings were significant: ECOG PS (Mean 0.91 vs. 1.30, p<0.0001), KPS (Mean 83.3 vs. 81.7, p<0.0001), food intake/nutritional status (Mean 1.6 vs. 2.1, p<0.0001). Weighted kappa revealed only fair agreement between patients and physicians in KPS, ECOG PS, and food intake/nutrition score (Kappa: 0.30, 0.35, and 0.26, respectively)12. The distribution, direction of disagreement, and levels of discrepancy are detailed in Table 2.
Table 2.
| Difference | Frequency | Percent | Kappa Statistic |
|---|---|---|---|
| ECOG PS | |||
| Level of Difference | |||
| Physician rated better by 1 level | 497 | 31.9 | 0.30 |
| Physician rated better by 2 levels | 149 | 9.6 | |
| Physician rated better by 3 levels | 16 | 1.03 | |
| Physician-Patient agreed | 677 | 43.4 | |
| Patient rated better by 1 level | 209 | 13.4 | |
| Patient rated better by 2 levels | 10 | 0.6 | |
| Patient rated better by 3 levels | 1 | 0.1 | |
| Mean Score ± Std, Physician / Patient | 0.9 ± 0.7 / 1.3 ± 1.0 | ||
| Mean Difference ± Std* | −0.4 ± 0.9 | ||
|
| |||
| Karnofskv PS | |||
| Level of Difference | |||
| Physician rated better by 1 level | 367 | 23.6 | 0.35 |
| Physician rated better by 2 levels | 192 | 12.3 | |
| Physician rated better by 3 levels | 32 | 2.1 | |
| Physician rated better by 4 levels | 9 | 0.6 | |
| Physician-Patient agreed | 512 | 32.9 | |
| Patient rated better by 1 level | 315 | 20.2 | |
| Patient rated better by 2 levels | 100 | 6.4 | |
| Patient rated better by 3 levels | 28 | 1.8 | |
| Patient rated better by 4 levels | 1 | 0.1 | |
| Patient rated better by 5 levels | 1 | 0.1 | |
| Mean Score ± Std, Physician / Patient | 83.3 ± 11.9 / 81.7 ± 13.4 | ||
| Mean Difference ± Std* | 1.6 ± 12.7 | ||
|
| |||
| Nutrition/Food Intake Score | |||
| Level of Difference | |||
| Physician rated better by 1 level | 417 | 26.6 | 0.26 |
| Physician rated better by 2 levels | 198 | 12.6 | |
| Physician rated better by 3 levels | 77 | 4.9 | |
| Physician rated better by 4 levels | 18 | 1.2 | |
| Physician-Patient agreed | 649 | 41.4 | |
| Patient rated better by 1 level | 181 | 11.6 | |
| Patient rated better by 2 levels | 27 | 1.7 | |
| Mean Score ± Std, Physician / Patient | 0.7 ± 0.7 / 1.2 ± 1.2 | ||
| Mean Difference ± Std* | −0.5 ± 0.9 | ||
P (paired t test) <0.0001
Although the mean scores, proportion of physician-patient agreement and levels of discrepancy presented in Table 2 revealed that, overall, physicians were more likely to rate patients better than individual patients were to rate themselves, in a minority of patients the opposite occurred and patients rated themselves better than their physicians rated them. The distribution of both physician- and patient-rated scores are graphically displayed in Figure 1 and revealed that physicians more frequently rated patients better than patients rated themselves when patients had relatively good performance and nutritional status. Conversely, patients whose performance and nutritional status were poor were more likely to rate themselves better than their physicians rated them. A similar pattern was found in all three scores.
Figure 1.
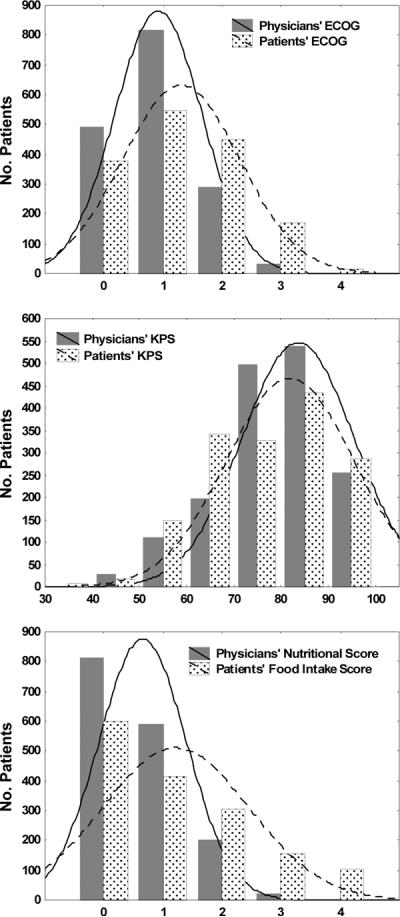
Frequency of Physician and Patient PS Scores
Survivorship by Agreement Status
Figure 2 displays Kaplan-Meier estimated overall survival curves by agreement status for KPS and nutrition. Patients who disagreed with their physician had inferior survivorship when compared to those who agreed on KPS (median survival: 9.4 vs. 11.8 months, p=0.002) and food intake/nutritional status (median survival: 8.0 vs. 12.5 months, p<0.0001).
Figure 2.

Kaplan-Meier Estimates of Survival By Agreement Status and Levels of Disagreement
* All p values presented in this table are from Logrank test
Overall survivorships by levels of discordance are displayed in Figure 2. Patients who rated their own nutritional status at least two levels better (n=27) than did their physicians had shorter survival than whose who rated themselves one level better (median OS 8.7 vs. 9.6 months, p=0.04). This subset of patients was found to have worse nutritional status, based on the frequency analysis displayed in Figure 1. A similar pattern was also observed in KPS. Agreement status for ECOG PS was not significantly associated with survivorship.
Risk of death remained significantly higher for patient and physician disagreement on KPS (HR=1.16, 95% CI, 1.04 to 1.30, p=0.008) and food intake/nutritional status (HR=1.44, 95% CI, 1.29 to 1.61, p<0.0001), after adjustment of age, gender, working status and depression. Data for survivorship by agreement status are presented in Table 3.
Table 3.
| KM Estimation | Cox Regression | ||||||
|---|---|---|---|---|---|---|---|
| Score | 1 Year (%) | Median (Months) | P value (Logrank) | Unadjusted | Adjusted* | ||
| Hazard Ratio (95% CI) | P value | Hazard Ratio (95% CI) | P value | ||||
| ECOG | |||||||
| Agree | 42.7 | 10.3 | 1 | 1 | |||
| Disagree | 39.8 | 9.6 | NS | 1.04 (0.94, 1.15) | NS | 1.02 (0.91, 1.13) | NS |
| KPS | |||||||
| Agree | 49 | 11.8 | 1 | 1 | |||
| Disagree | 37.5 | 9.4 | 0.002 | 1.15 (1.03, 1.27) | 0.01 | 1.16 (1.04, 1.30) | 0.008 |
| Food Intake/Nutritional Status | |||||||
| Agree | 51.3 | 12.5 | 1 | 1 | |||
| Disagree | 34.1 | 8.0 | <0.0001 | 1.41 (1.28, 1.56) | <0.0001 | 1.44 (1.29, 1.61) | <0.0001 |
Adjusted for age, sex, working status and depression
Patient Social-Demographic Factors as Predictors of Disagreement
The association of patient-physician disagreement with specific patient social-demographic factors is displayed in Table 4. A univariate analysis revealed that patients not working full-time (working part-time, unable to work, or retired) were more likely to disagree than those who work full-time across all three scores. In addition, age, less than a high school education and self-reported depression more than half the time were also potentially associated with patient-physician disagreement.
Table 4.
| Factors | ECOG | Karnofsky | Food Intake/Nutrition | ||||||
|---|---|---|---|---|---|---|---|---|---|
| OR of Death | (95% CI) | P Value | OR | (95% CI) | P value | OR | (95% CI) | P value | |
| Age (Year) | |||||||||
| Younger that 55 | 1 | 1 | 1 | ||||||
| 55 to 64 | 1.38 | (1.05, 1.83) | 0.02 | 1.13 | (0.85, 1.51) | NS | 1.15 | (0.84, 1.47) | NS |
| 65 to 69 | 1.07 | (0.78, 1.45) | NS | 1.21 | (0.87, 1.67) | NS | 0.97 | (0.71, 1.32) | NS |
| 70 or older | 1.14 | (0.85, 1.53) | NS | 1.32 | (0.96, 1.80) | NS | 1.22 | (0.91, 1.65) | NS |
|
| |||||||||
| Race | |||||||||
| White | 1 | 1 | 1 | ||||||
| Other | 1.34 | (0.72, 2.50) | NS | 1.02 | (0.55, 1.92) | NS | 0.93 | (0.50, 1.63) | NS |
|
| |||||||||
| Sex | |||||||||
| Male | 1 | 1 | 1 | ||||||
| Female | 1.14 | (0.93, 1.40) | NS | 0.93 | (0.75, 1.15) | NS | 0.92 | (0.75, 1.13) | NS |
|
| |||||||||
| Working Status | |||||||||
| Work full-time | 1 | 1 | 1 | ||||||
| Work part-time | 1.66 | (1.17, 2.35) | 0.005 | 1.44 | (1.00, 2.07) | 0.05 | 1.84 | (1.30, 2.62) | 0.0007 |
| Unable to work | 5.40 | (3.74, 7.77) | <0.0001 | 1.92 | (1.36, 2.73) | 0.0003 | 3.06 | (2.17, 4.32) | <0.0001 |
| Retired | 2.08 | (1.58, 2.75) | <0.0001 | 1.57 | (1.18, 2.07) | 0.002 | 1.99 | (1.51, 2.63) | <0.0001 |
|
| |||||||||
| Education | |||||||||
| Less than high school | 1.69 | (1.19, 2.41) | 0.004 | 0.98 | (0.67, 1.43) | NS | 1.27 | (0.89, 1.82) | NS |
| High school | 1.28 | (0.90, 1.81) | NS | 0.84 | (0.58, 1.22) | NS | 1.16 | (0.82, 1.65) | NS |
| Less than college | 1.01 | (0.68, 1.50) | NS | 1.12 | (0.73, 1.72) | NS | 1.3 | (0.87, 1.94) | NS |
| College or higher | 1 | 1 | 1 | ||||||
|
| |||||||||
| Religion Activity | |||||||||
| Faith | |||||||||
| Strong | 0.93 | (0.68, 1.28) | NS | 0.84 | (0.59, 1.18) | NS | 0.90 | (0.65, 1.24) | NS |
| Average | 0.94 | (0.67, 1.33) | NS | 0.75 | (0.52, 1.09) | NS | 0.79 | (0.55, 1.12) | NS |
| Low | 1 | 1 | 1 | ||||||
| Involvement | |||||||||
| Very active | 0.84 | (0.64, 1.08) | NS | 0.81 | (0.62, 1.07) | NS | 0.84 | (0.65, 1.09) | NS |
| Average | 0.8 | (0.62, 1.03) | NS | 0.74 | (0.56, 0.98) | NS | 0.83 | (0.64, 1.08) | NS |
| Not active | 1 | 1 | 1 | ||||||
|
| |||||||||
| Depression | |||||||||
| Half the time or more | 1.58 | (1.24, 1.99) | 0.0001 | 1.2 | (0.94, 1.53) | 0.15 | 1.90 | (1.50, 2.42) | <0.0001 |
| No or Seldom | 1 | 1 | 1 | ||||||
P > 0.15 listed as not significant (NS)
A complete, appropriate multivariate analysis was not possible to assess independent predictors of disagreement, as physician social-demographic data (i.e. physician age, years in practice, nature of practice [academic or community-based], etc.) was not collected.
DISCUSSION
In performance status assessment, clinician report has historically been considered the gold standard1, 2, 13. This stands in contrast to quality of life, where patient assessment has become the gold standard after it was shown that patients are more reliable and consistent at scoring their own quality of life than are their physicians14, 15. Similarly, physician reporting of adverse treatment effects has been shown to lack both sensitivity and specificity and routine reliance on physicians alone to assess adverse effects of therapy has been questioned16.
Previous investigators have found that patient-judged ECOG PS, KPS, and appetite/food intake scores all provide independent prognostic survival information that is complementary to clinician reported data9. There has been very little attention devoted, however, to understanding the disagreement between patients and their physicians with respect to these assessments.
This is the first study to demonstrate that the mean differences between physicians' ratings of patients and patients' ratings of themselves across KPS, ECOG PS and nutrition scores were significant, and that the overall mean of physicians' ratings was better than the mean of patients' ratings in the setting of advanced cancer.
Furthermore, when patients disagree with their physicians about PS and nutritional assessments, the disagreement tends to be in the direction of physicians rating patients better, rather than vice-versa17. These are similar findings to that of symptom research studies, that consistently show that physicians and nurses underestimate symptom frequency and severity in comparison with patient ratings18–21.
Similarly, our results parallel the findings of Christakis and colleagues that doctors are routinely overly optimistic in their estimates of survival of terminally ill patients by a factor of about five22.
One can hypothesize reasons why clinicians would rate patients better than patients rate themselves. Bias may be introduced if treatment is assigned to patients on the basis of the physician-assessed PS or nutrition score. Specifically, in the setting of a clinical trial, a worse PS or poorer nutritional status might affect candidacy for experimental therapies. Alternatively, a busy clinical practice setting might hamper precise assessment of PS and nutrition by providers.
Our finding that a subset of patients rate their PS and nutrition as better than their physicians is no less important. Several investigations evaluating physicians' prognostic estimates versus those of advanced cancer patients have shown a substantial discrepancy between the two23, with patients tending to be comparatively over-optimistic. Such over-optimism can lead to misunderstanding the intent of treatment as curative versus palliative24, 25, or the pursuit of medically futile therapies26.
This study was able to identify patient-specific factors (working status, level of education and depression) that potentially predicted disagreement about PS and nutrition. This raises the question of whether physician PS assessment can be biased by socio-demographic patient factors. Such discordance may also be explained by patients with lesser education having difficulty interpreting the assessment questions themselves.
Patients with self-reported depression may have had psychological co-morbidity that, while undiagnosed by their oncologist, did impact their functional status. We are unaware of data examining the connection between depression and performance status. However, self-reported depression is prevalent among cancer patients27, and can negatively impact response to treatment28.
Sensitivity analysis of these data suggests that both patients and physicians have similar sensitivity in their ability to predict survival at 3 years (data not shown).
Furthermore, we are unaware of any evidence demonstrating superior accuracy of either patient or physician reporting with respect to their ability to predict survival. Prior investigations have found that both patient and physician KPS and nutritional status scores are highly significant, independent predictors of death (P<0.0001)9 and that patients' report of performance status and appetite supplement the predictive power of physician-reported ECOG PS for survival9. In the absence of evidence demonstrating superior sensitivity or predictive ability of patient assessment, we cannot conclude that patient-reported PS or nutritional status should replace physician assessment as the gold standard.
To the best of our knowledge, this is the first study to demonstrate that disagreement in performance and nutritional status assessment is itself adversely prognostic. From this study, the reasons why disagreement was associated with poorer survival are not evident.
Considering the central role that performance status plays in decisions to recommend for or against chemotherapy, inaccurate assessment of performance and nutritional status could have influenced therapeutic decisions in some patients. In the current trial, it is not clear to what extent this occurred and if patient outcomes were impacted.
There may be value in routinely collecting patient-reported PS and nutritional data at the point of care. Studies of computerized prompters suggest that clinical information presented selectively at the point of care is more likely to affect patient care decisions, particularly when it is patient specific 29.
Anorexia, affects both the quality and quantity of life of many patients with advanced cancer 30, 31. Allowing patients to routinely report food intake data at the point of care may not only create an opportunity for the clinician to intervene therapeutically 32, 33, but also to identify an adverse prognostic factor, with which to refine their clinical estimate of prognosis 6.
LIMITATIONS
This study has limitations that are important to note. As a secondary data analysis this study is able to demonstrate significant associations but is not able to prove causality. These data are thus more useful for hypothesis generation than as a basis for change of clinical practice.
Although significant discordance was seen in clinician versus patient reporting of ECOG PS, the discordance did not adversely affect survival to a statistically significant degree, as it did with KPS and nutritional assessment. Although, the ECOG assessment tool has been well-validated in a prospective fashion versus the Karnofsky instrument 3, 4, patients and physicians may have differing interpretations of the ECOG PS questions. For example, “up and about more than 50% of the waking hours,” may be interpreted as “not in bed 50% of waking hours.” This could result in a frequency of disagreement that is comparable to the other scoring instruments, but result in different consequences of such disagreement.
We acknowledge that the role of working status as a predictor disagreement may be confounded by comorbidities. The absence of these data as well as that of physician-specific social-demographic factors limited our ability to perform an appropriate multivariate analysis of the predictors of disagreement, as these data were not collected prospectively.
The study sample was 97% Caucasian and therefore these results may not be generalizable to other races or ethnic groups.
CONCLUSIONS
In advanced cancer, accurate assessment of performance status is critical for prediction of survival and clinical decision making. Often, performance status assessment drives physician estimates of the probability that palliative chemotherapy will be helpful and guides choices of which patients should receive chemotherapy and in which patients physicians should focus on supportive care alone. Nutritional status also has prognostic value in advanced cancer, but is not routinely evaluated in most clinical settings.
The finding that physicians and patients frequently disagree about PS and nutritional assessments raises important questions about the accuracy of physician-only assessment and the potential consequences of physicians rating patients better than patients rate themselves on treatment decisions for patients with advanced cancer.
The adverse prognostic impact of physician-patient disagreement is a novel finding. More effort is needed to better understand this phenomenon and approaches to reduce disagreement should be developed.
These results also bring into focus the challenge and confounders of effective physician-patient communication. Disagreement was more common when patients were working less than full time, had less education, and reported depression. It is not surprising that these demographic variables were associated with disagreement. These findings should serve as a reminder to physicians to recognize their own limitations in patient assessment when caring for all patients and especially patients at high risk for disagreement.
While this secondary data analysis does not displace the historically-proven clinician-reported PS, systematic collection of patient reported PS and nutritional data at the point of care is feasible, and may add precision to clinician assessments 11. The effects of routinely presenting patient assessments of PS and nutrition to physicians should be evaluated prospectively in a larger study, with pertinent endpoints such as chemotherapy dose intensity/density, clinical outcomes, and therapeutic decision making at the end of life.
Acknowledgements
none
REFERENCES
- 1.Yates JW, Chalmer B, McKegney FP. Evaluation of patients with advanced cancer using the Karnofsky performance status. Cancer. 1980;45(8):2220–4. doi: 10.1002/1097-0142(19800415)45:8<2220::aid-cncr2820450835>3.0.co;2-q. Available from http://www.ncbi.nlm.nih.gov/entrez/query.fcgi?cmd=Retrieve&db=PubMed&dopt=Citatio n&list_uids=7370963. [DOI] [PubMed] [Google Scholar]
- 2.Mor V, Laliberte L, Morris JN, Wiemann M. The Karnofsky Performance Status Scale. An examination of its reliability and validity in a research setting. Cancer. 1984;53(9):2002–7. doi: 10.1002/1097-0142(19840501)53:9<2002::aid-cncr2820530933>3.0.co;2-w. Available from http://www.ncbi.nlm.nih.gov/entrez/query.fcgi?cmd=Retrieve&db=PubMed&dopt=Citatio n&list_uids=6704925. [DOI] [PubMed] [Google Scholar]
- 3.Verger E, Salamero M, Conill C. Can Karnofsky performance status be transformed to the Eastern Cooperative Oncology Group scoring scale and vice versa? Eur J Cancer. 1992;28A(8–9):1328–30. doi: 10.1016/0959-8049(92)90510-9. Available from http://www.ncbi.nlm.nih.gov/entrez/query.fcgi?cmd=Retrieve&db=PubMed&dopt=Citatio n&list_uids=1515244. [DOI] [PubMed] [Google Scholar]
- 4.Buccheri G, Ferrigno D, Tamburini M. Karnofsky and ECOG performance status scoring in lung cancer: a prospective, longitudinal study of 536 patients from a single institution. Eur J Cancer. 1996;32A(7):1135–41. doi: 10.1016/0959-8049(95)00664-8. Available from http://www.ncbi.nlm.nih.gov/entrez/query.fcgi?cmd=Retrieve&db=PubMed&dopt=Citatio n&list_uids=8758243. [DOI] [PubMed] [Google Scholar]
- 5.Schag CC, Heinrich RL, Ganz PA. Karnofsky performance status revisited: reliability, validity, and guidelines. J Clin Oncol. 1984;2(3):187–93. doi: 10.1200/JCO.1984.2.3.187. Available from http://www.ncbi.nlm.nih.gov/entrez/query.fcgi?cmd=Retrieve&db=PubMed&dopt=Citatio n&list_uids=6699671. [DOI] [PubMed] [Google Scholar]
- 6.Maltoni M, Nanni O, Pirovano M, Scarpi E, Indelli M, Martini C, et al. Successful validation of the palliative prognostic score in terminally ill cancer patients. Italian Multicenter Study Group on Palliative Care. J Pain Symptom Manage. 1999;17(4):240–7. doi: 10.1016/s0885-3924(98)00146-8. Available from http://www.ncbi.nlm.nih.gov/entrez/query.fcgi?cmd=Retrieve&db=PubMed&dopt=Citatio n&list_uids=10203876. [DOI] [PubMed] [Google Scholar]
- 7.Lazlo . Fundamentals of Cancer Management. Marcel Dekker; New York: 1986. Physicians Guide to Cancer Care Complications: Prevention and Management. [Google Scholar]
- 8.Dewys WD, Begg C, Lavin PT, Band PR, Bennett JM, Bertino JR, et al. Prognostic effect of weight loss prior to chemotherapy in cancer patients. Eastern Cooperative Oncology Group. Am J Med. 1980;69(4):491–7. doi: 10.1016/s0149-2918(05)80001-3. Available from http://www.ncbi.nlm.nih.gov/entrez/query.fcgi?cmd=Retrieve&db=PubMed&dopt=Citatio n&list_uids=7424938. [DOI] [PubMed] [Google Scholar]
- 9.Loprinzi CL, Laurie JA, Wieand HS, Krook JE, Novotny PJ, Kugler JW, et al. Prospective evaluation of prognostic variables from patient-completed questionnaires. North Central Cancer Treatment Group. J Clin Oncol. 1994;12(3):601–7. doi: 10.1200/JCO.1994.12.3.601. Available from http://www.ncbi.nlm.nih.gov/entrez/query.fcgi?cmd=Retrieve&db=PubMed&dopt=Citatio n&list_uids=8120560. [DOI] [PubMed] [Google Scholar]
- 10.Blagden SP, Charman SC, Sharples LD, Magee LR, Gilligan D. Performance status score: do patients and their oncologists agree? Br J Cancer. 2003;89(6):1022–7. doi: 10.1038/sj.bjc.6601231. Available from http://www.ncbi.nlm.nih.gov/entrez/query.fcgi?cmd=Retrieve&db=PubMed&dopt=Citatio n&list_uids=12966419. [DOI] [PMC free article] [PubMed] [Google Scholar]
- 11.Sloan JA, Loprinzi CL, Laurine JA, Novotny PJ, Vargas-Chanes D, Krook JE, et al. A simple stratification factor prognostic for survival in advanced cancer: the good/bad/uncertain index. J Clin Oncol. 2001;19(15):3539–46. doi: 10.1200/JCO.2001.19.15.3539. Available from http://www.ncbi.nlm.nih.gov/entrez/query.fcgi?cmd=Retrieve&db=PubMed&dopt=Citatio n&list_uids=11481361. [DOI] [PubMed] [Google Scholar]
- 12.Landis JR, Koch GG. The measurement of observer agreement for categorical data. Biometrics. 1977;33(1):159–74. Available from http://www.ncbi.nlm.nih.gov/entrez/query.fcgi?cmd=Retrieve&db=PubMed&dopt=Citatio n&list_uids=843571. [PubMed] [Google Scholar]
- 13.Karnofsky DA. The clinical evaluation of chemotherapeutic agents in cancer. Columbia University Press; New York, NY: 1949. [Google Scholar]
- 14.Doyle . The measurement of pain and other symptoms. ed. 2nd Oxford University Press; 2001. [Google Scholar]
- 15.Slevin ML, Plant H, Lynch D, Drinkwater J, Gregory WM. Who should measure quality of life, the doctor or the patient? Br J Cancer. 1988;57(1):109–12. doi: 10.1038/bjc.1988.20. Available from http://www.ncbi.nlm.nih.gov/entrez/query.fcgi?cmd=Retrieve&db=PubMed&dopt=Citatio n&list_uids=3348942. [DOI] [PMC free article] [PubMed] [Google Scholar]
- 16.Fromme EK, Eilers KM, Mori M, Hsieh YC, Beer TM. How accurate is clinician reporting of chemotherapy adverse effects? A comparison with patient-reported symptoms from the Quality-of-Life Questionnaire C30. J Clin Oncol. 2004;22(17):3485–90. doi: 10.1200/JCO.2004.03.025. Available from http://www.ncbi.nlm.nih.gov/entrez/query.fcgi?cmd=Retrieve&db=PubMed&dopt=Citatio n&list_uids=15337796. [DOI] [PubMed] [Google Scholar]
- 17.Loprinzi CL, Barton DL, Sloan JA. Whose opinion counts? J Clin Oncol. 2006;24(33):5183–5. doi: 10.1200/JCO.2005.04.4388. Available from http://www.ncbi.nlm.nih.gov/entrez/query.fcgi?cmd=Retrieve&db=PubMed&dopt=Citatio n&list_uids=17075108. [DOI] [PubMed] [Google Scholar]
- 18.Grossman SA, Sheidler VR, Swedeen K, Mucenski J, Piantadosi S. Correlation of patient and caregiver ratings of cancer pain. J Pain Symptom Manage. 1991;6(2):53–7. doi: 10.1016/0885-3924(91)90518-9. Available from http://www.ncbi.nlm.nih.gov/entrez/query.fcgi?cmd=Retrieve&db=PubMed&dopt=Citatio n&list_uids=2007792. [DOI] [PubMed] [Google Scholar]
- 19.Litwin MS, Lubeck DP, Henning JM, Carroll PR. Differences in urologist and patient assessments of health related quality of life in men with prostate cancer: results of the CaPSURE database. J Urol. 1998;159(6):1988–92. doi: 10.1016/S0022-5347(01)63222-1. Available from http://www.ncbi.nlm.nih.gov/entrez/query.fcgi?cmd=Retrieve&db=PubMed&dopt=Citatio n&list_uids=9598504. [DOI] [PubMed] [Google Scholar]
- 20.Vogelzang NJ, Breitbart W, Cella D, Curt GA, Groopman JE, Horning SJ, et al. Patient, caregiver, and oncologist perceptions of cancer-related fatigue: results of a tripart assessment survey. The Fatigue Coalition. Semin Hematol. 1997;34(3 Suppl 2):4–12. Available from http://www.ncbi.nlm.nih.gov/entrez/query.fcgi?cmd=Retrieve&db=PubMed&dopt=Citatio n&list_uids=9253778. [PubMed] [Google Scholar]
- 21.Marquie L, Raufaste E, Lauque D, Marine C, Ecoiffier M, Sorum P. Pain rating by patients and physicians: evidence of systematic pain miscalibration. Pain. 2003;102(3):289–96. doi: 10.1016/S0304-3959(02)00402-5. Available from http://www.ncbi.nlm.nih.gov/entrez/query.fcgi?cmd=Retrieve&db=PubMed&dopt=Citatio n&list_uids=12670671. [DOI] [PubMed] [Google Scholar]
- 22.Christakis NA, Lamont EB. Extent and determinants of error in doctors' prognoses in terminally ill patients: prospective cohort study. Bmj. 2000;320(7233):469–72. doi: 10.1136/bmj.320.7233.469. Available from http://www.ncbi.nlm.nih.gov/entrez/query.fcgi?cmd=Retrieve&db=PubMed&dopt=Citatio n&list_uids=10678857. [DOI] [PMC free article] [PubMed] [Google Scholar]
- 23.Lamont EB, Christakis NA. Prognostic disclosure to patients with cancer near the end of life. Ann Intern Med. 2001;134(12):1096–105. doi: 10.7326/0003-4819-134-12-200106190-00009. Available from http://www.ncbi.nlm.nih.gov/entrez/query.fcgi?cmd=Retrieve&db=PubMed&dopt=Citatio n&list_uids=11412049. [DOI] [PubMed] [Google Scholar]
- 24.Eidinger RN, Schapira DV. Cancer patients' insight into their treatment, prognosis, and unconventional therapies. Cancer. 1984;53(12):2736–40. doi: 10.1002/1097-0142(19840615)53:12<2736::aid-cncr2820531233>3.0.co;2-w. Available from http://www.ncbi.nlm.nih.gov/entrez/query.fcgi?cmd=Retrieve&db=PubMed&dopt=Citatio n&list_uids=6326993. [DOI] [PubMed] [Google Scholar]
- 25.Mackillop WJ, Stewart WE, Ginsburg AD, Stewart SS. Cancer patients' perceptions of their disease and its treatment. Br J Cancer. 1988;58(3):355–8. doi: 10.1038/bjc.1988.218. Available from http://www.ncbi.nlm.nih.gov/entrez/query.fcgi?cmd=Retrieve&db=PubMed&dopt=Citatio n&list_uids=2460120. [DOI] [PMC free article] [PubMed] [Google Scholar]
- 26.Weeks JC, Cook EF, O'Day SJ, Peterson LM, Wenger N, Reding D, et al. Relationship between cancer patients' predictions of prognosis and their treatment preferences. Jama. 1998;279(21):1709–14. doi: 10.1001/jama.279.21.1709. Available from http://www.ncbi.nlm.nih.gov/entrez/query.fcgi?cmd=Retrieve&db=PubMed&dopt=Citatio n&list_uids=9624023. [DOI] [PubMed] [Google Scholar]
- 27.Hopwood P, Stephens RJ. Depression in patients with lung cancer: prevalence and risk factors derived from quality-of-life data. J Clin Oncol. 2000;18(4):893–903. doi: 10.1200/JCO.2000.18.4.893. Available from http://www.ncbi.nlm.nih.gov/entrez/query.fcgi?cmd=Retrieve&db=PubMed&dopt=Citatio n&list_uids=10673533. [DOI] [PubMed] [Google Scholar]
- 28.Stommel M, Given BA, Given CW. Depression and functional status as predictors of death among cancer patients. Cancer. 2002;94(10):2719–27. doi: 10.1002/cncr.10533. Available from http://www.ncbi.nlm.nih.gov/entrez/query.fcgi?cmd=Retrieve&db=PubMed&dopt=Citatio n&list_uids=12173342. [DOI] [PubMed] [Google Scholar]
- 29.Weiner M, Callahan CM, Tierney WM, Overhage JM, Mamlin B, Dexter PR, et al. Using information technology to improve the health care of older adults. Ann Intern Med. 2003;139(5 Pt 2):430–6. doi: 10.7326/0003-4819-139-5_part_2-200309021-00010. Available from http://www.ncbi.nlm.nih.gov/entrez/query.fcgi?cmd=Retrieve&db=PubMed&dopt=Citatio n&list_uids=12965971. [DOI] [PubMed] [Google Scholar]
- 30.Ovesen L, Allingstrup L, Hannibal J, Mortensen EL, Hansen OP. Effect of dietary counseling on food intake, body weight, response rate, survival, and quality of life in cancer patients undergoing chemotherapy: a prospective, randomized study. J Clin Oncol. 1993;11(10):2043–9. doi: 10.1200/JCO.1993.11.10.2043. Available from http://www.ncbi.nlm.nih.gov/entrez/query.fcgi?cmd=Retrieve&db=PubMed&dopt=Citatio n&list_uids=8410128. [DOI] [PubMed] [Google Scholar]
- 31.Ovesen L, Hannibal J, Mortensen EL. The interrelationship of weight loss, dietary intake, and quality of life in ambulatory patients with cancer of the lung, breast, and ovary. Nutr Cancer. 1993;19(2):159–67. doi: 10.1080/01635589309514246. Available from http://www.ncbi.nlm.nih.gov/entrez/query.fcgi?cmd=Retrieve&db=PubMed&dopt=Citatio n&list_uids=8502586. [DOI] [PubMed] [Google Scholar]
- 32.Loprinzi CL, Ellison NM, Schaid DJ, Krook JE, Athmann LM, Dose AM, et al. Controlled trial of megestrol acetate for the treatment of cancer anorexia and cachexia. J Natl Cancer Inst. 1990;82(13):1127–32. doi: 10.1093/jnci/82.13.1127. Available from http://www.ncbi.nlm.nih.gov/entrez/query.fcgi?cmd=Retrieve&db=PubMed&dopt=Citatio n&list_uids=2193166. [DOI] [PubMed] [Google Scholar]
- 33.Loprinzi CL, Kugler JW, Sloan JA, Mailliard JA, Krook JE, Wilwerding MB, et al. Randomized comparison of megestrol acetate versus dexamethasone versus fluoxymesterone for the treatment of cancer anorexia/cachexia. J Clin Oncol. 1999;17(10):3299–306. doi: 10.1200/JCO.1999.17.10.3299. Available from http://www.ncbi.nlm.nih.gov/entrez/query.fcgi?cmd=Retrieve&db=PubMed&dopt=Citatio n&list_uids=10506633. [DOI] [PubMed] [Google Scholar]