

Abstract
Several lines of evidence demonstrate involvement of serotonin 1A receptors (5-HT1ARs) in the pathophysiology of neuropsychiatric disorders such as depression, suicidal behavior, schizophrenia, and Alzheimer’s disease. We recently published the synthesis and initial evaluation of [O-methyl-11C]2-(4-(4-(2-methoxyphenyl)piperazin-1-yl)butyl)-4-methyl-1,2,4-triazine-3,5 (2H,4H)dione (11C-MMP), a 5-HT1AR agonist. Here we determine the optimal modeling parameters for 11C-MMP under its new name, 11C-CUMI-101, in Papio anubis.
Methods
PET scans were performed on 2 adult male P. anubis; 166.5 MBq ± 43.0 (4.50 ± 1.16 mCi) of 11C-CUMI-101 were injected as an intravenous bolus, and emission data were collected for 120 min in 3-dimensional mode. We evaluated 4 different models (1- and 2-tissue compartment iterative and noniterative kinetic models, basis pursuit, and likelihood estimation in graphical analysis [LEGA]), using binding potential (BPF = Bmax/Kd) (Bmax = maximum number of binding sites; Kd = dissociation constant) as the outcome measure. Arterial blood sampling and metabolite-corrected arterial input function were used for full quantification of BPF. To assess the performance of each model, we compared results using 6 different metrics (percentage difference, within-subject mean sum of squares [WSMSS] for reproducibility; variance across subjects, intraclass correlation coefficient [ICC] for reliability; identifiability based on bootstrap resampling of residuals; and time stability analysis to determine minimal required scanning time) at each of 6 different scanning durations. Models were also evaluated on scans acquired after injecting the 5-HT1A antagonist [N-(2-(4-(2-methoxyphenyl)-1-piperazinyl)ethyl)-N-(2-pyridinyl) cyclohexanecarboxamide] [WAY100635] 0.5 mg/kg, in-travenous) and the 5-HT1A agonist 8-hydroxy-2-(di-n-propylamino) tetralin) [8-OH-DPAT] 2 mg/kg, intravenous).
Results
All metabolites are more polar than 11C-CUMI-101, and no significant change in metabolites was observed in the blocking studies. The free fraction is 59% ± 3%. We determined that 100 min of scanning time is adequate and that for the region-of-interest (ROI)–level analysis, the LEGA model gives the best results. The median test–retest percentage difference for BPF is 11.15% ± 4.82% across all regions, WSMSS = 2.66, variance = 6.07, ICC = 0.43, and bootstrap identifiability = 0.59. Preadministration of WAY100635 and 8-OH-DPAT resulted in 87% and 76% average reductions in BPF values, respectively, across ROIs.
Conclusion
On the basis of the measurable free fraction, high affinity and selectivity, adequate blood–brain permeability, and favorable plasma and brain kinetics, 11C-CUMI-101 is an excellent candidate for imaging high-affinity 5-HT1ARs in humans.
Keywords: test-retest reproducibility, kinetic modeling, compartment, voxel, bootstrap
Serotonin (5-HT) and 5-HT1A receptors (5-HT1ARs) have been implicated in the pathology of schizophrenia (1–4). The serotonergic system and more specifically the 5-HT1ARs have been also implicated in anxiety (5,6), mood disorders (7–10), and suicide (11,12). Therefore, studying the regional heterogeneity of 5-HT1ARs in diseased and healthy populations is essential in studying the pathophysiology of these disorders.
PET is the best method to measure 5-HT1ARs in the living brain, and 11C-WAY-100635 has become a commonly used radiotracer for imaging 5-HT1ARs, given its success in humans and nonhuman primates (13,14). However, being a noncompetitive antagonist at the 5-HT1AR, WAY-100635 binds to high- and low-affinity receptors equally. 11C-CUMI-101 (15), on the other hand, is an agonist that binds preferentially to the active G-protein–coupled receptor (GPCR) offering distinct advantages: It will enable the determination of the high-to-low agonist affinity ratio in vivo in human brain (16), likely be more sensitive to displacement from 5-HT1ARs by the endogenous ligand (17–19), measure desensitization (downregulation) or sensitization (upregulation) of GPCRs, and provide a better estimate of receptor occupancy for agonist therapeutic agents (20).
We have recently reported that 11C-[O-methyl-11C]2-{4-[4-(7-methoxynaphthalen-1-yl)-piperazin-1-yl]-butyl}-4-methyl-2H-[1,2,4]triazine-3,5-dione (11C-MPT) is a promising agonist radiotracer for imaging 5-HT1ARs in baboon (21). Although 11C-MPT (5-HT1A binding affinity, Ki, 1.4 nM; maximal inhibitory response, Emax, 95%; and half-maximal effective concentration, EC50, 0.05 nM) demonstrated specific binding in 5-HT1AR regions, the washout of radioactivity was relatively slow in baboons, making quantification difficult. On the basis of structure–function analysis studies we found that phenyl analogs of MPT are also excellent 5-HT1A agonists; the 2-methoxyphenyl analog (MMT) possesses a superior 5-HT1A binding affinity (Ki) of 0.7 nM. Our radioligand binding and agonist-stimulated functional assays provided the EC50 of MMTof 0.3 nM, and Emax was 95% (22). Despite the attractive in vitro profile of MMT, 11C-MMT did not show specific binding in vivo and fast clearance was observed in our PET studies with baboons (22). More recently, we published the synthesis and initial evaluation of [O-methyl-11C]2-(4-(4-(2-methoxyphenyl)piperazin-1-yl)butyl)-4-methyl-1,2,4-triazine-3,5(2H,4H)dione (11C-MMP) (15) as an agonist PET ligand superior to 11C-MPT. Here we report in vivo modeling considerations of 11C-MMP in anesthetized baboons under its new name, 11C-CUMI-101.
Our aim is to determine the optimal modeling method for quantifying 11C-CUMI-101 binding in baboons. We address this issue with data from repeated scans on 2 adult males—a test–retest paradigm. In particular, we consider estimation of binding potential (BPF) at 6 different scanning durations.
MATERIALS AND METHODS
All animal experiments were performed with the approval of the Institutional Animal Care and Use Committees from Columbia University Medical Center and New York State Psychiatric Institute.
Chemistry and Radiochemistry
11C-CUMI-101 was synthesized as described by our laboratory (15). Briefly, the radiotracer was prepared by radiomethylation of the corresponding desmethyl analog using 11C-CH3OTf. The final product was purified by high-performance liquid chromatography (HPLC) and a C18 SepPak (Waters). The radioproduct eluted from the C-18 SepPak (in 1 mL ethanol) was diluted with 9 mL of normal saline, filtered through a 0.22-μm filter prepared aseptically, and used for further studies. A small portion of the product was analyzed with analytic HPLC for chemical and radiochemical purities, specific activity, and other quality control indices. The average radiochemical yield of 11C-CUMI-101 was 25% at end of synthesis (EOS) with a specific activity of 96.2 ± 18.5 TBq/μmol (2,600 ± 500 Ci/μmol).
PET Studies
A series of 11C-CUMI-101 PET scans was performed on 2 male baboons with an ECAT EXACT HR+ scanner (Siemens Medical Solutions, Inc.). Animal anesthesia and preparation were as previously described (23). On average, 166.5 ± 42.9 MBq (4.50 ± 1.16 mCi) of 11C-CUMI-101 were injected, with a specific activity of 49.95 ± 24.42 GBq/μmol (1.35 ± 0.66 Ci/μmol), as an intravenous bolus over 30 s, and emission data were collected for 120 min in 3-dimensional mode. Data were collected in 23 consecutive frames with increasing duration, 30-s (n = 2), 60-s (n = 3), 2-min (n = 5), 4-min (n = 4), and 10-min (n = 9) frames. Plasma samples were taken every 10 s for the first 2 min, using an automated system, and thereafter taken manually for a total of 34 samples. A total of 4 test–retest experiments (2 in each animal) and 4 test–block studies (2 in each animal) were obtained. A test–retest experiment is defined as 2 sequential PET scans in 1 animal on the same day. A test–block experiment is 1 test scan, which is followed by injection of an antagonist or agonist and then followed by a repeated scan. The blocking experiments used the potent and selective 5-HT1A antagonist WAY100635 (0.5 mg/kg, intravenous) or 8-OH-DPAT (2 mg/kg, intravenous; a partial agonist) 30 min before the second injection of 11C-CUMI-101.
Metabolite and Free Fraction Analysis
Six plasma samples were obtained at 2, 4, 12, 30, 60, and 90 min during each scan for the determination of unmetabolized 11C-CUMI-101 (24). The free fraction was determined using an ultracentrifugation method as described elsewhere (25) (HPLC column: Phenomenex, Prodigy ODS(3) 4.6°—250 mm, 5 μm; mobile phase: acetonitrile/0.25 M sodium phosphate solution [40:60]; flow rate, 2 mL/min; retention time, 6 min). The metabolites and free fractions were assayed using a Perkin Elmer 3″ NaI γ-detector, and all data were corrected for background radioactivity and decay. The 6 metabolite points were fitted with the Hill function (1 − AtB/[tB + C]) and weighted using the delta method (26). This fit was then used to correct the plasma radioactivity (34 samples), and a 3-exponential function was used to fit the corrected data.
Image Processing and Analysis
PET data were reconstructed with transmission-based attenuation correction and model-based scatter correction (27). The reconstruction filter and estimated image filter were Shepp 0.5, axial (Z) filter was all-pass 0.4, and zoom factor was 4.0. The final image resolution at the center of the field of view was 5.1-mm full width at half maximum (28). A T1-weighted MR image of the head was acquired on a 1.5-T Signa Advantage system (GE Healthcare). Regions of interest (ROIs) included anterior cingulate, amygdala, cerebellum, dorsal raphe nucleus, hippocampus, insular cortex, prefrontal cortex, and temporal cortex and were drawn on coregistered MR images. A large region of the cerebellum, excluding the area adjacent to the occipital cortex, was selected as the reference region.
To quantify tracer binding, time–activity curves were analyzed by 3 modeling approaches using the metabolite-corrected plasma input function: 2-tissue compartment (2TC), basis pursuit (29), and likelihood estimation in graphical analysis (LEGA) (30). The 2-tissue compartment kinetic model (2TC) is used with a standard iterative (2TCIT) nonlinear least-squares algorithm, both constrained (where the ratio of K1/k2 values is constrained to the value of the total volume of distribution (VT) of the reference region) and unconstrained, as well as a noniterative approach (2TCNI) with the time–activity curve regressed on each of a library of functions e−θkt ⊗ Cp (t)for a range of θk values (31), with VT being computed from the best of these fits. The noniterative alternative to the traditional compartmental modeling approach was implemented by Simpson et al. (31) for the 1-tissue model. This approach uses a library of functions, similar to that used for basis pursuit, to avoid numeric problems that can arise with the usual iterative fitting procedure. Specifically, the 2TCNI method regresses the time–activity curve data (using a fast nonnegative least-squares algorithm) on each possible pair of library functions, with the smallest sum of weighted squared errors determining the 2 library functions used in the final fit. Basis pursuit was implemented using the DEPICT software created by Gunn et al. with 30 basis functions and θk ranges (0.566–0.0136) recommended (29). LEGA (30,32) is a bias-free approach to the graphical analysis suggested by Logan et al. (33), and our application of this method uses the last 8 time points for fitting. A 1-tissue compartment was also evaluated, but not included in the final analysis because of poor fitting of the time–activity curves. Likewise, a 3-tissue compartment model proved to be overparameterized and, thus, was not considered among candidate models.
Model Selection
Using binding potential (BPF) as the outcome measure for 4 test–retest pairs, 2TCNI, basis pursuit, and LEGA modeling approaches are compared. Following the approach taken in an earlier test–retest study for a different ligand (34), 6 metrics are used to help judge among the models considered: percentage difference (PD) and within-subject sum of squares (WSMSS) to measure reproducibility; variance of BP measurements; intraclass correlation coefficient (ICC) to measure reliability; median absolute deviation (MAD) of bootstrap resampled data to measure identifiability; and time stability. Each of these is described next.
PD
The test–retest reproducibility was calculated as the absolute difference between the test and retest values divided by their average.
WSMSS
Within-subject variability was estimated according to:
Here, Xi1 represents the “test” value of an outcome measure for experiment i, Xi2 represents the “retest” value for the same experiment, n is the number of test–retest pairs, and X̄i = (Xi1 + Xi2)/2.
Variance
The variance of an outcome measure is the sample variance (across experiments) of all observations for each ROI.
ICC
The measure of within-subject variability relative to between-subject variability was computed using the ICC:
where BSMSS is the mean sum of squares between subjects, WSMSS is the mean sum of squares within subjects, and k is the number of repeated observations (k = 2 in the current study). The coefficient value ranges from −1 (no reliability) to 1 (maximum reliability).
Identifiability
To assess the stability of each estimation strategy, we computed 100 bootstrap samples (35) for each subject’s ROI and estimated the outcome measure for each of these samples. Because interest in this article centers on variability in the modeling of the brain time–activity curves rather than that for plasma and metabolite modeling, bootstrap samples were taken only of the time–activity curve data. We measured the variability of these estimates using the robust MAD criterion:
This approach to assessing identifiability may be preferred to the more customary technique of using the asymptotic formulas for standard errors in nonlinear regression as it does not rely on distributional assumptions of the noise.
Time Stability
It may appear logical that the longer the acquisition time, the more accurate the estimation. However, because of the physical decay of the radionuclide (11C half-life = 20 min) as well as subject head motion, the acquired data become increasingly noisy toward the end of the scan and do not necessarily contribute useful information. Considerations of subject comfort would also dictate that data acquisition time be as short as possible.
All studies analyzed here included a full 120 min of scanning. To assess performance of each method with shorter scan-duration data, each model was fit to data with later frames deleted. This was done for total scan times of 120, 110, 100, 90, 80, and 70 min. For each ROI of each study, we computed the ratio of the outcome measure for the shorter scan time to that for the full scan. An estimation procedure for an ROI was considered stable at a given scanning duration if the mean of these ratios across all studies was between 95% and 105% and if their SD was <10%. In addition, all the other metrics described in this section were recalculated for each of the candidate scan durations.
For each of these metrics, medians are taken across all scans and all ROIs, for both subjects. Although time stability is considered as an independent metric, each of the other metrics is also evaluated at 6 different scan durations, thereby contributing to the assessment of the model stability over time. Each of these metrics is applied separately to the data from each ROI and these are summarized across all ROIs. Finally, models are rank-ordered on the basis of each metric, and the best overall model is selected.
Assessment of Specific Binding
Using the best model for the minimal scan time (the determination of which is described earlier), blocking studies are evaluated by calculation of the percentage change in VT and BPF after injection of 8-OH-DPAT or WAY100635 and by evaluating this value in light of the test–retest variability.
Voxel-Based Analysis
Parametric VT images are created using 2TCNI by performing a voxel-based analysis and then coregistering the resulting image with the MR image. The LEGA model is not ideal for voxel analysis because of a high noise level.
RESULTS
Metabolite and Free Fraction Analysis
Figure 1 shows the unmetabolized fraction of 11C-CUMI-101 over time in baboon plasma during a typical single scan and the corresponding plasma input function before and after correction by metabolite data. All metabolites were more polar than 11C-CUMI-101, and no change in metabolites was observed in the blocking studies (15). The free fraction was 59% ± 3%.
FIGURE 1.
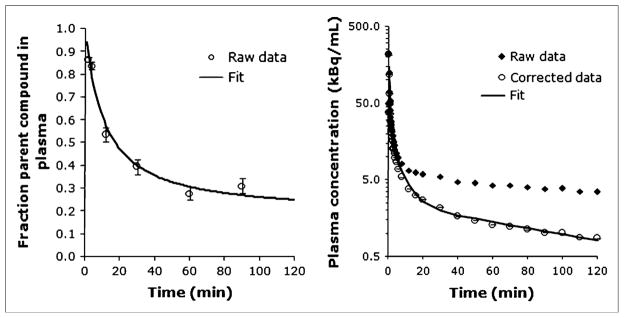
(A) Fraction of plasma activity associated with unmetabolized 11C-CUMI-101 in baboon plasma during a single scan. Fitted line is estimated from the Hill model (1 − AtB/[tB + C]). (B) Total and metabolite-corrected plasma radioactivity. Fitted line represents the 3-exponential function fit to the data. Error bars represent weights calculated by the delta method.
Model Selection
The 2TC model yielded poor fits in the blocking studies, and the 2TC unconstrained model proved to be overparameterized (adequate fits of the data but one of the fitted time constants would often be very near zero, inflating the estimated VT value). Thus, of the 2TC models, only the 2TCNI is presented here. Fits of the 3 models to the time–activity curve data are shown in Figure 2. Results of the analysis of the various metrics are presented in tabular and graphical form (Fig. 3 and Table 1). To limit the effect that outliers can have on summary measures (across subjects and ROIs) of the various metrics considered, we summarized results using the median rather than the mean. It should be noted in advance that LEGA metrics for 70 min of scan time are often quite poor. Given that at 70 min of scan time only 3 data points remain with which to fit the model, this is not surprising.
FIGURE 2.

Regional time–activity curves and corresponding least-squares minimized fits to 3 different models. (A) 2TCNI. (B) Basis pursuit. (C and D) LEGA (native and transformed space, respectively). CER = cerebellum; ACN = anterior cingulate; TEM = temporal cortex.
FIGURE 3.

Modeling metrics comparing 2TCNI, basis pursuit, and LEGA models at 6 different scan durations. (A) PD. (B) WSMSS. (C) Variance. (D) ICC. (E) Identifiability. For all measures, medians are taken across all scans and all ROIs, for both subjects. (A) Error bars represent average deviation from the median. Asterisk in A indicates that the modeling of dorsal raphe did not converge for basis pursuit for the 100-min scan time (for a single study) and thus was left out of the analysis.
TABLE 1.
Time Stability Data for 3 Models Tested
| ROI | 2TCNI |
Basis pursuit |
LEGA |
|||
|---|---|---|---|---|---|---|
| VT | BP | VT | BP | VT | BP | |
| CAN | 90 | 90 | 110 | 100 | 100 | 100 |
| AMY | 80 | 80 | 120 | 100 | 90 | 90 |
| DRN | 110 | 110 | 120 | 120 | 100 | 90 |
| HIP | 110 | 110 | 110 | 110 | 90 | 90 |
| INS | 80 | 70 | 120 | 100 | 90 | 90 |
| PFC | 110 | 100 | 90 | 90 | 80 | 80 |
| TEM | 70 | 70 | 90 | 90 | 90 | 80 |
ACN = anterior cingulate; AMY = amygdala; DRN = dorsal raphe; HIP = hippocampus; INS = insula; PFC = prefrontal cortex; TEM = temporal cortex.
Numbers indicate the shortest scan duration for which the average VT and BPF values from all test–retest experiments for each ROI were between 95% and 105% of the average value, when using 120-min scan duration and also when SD of these percentages is, <10%.
Median Percentage Difference
The median percentage difference (PD) Fig. 3A) varies between 9% and 16% for 2TCNI, 14% and 17% for basis pursuit, and 9% and 44% for LEGA; small numbers are better. WSMSS (Fig. 3B) results range from 2 to 12 for 2TCNI, 9 to 29 for basis pursuit, and 3 to 6,000 for LEGA; small numbers are better. Variance (Fig. 3C) ranges from 5 to 10 for 2TCNI, 16 to 32 for basis pursuit, and 6 to 5,800 for LEGA; small numbers are better. ICC (Fig. 3D) ranges from 0.36 to 0.58 for 2TCNI, 0.26 to 0.59 for basis pursuit, and 0.24 to 0.53 for LEGA; large numbers (closer to 1) are better. Bootstrap identifiability (Fig. 3E) was calculated only for 2TCNI and basis pursuit because the 8 data points fitted by the LEGA method are not sufficient to allow a proper distribution of bootstrap samples. The 2TCNI MAD of bootstrap samples of data is between 0.2 and 0.3 versus 1.0 and 1.9 for basis pursuit; small numbers are better. Time stability data are summarized in Table 1 and represent the minimum scanning time for which the time stability criterion is satisfied for a given ROI in a given model. LEGA requires 100 min of scanning time versus 110 min for 2TCNI and 120 min for basis pursuit.
Assessment of Specific Binding
Using the LEGA model with 100 min of data, percentage changes (PDs) in VT and BPF values after injection with either 8-OH-DPAT or WAY-100635 are shown in Figure 4. Preadministration of WAY-100635 resulted in 57%–78% reduction in VT values and 85%–91% reduction in BPF values for all ROIs. Reductions of VT and BPF values with 8-OH-DPAT preadministration were 51%–72% and 73%–83%, respectively. These values should be viewed in light of a test–retest PD (for measures of BPF) of 11% ± 5%. Blockade was also seen in the cerebellar reference region: 27% ± 2% for both agents. Using BPP (BPP = VTROI − VTREF, where ROI is the region of interest and REF is the instead of BPF as the outcome measure does not change the relative performance of the competing modeling approaches on the metrics considered; BPP yielded slightly better values on the 6 metrics considered (data not shown).
FIGURE 4.

Mean percentage change (PD) in VT (A) and BPF (B) of 11C-CUMI-101 after blockade with 8-OH-DPAT and WAY-100635. Values were derived from the LEGA model with a 100-min scan duration. ACN = anterior cingulate; AMY = amygdala; CER = cerebellum; DRN = dorsal raphe; HIP = hippocampus; INS = insula; PFC = prefrontal cortex; TEM = temporal cortex.
Voxel-Based Analysis
BPF voxel maps during test and blocking conditions are provided in Figure 5. As LEGA has not been optimized for voxel-based analysis, the second-ranking 2TCNI method was used to derive voxel-by-voxel VT values. To evaluate the agreement between voxel-by-voxel and ROI-derived VT values, the 2TCNI voxel derived is correlated with the 2TCNI ROI (Fig. 6A; R2 = 0.98, m = 1.05, b = 0.33). In the voxel method time–activity curves are generated and modeled for each voxel to obtain voxel level VT and BPF values; these VT and BPF values then are averaged within an ROI (Fig. 6A). In the ROI method, time–activity curve data are generated by averaging emission data throughout the ROIs frame-by-frame; as a result, 1 time–activity curve, VT, or BPF is obtained per ROI. To evaluate agreement between the first-, second- and third-ranking ROI-based approaches, LEGA ROI is correlated with 2TCNI ROI (Fig. 6B; R2 = 0.98, m = 1.04, b = 0.15), and LEGA ROI is correlated with basis pursuit ROI (Fig. 6C; R2 = 0.96, m = 1.17, b = −0.06). Finally, LEGA ROI is correlated with the 2TCNI voxel derived (Fig. 6D; R2 = 1.0, m = 1.12, b = 0.263).
FIGURE 5.
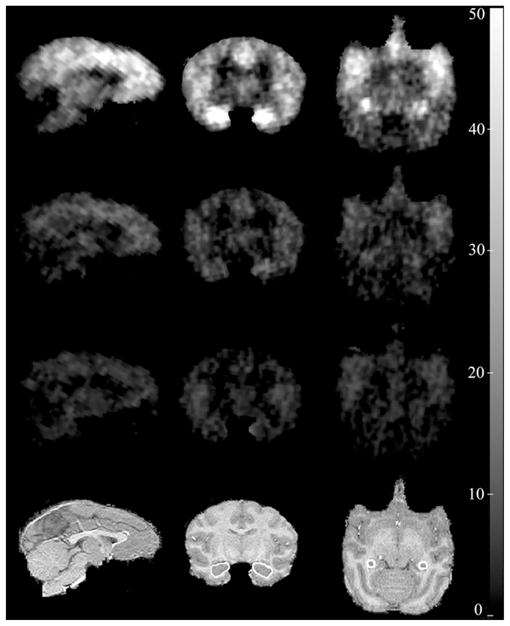
(First row) Sagittal, coronal, and axial parametric PET images of 11C-CUMI-101 BPF values in baboon brain. (Second and third rows): PET images after blockade by 8-OH-DPAT and WAY-100635, respectively. (Fourth row) Corresponding coregistered MR images. On the MR images, the hippocampus has been highlighted.
FIGURE 6.

Correlation plots of VT values across various modeling approaches including ROI-analysis vs. voxel-based analyses. (A) 2TCNI voxel vs. 2TCNI ROI (R2 = 0.97). (B) 2TCNI ROI vs. LEGA ROI (R2 = 0.97). (C) Basis pursuit ROI vs. LEGA ROI (R2 = 0.97). (D) 2TCNI voxel vs. LEGA ROI (R2 of 1.00). Line of identity has been added for reference. Data reflect all ROIs in all studies.
DISCUSSION
Model Selection
We have evaluated several different kinetic and alternative approaches to estimating 5-HT1A BPF using the novel radioligand 11C-CUMI-101 in test–retest studies on baboons. One- and 2-tissue compartment iterative models did not produce acceptable curve fitting (data not shown). LEGA outperformed basis pursuit and 2TCNI in all metrics (Table 2) and also proved to be more robust than the other models for scan durations as short as 100 min in baboons. The median percentage difference of BPF at the optimal scanning duration (100 min) for this model is 11.15% ± 4.82%, suggesting that this ligand should be suitable for detection of even relatively small changes in BPF.
TABLE 2.
Ranks of 3 Methods Used for Each Metric at 100-Minute Scanning Time*
| Metric | 2TCNI | LEGA | Basis |
|---|---|---|---|
| PD | 2 | 1 | 3 |
| WSMSS | 2 | 1 | 3 |
| VAR | 2 | 1 | 3 |
| ICC | 2 | 2 | 2 |
| ID | 1 | N/A | 2 |
With 1 being the best of each criterion.
VAR = variance; ID = identifiability; N/A = not applicable.
Optimal Scanning Duration
Time stability analysis has been used as one of the metrics for model selection; specifically, it allows the determination of the minimal scan duration that will return nearly identical outcome measures as the full dataset. The intention of such an analysis is 2-fold: it provides information about the stability of the modeling method and it can potentially allow a reduction in time subjects spend in the PET camera without undue loss of information. For this reason, all outcome measures used for model selection were evaluated for each iteration of shortened scan durations to determine the minimum duration of scanning without sacrificing other metrics. However, there can be species differences in the rates of metabolism of the compound that may affect the required scanning duration in humans.
Voxel Images
Kinetic modeling is usually performed on time–activity curves for ROIs, which are generated by averaging the time–activity curves from all voxels contained within an anatomically defined region. Modeling can also be often performed for each voxel individually. We selected the second-best ROI-based model, 2TCNI, for the voxel-based analysis because LEGA is not suitable for the voxel-based modeling approach. By applying ROIs post hoc to the VT images, we found close agreement between average VT values derived by 2TCNI voxel and 2TCNI ROI analyses (Fig. 6A) as well as between 2TCNI ROI and LEGA ROI.
ROI-based analysis allows for a more accurate estimation because the data are less noisy as a consequence of the averaging procedure. However, this approach may miss important information in areas that do not correspond closely enough to the predefined ROIs. For example, when searching for the best reference region, the voxel-based approach enabled us to conduct a brain-wide search for the region with the lowest VT and the least displacement in response to a blocking dose of a competing ligand of the receptor.
Displaceable Binding in the Reference Region
As we demonstrated earlier, the cerebellum is not completely devoid of 5-HT1ARs in humans (36). This may explain why the cerebellar VT of 11C-CUMI-101 shows displacement after blocking doses of both WAY-100635 and 8-OH-DPAT (Fig. 4A). To our knowledge, this is the first report indicating specific 5-HT1A binding in the cerebellum of baboons. However, in contrast with an earlier finding in humans (36), we find no regional heterogeneity in the vermis versus cerebellar hemispheres, which is based on slice-by-slice visual inspection of the VT voxel maps of the baseline experiments and voxel maps created by subtracting the VT map of the WAY-100635 block experiments from the VT voxel map of the corresponding baseline experiment (data not shown). Although unlikely, on the basis of these experiments, we cannot exclude the possibility that both blocking procedures (i.e., WAY-100635 and 8-OH-DPAT) had an effect on the free and nonspecific binding of 11C-CUMI-101. Importantly, this argues that interpretation using modeling approaches, which depend on the assumption that the reference region remains unaffected by the experimental intervention, should be done with caution.
Differential Displacement by 8-OH-DPAT and WAY-100635
Tracer uptake in response to preadministration of agonist 8-OH-DPAT was lower than that in response to antagonist WAY-100635. It is important to keep in mind that these were unmatched single doses of each competing agent. If we were to evaluate which molecule is more effective in displacing 11C-CUMI-101 from specific binding, one would have to construct a dose–response curve for both agents and compare them, taking into account blood levels and molecular weights of both agents. Although this was beyond the scope of the current study, even if this was done, we might find that an antagonist (such as WAY-100635) at any particular concentration would apparently displace more of an agonist tracer (such as 11C-CUMI-101) than 8-OH-DPAT (another agonist), because an antagonist given at a blocking dose is more likely to keep the receptor in the G-protein–uncoupled, low-agonist-affinity state longer then an agonist—thereby, reducing the apparent availability of the 5-HT1ARs for binding with an agonist.
Considerations of LEGA: The Optimal Model
When selecting a model it is important to take into consideration the goal of the analysis. Although LEGA outperformed other models on metrics presented in this study, it is important to keep in mind that LEGA is a graphical approach; therefore, it does not provide estimates of kinetic parameters such as K1–k4. Furthermore, LEGA is more sensitive to high noise levels than the other approaches considered. This does not affect LEGA’s performance when used in the ROI-based analysis, as averaging reduces noise that occurs across the voxels in an ROI. However, this indicates that LEGA is not suitable without further development to be used in a voxel-based modeling approach.
In addition to the LEGA approach considered here, there are several other methods that have been developed in the graphical analysis framework to reduce or eliminate the noise-dependent bias demonstrated by others. (37) We considered LEGA because it represents an exact solution to the estimation problem by modeling time–activity curve noise directly and, thus, it inherits optimality properties associated with the likelihood theory. Also, among several approaches considered in a simulation study, LEGA was found to have the smallest bias, although its variance was not as small as some of the others (38).
We did not consider any of the numerous reference tissue–based approaches to modeling because there is detectable, displaceable 5-HT1A binding in the cerebellum (36). This is well demonstrated by the data presented here. Our results show that there was significant displacement of VT in the cerebellum (Fig. 4A). In the absence of a true reference region, we use methods that require an input function to minimize the error associated with estimating the outcome measures. Reference tissue approaches are limited in that the only outcome measure that is an index of Bmax is BPND—the outcome measure most sensitive to changes in cerebellar binding ([VT ROI − VT Cer]/VT Cer). However, on the basis of the current baboon study, it is not possible to predict whether arterial sampling will be required in human studies. For this, the assumptions of a bloodless design will have to be tested in humans. However, even if some studies may not require an arterial input function, other studies will need it to rule out effects of drug or disease on the free fraction of the tracer.
Advantages of 11C-CUMI-101
11C-CUMI-101 has several advantages over prior 5-HT1A agonist in vivo PET tracers. 11C-CUMI-101 has a very stable and reproducible metabolic profile (Fig. 1), with only highly polar metabolites that do not cross the blood–brain barrier (15); this enables calculation of a metabolite-corrected arterial input function. Furthermore, 11C-CUMI-101 exhibits an abundant, consistent, and easily measurable free fraction in plasma and produces time–activity curves with kinetics suitable for modeling. All of these attributes make 11C-CUMI-101 a promising PET tracer suitable for full in vivo quantification.
CONCLUSION
On the basis of the 6 metrics used to judge among competing models, we determined that 100 min of scanning time is sufficient for quantification of 11C-CUMI-101 using the LEGA method and that LEGA is preferred for ROI-based analysis, which is closely followed by the 2TCNI approach and then by basis pursuit. Furthermore, significant specific binding in many brain regions is demonstrated after administering pharmacologic doses of 5-HT1A antagonist WAY-100635 or the 5-HT1A agonist 8-OH-DPAT. Considering that the data presented here were obtained from healthy baboons, it could be argued that the results may not be valid for a human population—especially, the optimum scanning time. In fact, antidepressant-naive patients with major depression could be expected to possess higher specific binding, which may lead to a slower equilibration of binding kinetics. Therefore, the selected scanning time should be reevaluated in human subjects. Nevertheless, 11C-CUMI-101 has great promise as a radioligand in the study of the serotonergic system in mental illness and should be considered for standard use in humans.
Acknowledgments
We thank the staff of the Molecular Imaging and Neuropathology division of the Department of Psychiatry at Columbia University, the Kreitchman PET Center, and the Radioligand Laboratory for expert help. This work was supported in part by U.S. Public Health Service grants MH62185, MH077161, and MH076258.
References
- 1.Kasper S, Tauscher J, Willeit M, et al. Receptor and transporter imaging studies in schizophrenia, depression, bulimia and Tourette’s disorder: implications for psychopharmacology. World J Biol Psychiatry. 2002;3:133–146. doi: 10.3109/15622970209150614. [DOI] [PubMed] [Google Scholar]
- 2.Wedzony K, Mackowiak M, Fijal K, Golembiowska K. Evidence that conditioned stress enhances outflow of dopamine in rat prefrontal cortex: a search for the influence of diazepam and 5-HT1A agonists. Synapse. 1996;24:240–247. doi: 10.1002/(SICI)1098-2396(199611)24:3<240::AID-SYN6>3.0.CO;2-E. [DOI] [PubMed] [Google Scholar]
- 3.Lejeune F, Millan MJ. Induction of burst firing in ventral tegmental area dopaminergic neurons by activation of serotonin (5-HT)1A receptors: WAY 100,635-reversible actions of the highly selective ligands, flesinoxan and S 15535. Synapse. 1998;30:172–180. doi: 10.1002/(SICI)1098-2396(199810)30:2<172::AID-SYN7>3.0.CO;2-9. [DOI] [PubMed] [Google Scholar]
- 4.Bibbiani F, Oh JD, Chase TN. Serotonin 5-HT1A agonist improves motor complications in rodent and primate parkinsonian models. Neurology. 2001;57:1829–1834. doi: 10.1212/wnl.57.10.1829. [DOI] [PubMed] [Google Scholar]
- 5.Hogg S, Andrews N, File SE. Contrasting behavioural effects of 8-OH DPAT in the dorsal raphe nucleus and ventral hippocampus. Neuropharmacology. 1994;33:343–348. doi: 10.1016/0028-3908(94)90064-7. [DOI] [PubMed] [Google Scholar]
- 6.Jolas T, Schreiber R, Laporte AM, et al. Are postsynaptic 5-HT1A receptors involved in the anxiolytic effects of 5-HT1A receptor agonists and in their inhibitory effects on the firing of serotonergic neurons in the rat? J Pharmacol Exp Ther. 1995;272:920–929. [PubMed] [Google Scholar]
- 7.Arango V, Underwood MD, Boldrini M, et al. Serotonin 1A receptors, serotonin transporter binding and serotonin transporter mRNA expression in the brainstem of depressed suicide victims. Neuropsychopharmacology. 2001;25:892–903. doi: 10.1016/S0893-133X(01)00310-4. [DOI] [PubMed] [Google Scholar]
- 8.Stanley M, Mann JJ. Increased serotonin-2 binding sites in frontal cortex of suicide victims. Lancet. 1983;1:214–216. doi: 10.1016/s0140-6736(83)92590-4. [DOI] [PubMed] [Google Scholar]
- 9.Parsey RV, Olvet DM, Oquendo MA, Huang YY, Ogden RT, Mann JJ. Higher 5-HT1A receptor binding potential during a major depressive episode predicts poor treatment response: preliminary data from a naturalistic study. Neuropsychopharmacology. 2006;31:1745–1749. doi: 10.1038/sj.npp.1300992. [DOI] [PubMed] [Google Scholar]
- 10.Parsey RV, Oquendo MA, Ogden RT, et al. Altered serotonin 1A binding in major depression: a [carbonyl-C-11]WAY100635 positron emission tomography study. Biol Psychiatry. 2006;59:106–113. doi: 10.1016/j.biopsych.2005.06.016. [DOI] [PubMed] [Google Scholar]
- 11.Mann JJ, McBride PA, Brown RP, et al. Relationship between central and peripheral serotonin indexes in depressed and suicidal psychiatric inpatients. Arch Gen Psychiatry. 1992;49:442–446. doi: 10.1001/archpsyc.1992.01820060022003. [DOI] [PubMed] [Google Scholar]
- 12.Placidi GP, Oquendo MA, Malone KM, Huang YY, Ellis SP, Mann JJ. Aggressivity, suicide attempts, and depression: relationship to cerebrospinal fluid monoamine metabolite levels. Biol Psychiatry. 2001;50:783–791. doi: 10.1016/s0006-3223(01)01170-2. [DOI] [PubMed] [Google Scholar]
- 13.Carson RE, Breier A, de Bartolomeis A, et al. Quantification of amphetamine-induced changes in [11C]raclopride binding with continuous infusion. J Cereb Blood Flow Metab. 1997;17:437–447. doi: 10.1097/00004647-199704000-00009. [DOI] [PubMed] [Google Scholar]
- 14.Sargent PA, Kjaer KH, Bench CJ, et al. Brain serotonin 1A receptor binding measured by positron emission tomography with [11C]WAY-100635: effects of depression and antidepressant treatment. Arch Gen Psychiatry. 2000;57:174–180. doi: 10.1001/archpsyc.57.2.174. [DOI] [PubMed] [Google Scholar]
- 15.Kumar JS, Prabhakaran J, Majo VJ, et al. Synthesis and in vivo evaluation of a novel 5-HT(1A) receptor agonist radioligand [O-methyl-11C]2-(4-(4-(2-methoxyphenyl)piperazin-1-yl)butyl)-4-methyl-1,2,4-triazi ne-3,5(2H,4H)dione in nonhuman primates. Eur J Nucl Med Mol Imaging. 2007;34:1050–1060. doi: 10.1007/s00259-006-0324-y. [DOI] [PubMed] [Google Scholar]
- 16.Burnet PW, Eastwood SL, Harrison PJ. [3H]WAY-100635 for 5-HT1A receptor autoradiography in human brain: a comparison with [3H]8-OH-DPAT and demonstration of increased binding in the frontal cortex in schizophrenia. Neurochem Int. 1997;30:565–574. doi: 10.1016/s0197-0186(96)00124-6. [DOI] [PubMed] [Google Scholar]
- 17.Cumming P, Gillings NM, Jensen SB, Bjarkam C, Gjedde A. Kinetics of the uptake and distribution of the dopamine D(2,3) agonist (R)-N-[1-(11)C]n-propylnorapomorphine in brain of healthy and MPTP-treated Gottingen miniature pigs. Nucl Med Biol. 2003;30:547–553. doi: 10.1016/s0969-8051(02)00448-1. [DOI] [PubMed] [Google Scholar]
- 18.Cumming P, Wong DF, Gillings N, Hilton J, Scheffel U, Gjedde A. Specific binding of [11C]raclopride and N-[3H]propyl-norapomorphine to dopamine receptors in living mouse striatum: occupancy by endogenous dopamine and guanosine triphosphate-free G protein. J Cereb Blood Flow Metab. 2002;22:596–604. doi: 10.1097/00004647-200205000-00011. [DOI] [PubMed] [Google Scholar]
- 19.Narendran R, Hwang DR, Slifstein M, et al. In vivo vulnerability to competition by endogenous dopamine: comparison of the D2 receptor agonist radiotracer (−)N-[11C]propyl-norapomorphine ([11C]NPA) with the D2 receptor antagonist radiotracer [11C]-raclopride. Synapse. 2004;52:188–208. doi: 10.1002/syn.20013. [DOI] [PubMed] [Google Scholar]
- 20.Hirsch SR, Kissling W, Bauml J, Power A, O’Connor R. A 28-week comparison of ziprasidone and haloperidol in outpatients with stable schizophrenia. J Clin Psychiatry. 2002;63:516–523. doi: 10.4088/jcp.v63n0609. [DOI] [PubMed] [Google Scholar]
- 21.Kumar JS, Majo VJ, Hsiung SC, et al. Synthesis and in vivo validation of [O-methyl-11C]2-{4-[4-(7-methoxynaphthalen-1-yl)piperazin-1-yl]butyl}-4-methyl-2H-[1,2,4]triazine-3,5-dione: a novel 5-HT1A receptor agonist positron emission tomography ligand. J Med Chem. 2006;49:125–134. doi: 10.1021/jm050725j. [DOI] [PubMed] [Google Scholar]
- 22.Prabhakaran J, Parsey RV, Majo VJ, et al. Synthesis, in vitro and in vivo evaluation of [O-methyl-11C] 2-{4-[4-(3-methoxyphenyl)piperazin-1-yl]-butyl}-4-methyl-2H-[1,2,4]-triazine-3,5-dione: a novel agonist 5-HT1A receptor PET ligand. Bioorg Med Chem Lett. 2006;16:2101–2104. doi: 10.1016/j.bmcl.2006.01.052. [DOI] [PubMed] [Google Scholar]
- 23.Milak MS, Ogden RT, Vinocur DN, et al. Effects of tryptophan depletion on the binding of [11C]-DASB to the serotonin transporter in baboons: response to acute serotonin deficiency. Biol Psychiatry. 2005;57:102–106. doi: 10.1016/j.biopsych.2004.09.026. [DOI] [PubMed] [Google Scholar]
- 24.Ginovart N, Wilson AA, Meyer JH, Hussey D, Houle S. Positron emission tomography quantification of [11C]-DASB binding to the human serotonin transporter: modeling strategies. J Cereb Blood Flow Metab. 2001;21:1342–1353. doi: 10.1097/00004647-200111000-00010. [DOI] [PubMed] [Google Scholar]
- 25.Gandelman MS, Baldwin RM, Zoghbi SS, Zea-Ponce Y, Innis RB. Evaluation of ultrafiltration for the free-fraction determination of single photon emission computed tomography (SPECT) radiotracers: beta-CIT, IBF, and iomazenil. J Pharm Sci. 1994;83:1014–1019. doi: 10.1002/jps.2600830718. [DOI] [PubMed] [Google Scholar]
- 26.Wu S, Ogden RT, Mann JJ, Parsey RV. Optimal metabolite curve fitting for kinetic modeling of 11C-WAY-100635. J Nucl Med. 2007;48:926–931. doi: 10.2967/jnumed.106.038075. [DOI] [PubMed] [Google Scholar]
- 27.Watson CC, Newport D, Casey ME. A single scatter simulation technique for scatter correction in 3D PET. In: Grangeat P, Amans J-L, editors. Three-Dimensional Image Reconstruction in Radiology and Nuclear Medicine. Boston, MA: Kluwer Academic Publishers; 1996. pp. 255–268. [Google Scholar]
- 28.Mawlawi O, Martinez D, Slifstein M, et al. Imaging human mesolimbic dopamine transmission with positron emission tomography. I. Accuracy and precision of D(2) receptor parameter measurements in ventral striatum. J Cereb Blood Flow Metab. 2001;21:1034–1057. doi: 10.1097/00004647-200109000-00002. [DOI] [PubMed] [Google Scholar]
- 29.Gunn RN, Gunn SR, Turkheimer FE, Aston JA, Cunningham VJ. Positron emission tomography compartmental models: a basis pursuit strategy for kinetic modeling. J Cereb Blood Flow Metab. 2002;22:1425–1439. doi: 10.1097/01.wcb.0000045042.03034.42. [DOI] [PubMed] [Google Scholar]
- 30.Parsey RV, Ogden RT, Mann JJ. Determination of volume of distribution using likelihood estimation in graphical analysis: elimination of estimation bias. J Cereb Blood Flow Metab. 2003;23:1471–1478. doi: 10.1097/01.WCB.0000099460.85708.E1. [DOI] [PubMed] [Google Scholar]
- 31.Simpson HB, Lombardo I, Slifstein M, et al. Serotonin transporters in obsessive-compulsive disorder: a positron emission tomography study with [11C]McN 5652. Biol Psychiatry. 2003;54:1414–1421. doi: 10.1016/s0006-3223(03)00544-4. [DOI] [PubMed] [Google Scholar]
- 32.Ogden RT. Estimation of kinetic parameters in graphical analysis of PET imaging data. Stat Med. 2003;22:3557–3568. doi: 10.1002/sim.1562. [DOI] [PubMed] [Google Scholar]
- 33.Logan J, Fowler JS, Volkow ND, et al. Graphical analysis of reversible radioligand binding from time-activity measurements applied to [N-11C-methyl]-(−)-cocaine PET studies in human subjects. J Cereb Blood Flow Metab. 1990;10:740–747. doi: 10.1038/jcbfm.1990.127. [DOI] [PubMed] [Google Scholar]
- 34.Ogden RT, Ojha A, Erlandsson K, Oquendo MA, Mann JJ, Parsey RV. In vivo quantification of serotonin transporters using [11C]DASB and positron emission tomography in humans: modeling considerations. J Cereb Blood Flow Metab. 2007;27:205–217. doi: 10.1038/sj.jcbfm.9600329. [DOI] [PMC free article] [PubMed] [Google Scholar]
- 35.Ogden RT, Tarpey T. Estimation in regression models with externally estimated parameters. Biostatistics. 2006;7:115–129. doi: 10.1093/biostatistics/kxi044. [DOI] [PubMed] [Google Scholar]
- 36.Parsey RV, Arango V, Olvet DM, Oquendo MA, Van Heertum RL, John Mann J. Regional heterogeneity of 5-HT1A receptors in human cerebellum as assessed by positron emission tomography. J Cereb Blood Flow Metab. 2005;25:785–793. doi: 10.1038/sj.jcbfm.9600072. [DOI] [PubMed] [Google Scholar]
- 37.Slifstein M, Laruelle M. Effects of statistical noise on graphic analysis of PET neuroreceptor studies. J Nucl Med. 2000;41:2083–2088. [PubMed] [Google Scholar]
- 38.Joshi AFJ, Koeppe R. Linear models for reduction of bias in DVR estimates obtained from reference region-based graphical analysis [abstract] J Nucl Med. 2005;46(suppl):453P. [Google Scholar]