Abstract
Environmental metabolomics is an emerging field that is promoting new understanding in how organisms respond to and interact with the environment and each other at the biochemical level1. Nuclear magnetic resonance (NMR) spectroscopy is one of several technologies, including gas chromatography–mass spectrometry (GC-MS), with considerable promise for such studies. Advantages of NMR are that it is suitable for untargeted analyses, provides structural information and spectra can be queried in quantitative and statistical manners against recently available databases of individual metabolite spectra2,3. In addition, NMR spectral data can be combined with data from other omics levels (e.g. transcriptomics, genomics) to provide a more comprehensive understanding of the physiological responses of taxa to each other and the environment4,5,6. However, NMR is less sensitive than other metabolomic techniques, making it difficult to apply to natural microbial systems where sample populations can be low-density and metabolite concentrations low compared to metabolites from well-defined and readily extractable sources such as whole tissues, biofluids or cell-cultures. Consequently, the few direct environmental metabolomic studies of microbes performed to date have been limited to culture-based or easily defined high-density ecosystems such as host-symbiont systems, constructed co-cultures or manipulations of the gut environment where stable isotope labeling can be additionally used to enhance NMR signals7,8,9,10,11,12. Methods that facilitate the concentration and collection of environmental metabolites at concentrations suitable for NMR are lacking. Since recent attention has been given to the environmental metabolomics of organisms within the aquatic environment, where much of the energy and material flow is mediated by the planktonic community13,14, we have developed a method for the concentration and extraction of whole-community metabolites from planktonic microbial systems by filtration. Commercially available hydrophilic poly-1,1-difluoroethene (PVDF) filters are specially treated to completely remove extractables, which can otherwise appear as contaminants in subsequent analyses. These treated filters are then used to filter environmental or experimental samples of interest. Filters containing the wet sample material are lyophilized and aqueous-soluble metabolites are extracted directly for conventional NMR spectroscopy using a standardized potassium phosphate extraction buffer2. Data derived from these methods can be analyzed statistically to identify meaningful patterns, or integrated with other omics levels for comprehensive understanding of community and ecosystem function.
Keywords: Molecular Biology, Issue 62, environmental metabolomics, metabolic profiling, microbial ecology, plankton, NMR spectroscopy, PCA
Protocol
1. Filter Preparation to Remove Extractables
Use 25-mm diameter 0.22 μm pore-size Durapore PVDF hydrophilic filters (Millipore). Place filters in a clean 500 ml Pyrex beaker using tweezers. Pre-rinse three times with distilled water. Swirl well as you rinse to prevent the filters from sticking to each other. Add 300 ml Milli-Q (Millipore) or equivalent high-quality water. Autoclave to facilitate complete removal of extractables from the filters.
Pour off the Milli-Q and again triple rinse the filters, this time with Milli-Q. Using tweezers place individual filters on a clean dry surface (such as aluminum foil) and either dry at a reasonable temperature (e.g. 37 °C) or air dry. The filters are now ready to use.
2. Filtration of Sample Material
For demonstrating this protocol, a Millipore stainless steel 3-place filter manifold with 25-mm microanalysis filter columns with glass supports and a mechanical pump are used. Using aseptic technique, place a single 25-mm filter on the filter column base, apply the column and clamp together.
Load 15 ml of sample to the column, open the stop-valve on the filter manifold, and turn on the pump. Filter under gentle pressure to minimize cell breakage (<5 kPa). Other pumps, such as hand or a peristaltic pump may be adapted to this protocol. For lower density samples, successive additions of water may be necessary, do not let the filter go dry for an extended period of time between additions of water.
For marine samples, after you have filtered your sample, you can perform an optional freshwater rinse to reduce residual paramagnetic ions in your sample and on the filter. This may help with more precise tuning of the spectrometer magnet. Simply gently add a small volume of water and filter through your collected sample at the end.
Once filtering is finished, turn off the pump, and leave the valve open so there is still negative pressure under the filter. Remove the clamp and filter column.
With one hand, use clean tweezers to take hold of the filter. Fold the filter across itself, but do not crease. With your other hand use the lip of a sterile 2-ml microcentrifuge tube to hold down the filter. Release the tweezers then use them to re-grip both edges of the filter. Regrip at a 45 ° angle to the fold.
Place the filter into the 2-ml tube and release so it opens with the sample side facing inwards. You can place up to two filters into the sterile 2 ml microcentrifuge tube this way. If using two filters, ensure they overlap as little as possible. Immediately freeze (at least -30 °C).
3. Extraction of Aqueous-soluble Metabolites
Lyophilize your samples overnight or for at least 10 hours.
After lyophilization, add a stainless steel crusher to each tube (Tokken). Add 750 μl standardized potassium phosphate NMR buffer in deuterium oxide (2H > 90%) with 2,2-Dimethyl-2-silapentane-5-sulfonate (DSS) standard (KPi; 38.3 mM KH2PO4, 61.7 mM K2HPO4, DSS 0.1 mM, pH 7.0, 90% D2O)2.
Sonicate the samples for 5 minutes at 4 °C in a water sonicator (Bioruptor, Diagenode) to remove the cell material from the filter. Remove the filters with clean tweezers.
Disrupt the cells using a mill crusher (1600 rpm) for 5 minutes.
Incubate at 65 °C with shaking (1400 rpm) on a bench-top shaker (Eppendorf) for 15 minutes.
Remove the metal pig with clean tweezers, and centrifuge the sample at 13,000 g for 5 minutes.
Draw off the supernatant directly to an NMR tube for NMR spectroscopy.
4. NMR Spectroscopy and Data Analysis
Load your sample into a NMR spectrometer (here, a Bruker DRX-500 spectrometer equipped with TXI probe with triple-axis gradient controlled by a computer running XWIN-NMR).
Obtain 1D 1H NMR spectra using appropriate previously published methods2,15 from the XWIN-NMR interface. In the present study 1H NMR spectra were recorded on a DRX-500 spectrometer operating at 500.03 MHz at 298 K. Residual water signals were suppressed by the Watergate pulse sequence, with a repetition time of 1.2 s. 128 transients were collected to obtain 32,000 data points per spectrum.
Transfer the NMR data directories to a PC installed NMRPipe software16. Process the raw data and set DSS as 0 ppm reference then manually phase the spectra. Digitize the spectral data into a set of discrete values by integrating or 'binning' them with software such as rNMR, Automics, or using the publicly available FT2B package from the ECOMICS web site (https://database.riken.jp/ecomics/)3,17. In this example, spectra were integrated between 0.5 and 10.5 ppm over 0.032 ppm integral regions using ECOMICS, and normalized to either DSS or total signal intensity. Output data can now be used for downstream statistical analysis such as principal components analysis (PCA) using free software packages like R18.
5. Representative Results
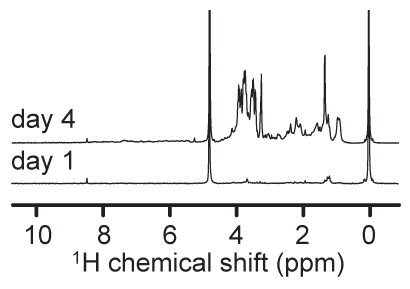
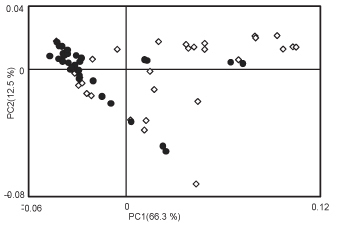
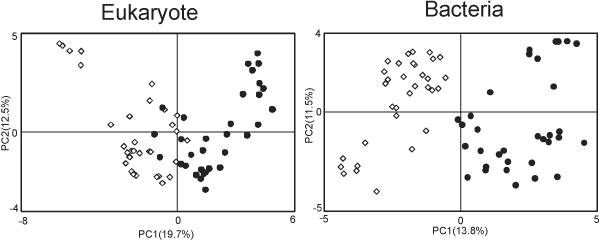
An example of 1H NMR spectra obtained using the above methods are shown in Figure 1. These samples, from two time points of a microcosm experiment show clear differences due to algal metabolic activities. The day 4 spectrum shows considerable abundance of peaks, particularly in the 3-4 ppm range compared to the day 1 sample. These peaks can be attributed to sugars produced by blooming diatoms within the microcosm. In a similar experiment comparing the growth of natural plankton communities in artificial or natural seawater, statistical approaches such as principal component analysis (PCA) score plot derived from binned NMR spectra can be used to show clear metabolic differences between the two treatments (Fig. 2), while the loading plots can identify peaks within the spectra that shape the distribution of the data. Such results can be compared with data from other omics levels, such as from genomic fingerprinting methods (Fig. 3). These NMR peaks can be queried individually (e.g. at the BMRB; http://www.bmrb.wisc.edu/)19, or entire spectra can be analyzed statistically (e.g. with SpinAssign at http://prime.psc.riken.jp/?action=nmr_search)2. In this example, differences between treatments were due to an abundance of peaks in the sugars region (3.39 ppm to 4.04 ppm) of spectra from natural plankton community metabolites, and several peaks characteristic to the artificial seawater communities were tentatively identified as lactate and formate using SpinAssign.
 Figure 1. Representative 1H NMR spectra obtained from samples processed using this procedure. Microcosm samples were taken before (day 1) and during (day 4) an intense diatom bloom. NMR experiments were performed on a Bruker DRX-500 with signals normalized to the internal standard peak height (DSS; 0 ppm).
 Figure 2. Principal component analysis (PCA) score plot for binned NMR spectra from metabolomes of naturally-derived microbial planktonic communities grown in microcosms with natural (open diamonds) or artificial (black circles) seawater. Clear metabolic differences can be observed in the scatterplot. A loading plot from such an analysis can then be used to identify distinct peaks of importance in the system; these peaks can be further analyzed as needed.
 Figure 3. An example of multi-omics analysis combining NMR with genomic data. Community composition based on denaturing gradient gel electrophoresis of 18S (left) and 16S (right) rRNA genes from the same samples as analyzed in Figure 2 also shows distinct microbial community patterns between natural (open diamonds) and artificial (black circles) seawater microcosms. Such correspondence between metabolome and genome from natural systems demonstrates the usefulness of this approach.
Discussion
The filtration and metabolite extraction method demonstrated here allows for microbial planktonic biomass to be collected in sufficient amount for NMR metabolomics. While only extraction of aqueous-soluble metabolites using KPi and 1D 1H NMR is demonstrated, other extraction solvents and spectroscopic approaches can be used. One useful example is the use of deuterated methanol as a semi-polar solvent, which has been shown to produce superior NMR spectra from heterogeneous samples and is less sensitive to contamination by paramagnetic ions as are found in marine samples15. In such cases, the pellet from the extraction above should be retained for successive extractions. Our previous work has shown the stability of spectra under such incubation times and temperatures and the suitability of direct aqueous extraction for NMR spectroscopy15,20. However researchers may also prefer to modify extraction steps, for example by using a denaturing step to inactivate enzymes prior to extraction, or by using rapid-quenching methods that differ from simply freezing the cells as shown here. Additionally, while the methods presented here are best suited for observing proportional changes in metabolites across treatments, if desired, filters can be pre-weighed and then weighed again after sample filtration and lyophilization to obtain dry weight, or the volume of sample filtered can be used to obtain more quantitative metabolite source data.
Ultimately, the utility of NMR for planktonic samples is constrained by the amount of mass that can be successfully collected; even high-density cultures may require large volumes (>100 ml) to obtain sufficient dry biomass. However, within an experimental framework, stable isotope labeling in micro- or mesocosm experiments, 2D 1H-13C heteronuclear single quantum coherence (HSQC) approaches are possible. Further, we have additionally used 47-mm filters and 5-ml polypropylene tubes to increase the amount of biomass that can be collected for extraction, as even larger volumes may be necessary (i.e. > 2 L) for natural communities from, e.g. oligotrophic waters where cell densities are low.
Filtration is advantageous over centrifugation as it is our observation that some smaller microbial taxa (particularly small heterotrophic bacteria) often do not pellet well. Filtration can be performed manually in the field, and the volumes filtered are limited only by the number of filters available. Additionally, excess media or water can be removed in this manner, and the samples can be rinsed if needed. Of course, even with filtration, the community collected will be limited to a size fraction down to the filter cutoff, which in this example is 0.22 μm.
Disclosures
No conflicts of interest declared.
Acknowledgments
This research was supported in part by Grants-in-Aid for Scientific Research for challenging exploratory research (J.K.), and Scientific Research (A) (J.K. and S.M.) from the Ministry of Education, Culture, Sports, Science, and Technology, Japan. A RIKEN FPR fellowship (R.C.E.) provided additional support. The authors express their gratitude to Drs. Eisuke Chikayama, Yasuyo Sekiyama and Mami Okamoto for technical assistance with NMR and statistical analyses.
References
- Bundy JG, Davey MP, Viant MR. Environmental metabolomics: a critical review and future perspectives. Metabolomics. 2008;5:3–21. [Google Scholar]
- Chikayama E, et al. Statistical indices for simultaneous large-scale metabolite detections for a single NMR spectrum. Anal. Chem. 2010;82:1653–1658. doi: 10.1021/ac9022023. [DOI] [PubMed] [Google Scholar]
- Lewis IA, Schommer SC, Markley JL. rNMR: open source software for identifying and quantifying metabolites in NMR spectra. Magn. Reson. Chem. 2009;47:S123–S126. doi: 10.1002/mrc.2526. [DOI] [PMC free article] [PubMed] [Google Scholar]
- Li M, et al. Symbiotic gut microbes modulate human metabolic phenotypes. Proc. Natl. Acad. Sci. U.S.A. 2008;105:2117–2122. doi: 10.1073/pnas.0712038105. [DOI] [PMC free article] [PubMed] [Google Scholar]
- Mochida K, Furuta T, Ebana K, Shinozaki K, Kikuchi J. Correlation exploration of metabolic and genomic diversity in rice. BMC Genomics. 2009;10:568. doi: 10.1186/1471-2164-10-568. [DOI] [PMC free article] [PubMed] [Google Scholar]
- Fukuda S, et al. Bifidobacteria can protect from enteropathogenic infection through production of acetate. Nature. 2011;469:543–547. doi: 10.1038/nature09646. [DOI] [PubMed] [Google Scholar]
- Kikuchi J, Hirayama T. Practical aspects of stable isotope labeling of higher plants for a hetero-nuclear multi-dimensional NMR-based metabolomics. Methods Mol. Biol. 2007;358:273–286. doi: 10.1007/978-1-59745-244-1_15. [DOI] [PubMed] [Google Scholar]
- Martin FP, et al. A top-down systems biology view of microbiome-mammalian metabolic interactions in a mouse model. Mol. Syst. Biol. 2007;3:112. doi: 10.1038/msb4100153. [DOI] [PMC free article] [PubMed] [Google Scholar]
- Mahrous EA, Lee RB, Lee RE. A rapid approach to lipid profiling of mycobacteria using 2D HSQC NMR maps. J. Lipid Res. 2008;49:455–463. doi: 10.1194/jlr.M700440-JLR200. [DOI] [PubMed] [Google Scholar]
- Fukuda S, et al. Evaluation and characterization of bacterial metabolic dynamics with a novel profiling technique, real-time metabolotyping. PloS ONE. 2009;4:e4893. doi: 10.1371/journal.pone.0004893. [DOI] [PMC free article] [PubMed] [Google Scholar]
- Date Y, et al. New monitoring approach for metabolic dynamics in microbial ecosystems using stable-isotope-labeling technologies. J. Biosci. Bioeng. 2010;110:87–93. doi: 10.1016/j.jbiosc.2010.01.004. [DOI] [PubMed] [Google Scholar]
- Nakanishi Y, et al. Dynamic omics approach identifies nutrition-mediated microbial interactions. J. Proteome Res. 2011;10:824–836. doi: 10.1021/pr100989c. [DOI] [PubMed] [Google Scholar]
- Falkowski P, Barber R, Smetacek V. Biogeochemical controls and feedbacks on ocean primary production. Science. 1998;281:200–207. doi: 10.1126/science.281.5374.200. [DOI] [PubMed] [Google Scholar]
- Viant MR. Metabolomics of aquatic organisms: the new 'omics' on the block. Mar. Ecol. Prog. Ser. 2007;332:301–306. [Google Scholar]
- Sekiyama Y, Chikayama E, Kikuchi J. Evaluation of a semipolar solvent system as a step toward heteronuclear multidimensional NMR-based metabolomics for 13C-labeled bacteria, plants, and animals. Anal. Chem. 2011;83:719–726. doi: 10.1021/ac102097u. [DOI] [PubMed] [Google Scholar]
- Delaglio F, et al. NMRPipe: A multidimensional spectral processing system based on UNIX pipes. J. Biomol. NMR. 1995;6:277–293. doi: 10.1007/BF00197809. [DOI] [PubMed] [Google Scholar]
- Wang T, et al. Automics: an integrated platform for NMR-based metabonomics spectral processing and data analysis. BMC Bioinformatics. 2009;10:83. doi: 10.1186/1471-2105-10-83. [DOI] [PMC free article] [PubMed] [Google Scholar]
- The R Project for Statistical Computing. 2010. Available from: http://www.r-project.org/
- Eldon L, et al. BioMagResBank. Nucleic Acids Res. 2007;36:D402–D408. doi: 10.1093/nar/gkm957. [DOI] [PMC free article] [PubMed] [Google Scholar]
- Sekiyama Y, Chikayama E, Kikuchi J. Profiling polar and semipolar plant metabolites throughout extraction processes using a combined solution-state and high-resolution magic angle spinning NMR approach. Anal. Chem. 2011;82:1643–1652. doi: 10.1021/ac9019076. [DOI] [PubMed] [Google Scholar]


