

Abstract
Introduction
Chondroitin sulfate (CS) is a symptomatic slow-acting drug for osteoarthritis (OA) widely used in the clinic. The aim of this work is to find proteins whose secretion from cartilage cells under proinflammatory stimuli (IL-1β) is regulated by CS, employing a novel quantitative proteomic approach.
Methods
Human articular chondrocytes released from three normal cartilages were grown in SILAC medium. When complete incorporation of the heavy isotope was achieved, chondrocytes were stimulated with IL-1β 5 ng/ml with or without CS pretreatment (200 µg/ml). Forty-eight hours later, chondrocyte secretomes were analyzed by nano-scale liquid chromatography-mass spectrometry. Real-time PCR, western blot and immunohistochemistry analyses were employed to confirm some of the results.
Results
We could identify 75 different proteins in the secretome of human articular chondrocytes. Eighteen of these were modulated by CS with statistical significance (six increased and 12 decreased). In normal chondrocytes stimulated with IL-1β, CS reduces inflammation directly by decreasing the presence of several complement components (CFAB, C1S, CO3, and C1R) and also indirectly by increasing proteins such as TNFα-induced protein (TSG6). TSG6 overexpression correlates with a decrease in pro-matrix metalloproteinase activation (observed in MMP1 and MMP3 levels). Finally, we observed a strong CS-dependent increase of an angiogenesis inhibitor, thrombospondin-1.
Conclusion
We have generated a quantitative profile of chondrocyte extracellular protein changes driven by CS in the presence of IL-1β. We have also provided novel evidences of its anti-angiogenic, anti-inflammatory, and anti-catabolic properties. Demonstration of the anti-angiogenic action of CS might provide a novel therapeutic approach for OA targeting.
Introduction
Osteoarthritis (OA) is one of the most prevalent chronic diseases affecting older people. Although its major feature is the progressive destruction of articular cartilage, it is now accepted that OA is a global disease of the joint, also involving the synovial membrane, subchondral bone and periarticular soft tissues [1]. Effective prevention of the structural damage must be a key objective of new therapeutic approaches to treat OA. However, drugs currently available are predominantly directed towards the symptomatic relief of pain and inflammation, doing little to reduce joint destruction [2].
Until now the pharmacological management of OA has been dominated by nonsteroidal anti-inflammatory drugs and analgesics (mainly paracetamol). However, the use of chondroitin sulfate (CS) by OA patients, alone or in combination with glucosamine sulfate (GS), has been rising globally over the last decade. Both molecules are well recognized as symptomatic slow-acting drugs for OA. Moreover, their application has an excellent safety profile, allowing long-term treatment [3-6]. Nevertheless, recent meta-analysis [7] and large-scale clinical trials [8] have demonstrated variable effects on OA symptoms, yielding conflicting results. For this reason, in 2010 we carried out the first pharmacoproteomic analysis of articular chondrocytes treated with exogenous CS and/or GS [9] with the aim of defining more clearly the effects of GS and CS on cartilage biology. In that work, we performed a classical proteomic approach by two-dimensional electrophoresis and mass spectrometry (MS) to describe the cellular proteome of normal human chondrocytes treated with both drugs, alone or in combination, in the presence of IL-1β, a proinflammatory cytokine that plays a pivotal role in the pathogenesis of OA [10]. A large number of target proteins of CS and GS were described, pointing out the wide range effects of these drugs on fundamental aspects of chondrocyte metabolism but also their alternative mechanisms of action in a system model of OA [9].
Once the utility of proteomics for analyzing the putative intracellular targets of CS and GS in cartilage cells was proved [9], we focused on the subset of chondrocyte extracellular proteins that are essential for cartilage extracellular matrix (ECM) synthesis and turnover processes. Furthermore, secreted proteins may end up in the bloodstream, and thereby may have potential use as non-invasive biomarkers [11]. For these reasons, the chondrocyte secretome has emerged as an attractive starting point for the discovery of new OA drug targets, for the monitoring of clinical trials or for the personalization and optimization of long-term therapies. We recently published the first quantitative study of the secretome of primary human articular chondrocytes (HACs) by chondrocyte metabolic labeling, using an in vitro model of inflammation by stimulation with IL-1β [12]. In the present work, we aimed to employ this model to generate a quantitative profile of chondrocyte extracellular protein changes driven by CS in the presence of the proinflammatory stimulus, which might provide novel molecular evidence for CS effects.
Materials and methods
Cartilage procurement and processing
Macroscopically normal human knee cartilage from three adult donors (70, 73 and 78 years old) with no history of joint disease was provided by the Tissue Bank and the Autopsy Service at CHU A Coruña for the proteomic analysis. The study was approved by the local ethics committee. Cartilage was processed as previously described [13].
Primary culture of chondrocytes
HACs were isolated as described previously [9,13]. Briefly, cartilage surfaces were rinsed with saline buffer, and scalpels were used to cut parallel vertical sections 5 mm apart from the cartilage surface to the subchondral bone. These cartilage strips were dissected from the bone, and the tissue was incubated with trypsin at 37°C for 10 minutes and then digested with type IV clostridial collagenase. The release of chondrocytes from cartilage was achieved after 16 hours of digestion in an incubator at 37ºC, 5% carbon dioxide.
Chondrocyte metabolic labeling and differential treatment of SILAC cell populations
The isolated chondrocytes were recovered and plated at low density in SILAC DMEM-Flex (Invitrogen, Paisley, UK) deficient in arginine (R) and lysine (K) supplemented with 10% dialyzed fetal bovine serum (Gibco, Invitrogen), 4.5 g/l glucose (Sigma, St. Louis, MO, USA), 2 mM L-glutamine (Sigma), 100 units/ml penicillin and 100 µg/ml streptomycin. In the case of light media, standard L-lysine and L-arginine were used, while in the heavy media, isotope-labeled L-lysine (13C6) and isotope-labeled L-arginine (13C6,15N4) were used. For the initial cell expansion, 5×10⁴ chondrocytes from each donor were seeded in two T-25 cell culture flasks (one grown in light medium and one in heavy medium). At confluence cells were recovered from each culture flask by trypsinization and seeded onto two six-multiwell plates (15×104 for well) for cell treatment. Chondrocytes were used at week 3 in primary culture, when 100% of labeling was reached. Verification of complete labeling was performed as previously described [12]. Briefly, a small aliquot of cells cultured in the heavy media were subjected to protein extraction. The extracts were then digested with trypsin and analyzed by nano-scale liquid chromatography (LC)-MS to determine the degree of incorporation by looking for the presence of light peptides. Verification of cell type was carried out by real-time PCR for the analysis of type II collagen mRNA expression under the conditions of study.
The chondroitin sulfate employed in this work is of bovine origin, with a CS content of 99.9% and a molecular weight of 15.12 kDa. Other characteristics (viscosity, sulfation sites, and so forth) have been previously detailed elsewhere [14]. Chondrocyte stimulation for the experiments was carried out following procedures previously described by our group, in which CS and IL-1β concentrations in the chondrocyte cultures were optimized for the proteomic studies [9,12]. Briefly, cells were washed thoroughly to remove abundant serum proteins and were cultured in serum-free medium with or without chondroitin sulfate (200 μg/ml; Bioibérica, Barcelona, Spain). Two hours later, IL-1β was added to the culture media (5 ng/ml; Sigma). Finally, conditioned media were collected after 48 hours of culture. Cell viability was assessed by Trypan Blue dye exclusion.
Processing of conditioned media for analysis by LC-MS
Conditioned media obtained from three different donors were analyzed independently. In addition, the off-gel measurements were performed in duplicate to assess the technical reproducibility of the LC-MS set-up.
Conditioned media were collected, centrifuged and filtered using a 0.2 µm filter to ensure removal of any dead cells. Proteins in the individual medium were precipitated with 0.02% sodium deoxycholate for 10 minutes and then with 10% (v/v) trichloroacetic acid overnight at 4ºC. Precipitates were harvested by centrifugation at 13,000 rpm for 15 minutes at 4°C and then washed twice with ice-cold acetone. The protein pellets were dried in air and then resuspended in 6 M urea, 2 M thiourea and 25 mM ammonium bicarbonate. The protein content of the concentrated media was measured using the Bradford reagent from Sigma. Heavy and light samples were then mixed 1:1, and 4 μg of each mixed sample were in-solution reduced, alkylated and digested with trypsin. Digestion was performed overnight with 12.5 ng/l Sequencing Grade Modified Trypsin (Promega, Madison, WI, USA) at 37ºC. The mixtures were acidified with Trifluoroacetic acid (1% final concentration) to stop the enzymatic reaction. The resulted peptides were desalted and filtered through a C18 microcolumn (NuTip; Glygen, Columbia, MD, USA) and finally eluted from the C18 bed using 70% Acetonitrile/0.1% TFA. The organic component was removed by evaporating in a vacuum centrifuge and the peptides were resuspended in 2% Acetonitrile/0.1% TFA. Then 5 µl were injected into a reversed-phase column (Integrafit C18, Proteopep™ II; New Objective, Woburn, MA, USA) for nano-flow LC analysis, using a Tempo nanoLC (Eksigent, Dublin, CA, USA) equipped with a Sun Collect MALDI Spotter/Micro-Fraction Collector (SunChrom GmbH, Friedrichsdorf, Germany).
Nano-scale LC-MALDI-MS analysis
LC eluate was deposited onto an Opti-TOF LC MALDI target plate (1,534-spot format; ABSciex, Framingham, MA, USA) with a speed of one spot per 15 seconds. Before spotting, the LC microfractions were mixed with MALDI matrix (3 mg/ml α-cyano-4-hydroxycinnamic acid in 70% Acetonitrile and 0.1% TFA containing 10 fmol/μl angiotensin as internal standard). Peptide-containing LC spots were analyzed in a 4800 MALDI-TOF/TOF instrument (ABSciex) with a 200 Hz repetition rate (Nd:YAG laser). MS full-scan spectra were acquired from 800 to 4,000 m/z. A total of 1,500 laser shots were accumulated for each time-of-flight MS spectrum at an optimized fixed laser setting. Tandem MS mode was operated with 1 kV collision energy with CID gas (air) over a range of 60 to -20 m/z of the precursor mass value. The precursor mass window was 300 ppm (full width at half-maximum) in relative mode. A minimum of 800 and a maximum of 1,500 laser shots were accumulated with laser stop conditions set at 10 product ion peaks of signal-to-noise ratio >100 at an optimized, fixed laser setting with metastable suppressor option on. Data-dependent tandem MS settings included acquisition of up to 20 of the most intense ion signals per spot. If two or more consecutive spots in an LC run with precursor m/z were within 200 ppm tolerance, the spot with the maximum signal-to-noise ratio was subjected to tandem MS analysis.
Data analysis
Peptide and protein identification and comparative quantification were performed using the Protein Pilot software vs 3.0 (ABSciex) with Paragon Algorithm. MS/MS data was searched against the UniProt/Swiss-Prot database of protein sequences (August 2010; Swiss-Prot, Geneva, Switzerland), using the following parameters: sample type set as SILAC (Lis+6, Arg+10), cysteine alkylation with Iodoacetamide, urea denaturation, one missed cleavage allowed in trypsin digestion and focus in biological modifications. Only proteins with a threshold >95% confidence (>1.3 unused score) were considered for protein identification. Data were normalized for mixing error by bias corrections.
Real-time PCR assays
Total RNA was isolated from chondrocytes (5×10⁵ per well) using Trizol Reagent (Invitrogen, Carlsbad, CA, USA), following the manufacturer's instructions. cDNA was synthesized from 1 μg total RNA, using the Transcriptor First Strand cDNA Synthesis Kit (Roche Applied Science, Mannheim, Germany) in accordance with the manufacturer's instructions, and was analyzed by quantitative real-time PCR. The quantitative real-time PCR assay was performed in the LightCycler 480 instrument (Roche Applied Science) using 96-well plates. Primers for thrombospondin-1 (TSP1), TNFα-induced protein (TSG6) and the housekeeping genes, HPRT1 and RPLP0, were designed using the Universal Probe Library tool from the Roche website [15]. Primer sequences were as follows: TSP1 forward, 5'-GCTGCACTGAGTGTCACTGTC-3'; TSP1 reverse, 5'-TCAGGAACTGTGGCATTGG-3'; TSG6 forward, 5'-GCTAGAGGCAGCCAGAAAAA-3'; TSG6 reverse, 5'-ATCCAACTCTGCCCTTAGCC-3'; HPRT1 forward, 5'-TGACCTTGATTTATTTTGCATACC-3'; HPRT1 reverse, 5'-CGAGCAAGACGTTCAGTCCT-3'; RPLP0 forward, 5'-TCTACAACCCTGAAGTGCTTGAT-3', PRPL0 reverse 5'-CAATCTGCAGACAGACACTGG-3'. The results were analyzed using the LightCycler 480 software release 1.5.0 (Roche Applied Science), which automatically recorded the threshold cycle (Ct). An untreated cell sample (basal) was used as the calibrator; the fold-change for this sample was 1.0. Target gene Ct values were normalized against HPRT1 and RPLP0. Data were analyzed using the 2-ΔΔCt method and expressed as the fold-change of the test sample compared with the basal condition [16].
Western blot analysis
Western blot analyses were performed utilizing standard procedures. Briefly, 20 μg secreted proteins and 50 μg intracellular proteins were loaded and resolved using 10% SDS-PAGE. The separated proteins were then transferred to polyvinylidene fluoride membranes (Immobilon P; Millipore Co., Bedford, MA, USA) by electroblotting and probed with specific antibodies against TSP1 (Santa Cruz Biotechnology, Santa Cruz, CA), TSG6 (Abnova, Taipei, Taiwan), MMP1 and MMP3 (Abcam, Cambridge, UK). Immunoreactive bands were detected and housekeeping control GAPDH (Sigma). Immunoreactive bands were detected by chemiluminescence using corresponding horseradish peroxidase-conjugated secondary antibodies and enhanced chemiluminescence detection reagents (GE Healthcare, Uppsala, Sweden), and then digitized using the LAS 3000 image analyzer (Fujifilm, Tokyo, Japan). For secretome samples, equivalent loadings were verified by Ponceau Red (Sigma) staining after transference (data not shown). Quantitative changes in band intensities were evaluated using ImageQuant 5.2 software (GE Healthcare).
Immunohistochemical analysis
Cartilage shavings from three healthy donors different from those selected for the proteomics strategy were cut into 6 mm discs using a sterile biopsy punch, and one disc/well was placed into 96-well plates containing 200 µl serum-free DMEM. Plates were incubated for 48 hours with 200 µg/ml CS in presence of IL-1β (5 ng/ml). Frozen samples were then cut at 4 μm with a cryostat (Leica Microsystems, Barcelona, Spain) for immunohistochemical analysis. Sections were incubated with primary antibody to detect the presence of TSP1 (1:50; Santa Cruz Biotechnology, Heidelberg, Germany). The peroxidase/DAB ChemMate™ DAKO EnVision™ detection kit (Dako, Barcelona, Spain) was used to determine antigen-antibody interactions. Negative staining controls were achieved by omitting the primary mAb. Samples were visualized using an optical microscope.
Statistical analysis
Each experiment was repeated at least three times. The statistical significance of the differences between mean values was determined using a two-tailed t-test, considering P ≤ 0.05 significant. In the proteomic analysis, normalization tools and the statistical package from Protein Pilot software were employed (ABSciex). We considered statistically significant only those changes with P ≤ 0.05 and a ratio ≥1.2 (or ≤0.83). Where appropriate, results are expressed as the mean ± standard error.
Results and discussion
Most CS exists as the sugar chains of aggrecan in the cartilage, and its high water-retaining capacity ensures proper cartilage hydration [17]. However, several data in the literature reveal that the mechanism of action of CS is not limited to the fact that it is part of the aggrecan; in vivo studies in animal models and in vitro studies with human and animal articular cells suggest that the effects of CS result from a combination of numerous factors [18]. We have performed a gel-free quantitative proteomics experiment for the secretome analysis (cell-conditioned media) of HACs treated with bovine CS (95% purity) in the presence of IL-1β. Although HAC supernatants lack the complexity of the intact cartilage ECM, chondrocyte secretome may represent an attractive subproteome for understanding the chondroprotective action of CS [19,20].
Secretome profiling of IL-1β and CS-treated HACs
Given the key role of chondrocytes in ECM synthesis and turnover, and also the importance of these mechanisms for tissue maintenance (which are disturbed in OA and other joint diseases), we examined the effect of CS in the subset of proteins secreted by chondrocytes (secretome) in an inflammatory environment (IL-1β). Inflammatory molecules, such as proinflammatory cytokines, are critical mediators of the disturbed metabolism and enhance the catabolism of joint tissue involved in OA pathophysiology [21]. For this purpose, supernatants from IL-1β-stimulated chondrocytes, with or without CS treatment, were collected after 48 hours of incubation and were analyzed. Owing to the low complexity of the secretome samples, we carried out a monodimensional approach: we combined equal amounts of proteins from the experimental conditions to be compared (treated or untreated with CS, both in the presence of the cytokine), and then these samples were digested in solution with trypsin. The correspondent tryptic peptides were separated by LC and the peptides were subsequently eluted and subjected to mass spectrometry analysis (MALDI-MS/MS).
This procedure resulted in the identification of 75 proteins present in the culture media of IL-1β-treated cells with statistical confidence (73 with Protein Pilot score ≥2). Some of them had not been previously reported to be secreted by chondrocytes [12], but they were found in serum [22] and/or synovial fluid [23] of OA patients and thus possess putative biomarker value. A complete list of these proteins is shown in Table 1. The majority of the identified secreted proteins were cartilage ECM proteins, or proteins with well-established matrix functions. Furthermore, several mediators of the inflammatory response were detected. The molecular function of the identified proteins was categorized by GeneOntology and is shown in Figure 1. The most abundant proteins identified in the samples (in terms of Protein Pilot hits, see Table 1) included well-known cartilage-related proteins, namely fibronectin (FN1) and chitinase-3-like protein 1 (CHI3L1), as well as ECM degradative enzymes, such as stromelysin-1 (MMP3) and interstitial collagenase (MMP1).
Table 1.
Proteins identified in the secretome of IL-1β-stimulated chondrocytes with or without CS treatment
| Symbol | Score | Peptides (95%) | Covariance (%) | Accession numbera | Name | Function | OA serum [22] | OA synovial fluid [23] |
|---|---|---|---|---|---|---|---|---|
| MMP2 | 20.24 | 17 | 36.4 | [P08253] | 72 kDa type IV collagenase | Angiogenesis/collagen degradation | x | |
| A1AT | 2 | 2 | 6 | [P01009] | Alpha-1-antitrypsin | Inhibitor of serine proteases | ||
| ANXA2 | 2 | 1 | 36 | [P07355] | Annexin A2 | Heat-stress response | ||
| B2MG | 4 | 3 | 26.9 | [P61769] | Beta-2-microglobulin | Immunity | x | |
| PGS1 | 4.03 | 3 | 13.9 | [P21810] | Biglycan | Collagen fiber assembly/ECM component | ||
| CATB | 3.06 | 2 | 15.3 | [P07858] | Cathepsin B | Thiol protease | ||
| CCL2 | 6 | 4 | 38.4 | [P13500] | C-C motif chemokine 2b | Inflammatory response | ||
| CCL8 | 4 | 2 | 38.4 | [P80075] | C-C motif chemokine 8b | Inflammatory response | ||
| CH3L1 | 63.26 | 96 | 82 | [P36222] | Chitinase-3-like protein 1 | ECM component | x | |
| CH3L2 | 2 | 2 | 17.7 | [Q15782] | Chitinase-3-like protein 2b | ECM component | ||
| CLUS | 10.09 | 9 | 43.2 | [P10909] | Clusterin | Immunity | x | x |
| CCD80 | 2 | 1 | 23.3 | [Q76M96] | Coiled-coil domain-containing protein 80 | Cell adhesion and matrix assembly | ||
| CO3A1 | 2.02 | 1 | 14.3 | [P02461] | Collagen alpha-1(III) chain | ECM component | ||
| CO6A1 | 4.16 | 4 | 28.5 | [P12109] | Collagen alpha-1(VI) chain | ECM component | ||
| COCA1 | 17.35 | 10 | 21.1 | [Q99715] | Collagen alpha-1(XII) chain | ECM component | ||
| CO1A2 | 27.65 | 25 | 55.2 | [P08123] | Collagen alpha-2(I) chain | ECM component | ||
| C1R | 8.13 | 7 | 31.5 | [P00736] | Complement C1r subcomponent | Immunity | x | x |
| C1S | 10.6 | 9 | 27.3 | [P09871] | Complement C1s subcomponent | Immunity | x | x |
| CO3 | 13.4 | 7 | 26.4 | [P01024] | Complement C3 | Immunity | x | |
| CFAB | 8.29 | 6 | 17.2 | [P00751] | Complement factor B | Immunity | x | x |
| CXCL3 | 4.01 | 4 | 69.2 | [P19876] | C-X-C motif chemokine 3b | inflammatory response | ||
| CXCL5 | 2 | 1 | 20.2 | [P42830] | C-X-C motif chemokine 5b | Inflammatory response | ||
| CXCL6 | 4.13 | 5 | 38.6 | [P80162] | C-X-C motif chemokine 6b | Inflammatory response | ||
| CYTC | 4 | 3 | 67.1 | [P01034] | Cystatin-C | Inhibitor of cysteine proteinases | x | |
| PGS2 | 23.72 | 22 | 56 | [P07585] | Decorin | ECM component | ||
| DESP | 2 | 1 | 24.8 | [P15924] | Desmoplakinb | Cell junction | x | |
| FBLN3 | 15.7 | 12 | 31.2 | [Q12805] | EGF-containing fibulin-like extracellular matrix protein 1 | Negative regulator of chondrocyte differentiation | x | x |
| FINC | 152.34 | 150 | 58.9 | [P02751] | Fibronectin | ECM component | x | x |
| FBLN1 | 2 | 1 | 11.2 | [P23142] | Fibulin-1 | Cell adhesion/ECM organization | x | |
| FSTL1 | 2.1 | 2 | 16.2 | [Q12841] | Follistatin-related protein 1 | Cell proliferation and differentiation | ||
| GDN | 24.73 | 23 | 54.5 | [P07093] | Glia-derived nexin | Serine protease inhibitor | ||
| GROA | 4 | 5 | 54.2 | [P09341] | Growth-regulated alpha protein | Inflammatory response | ||
| IBP3 | 12.02 | 12 | 57.7 | [P17936] | Insulin-like growth factor-binding protein 3 | Cell proliferation and differentiation | x | |
| IBP4 | 3.36 | 3 | 37.6 | [P22692] | Insulin-like growth factor-binding protein 4 | Cell proliferation and differentiation | ||
| IBP5 | 4.03 | 2 | 55.5 | [P24593] | Insulin-like growth factor-binding protein 5 | Cell proliferation and differentiation | ||
| IBP6 | 3.85 | 3 | 43.8 | [P24592] | Insulin-like growth factor-binding protein 6 | Cell proliferation and differentiation | x | |
| IBP7 | 2.15 | 3 | 29.1 | [Q16270] | Insulin-like growth factor-binding protein 7 | Cell proliferation and differentiation | ||
| IL6 | 16 | 16 | 42 | [P05231] | IL-6 | Inflammatory response | ||
| IL8 | 4.24 | 6 | 57.6 | [P10145] | IL-8 | Inflammatory response | ||
| MMP1 | 35.12 | 38 | 50.1 | [P03956] | Interstitial collagenase | Collagen degradation | ||
| K1C10 | 60.82 | 36 | 66.8 | [P13645] | Keratin, type I cytoskeletal 10 | Intermediate filament | x | x |
| K1C14 | 11.36 | 7 | 44.9 | [P02533] | Keratin, type I cytoskeletal 14b | Intermediate filament | ||
| K1C16 | 15.45 | 8 | 48 | [P08779] | Keratin, type I cytoskeletal 16b | Intermediate filament | ||
| K1C9 | 30.98 | 19 | 60.2 | [P35527] | Keratin, type I cytoskeletal 9 | Intermediate filament | x | x |
| K2C1 | 70.89 | 41 | 69.6 | [P04264] | Keratin, type II cytoskeletal 1 | Intermediate filament | x | x |
| K22E | 43.26 | 22 | 69.2 | [P35908] | Keratin, type II cytoskeletal 2 epidermal | Intermediate filament | x | x |
| K2C6B | 20.77 | 11 | 53.9 | [P04259] | Keratin, type II cytoskeletal 6Bb | Intermediate filament | x | |
| MFGM | 6.01 | 4 | 20.9 | [Q08431] | Lactadherin | Angiogenesis | ||
| LUM | 28.15 | 30 | 60.7 | [P51884] | Lumican | ECM component | x | x |
| CSF1 | 4.01 | 2 | 17.3 | [P09603] | Macrophage colony-stimulating factor 1b | Inflammatory response | ||
| TIMP1 | 17.8 | 16 | 57.5 | [P01033] | Metalloproteinase inhibitor 1 | Metalloprotease inhibitor | x | |
| TIMP2 | 4 | 3 | 32.7 | [P16035] | Metalloproteinase inhibitor 2 | Metalloprotease inhibitor | ||
| PTX3 | 2.02 | 2 | 14.4 | [P26022] | Pentraxin-related protein PTX3 | Inflammatory response | ||
| PLTP | 5.8 | 4 | 31 | [P55058] | Phospholipid transfer protein | Lipid transport | x | x |
| IC1 | 4 | 2 | 18.8 | [P05155] | Plasma protease C1 inhibitor | Immunity | x | x |
| POTEF | 2.03 | 1 | 27.6 | [A5A3E0] | POTE ankyrin domain family member Fb | Unknown | ||
| SAP | 2 | 1 | 5 | [P07602] | Proactivator polypeptideb | Lipid metabolism | ||
| PCOC1 | 5.93 | 4 | 19.8 | [Q15113] | Procollagen C-endopeptidase enhancer 1 | Collagen metabolism | x | |
| S10A8 | 1.54 | 1 | 35.5 | [P05109] | Protein S100-A8b | Inflammatory response | x | |
| S10A9 | 4 | 2 | 34.2 | [P06702] | Protein S100-A9b | Inflammatory response | x | |
| PRG4 | 3.7 | 3 | 21.9 | [Q92954] | Proteoglycan 4b | ECM component | x | x |
| TRY6 | 4 | 2 | 15.4 | [Q8NHM4] | Putative trypsin-6b | Serine protease | ||
| NPT2C | 2 | 1 | 10.9 | [Q8N130] | Sodium-dependent phosphate transport protein 2Cb | Ion transport | ||
| SPRC | 2 | 2 | 7.3 | [P09486] | SPARC | Cell proliferation and differentiation | x | |
| MMP3 | 48.64 | 47 | 71.9 | [P08254] | Stromelysin-1 | Collagen degradation | x | |
| QSOX1 | 4.87 | 4 | 16.3 | [O00391] | Sulfhydryl oxidase 1 | Cell redox homeostasis | x | |
| SDC4 | 2 | 1 | 13.6 | [P31431] | Syndecan-4 | ECM component | ||
| TARSH | 8.86 | 9 | 27.4 | [Q7Z7G0] | Target of Nesh-SH3 | Cell proliferation and differentiation | x | |
| TENA | 13.36 | 8 | 22.5 | [P24821] | Tenascin | Cell adhesion/ECM organization | ||
| TETN | 4 | 4 | 34.2 | [P05452] | Tetranectin | Bone mineralization | x | x |
| TSP1 | 2.36 | 2 | 18.5 | [P07996] | Thrombospondin-1 | Angiogenesis | x | |
| BGH3 | 2 | 1 | 22.6 | [Q15582] | TGF-beta-induced protein ig-h3 | TGF-beta signaling | x | |
| TSG6 | 28.35 | 30 | 69.3 | [P98066] | TNF-inducible gene 6 protein | Cell adhesion | ||
| VCAM1 | 2 | 1 | 12.2 | [P19320] | Vascular cell adhesion protein 1 | Cell adhesion | x | |
| VASN | 2 | 2 | 14.7 | [Q6EMK4] | Vasorin | TGF-beta signaling | x |
Proteins identified by SILAC and liquid chromatography-mass spectrometry analysis in the secretome of IL-1β-stimulated chondrocytes with or without chondroitin sulfate treatment. ECM, extracellular matrix; EGF, epidermal growth factor; TGF, transforming growth factor. aProtein accession number according to the SwissProt and TrEMBL databases. bProtein not identified in our previous analysis of chondrocyte secretome [12].
Figure 1.
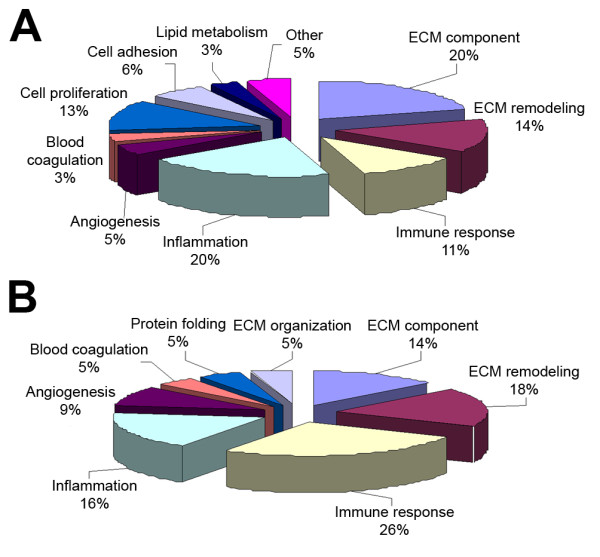
Bioinformatic analysis of identified and differentially abundant proteins. Bioinformatic analysis of (A) identified and (B) differentially abundant proteins according to the Gene Ontology database. The functional distribution graph reveals anti-inflammatory and immunomodulatory properties of chondroitin sulfate, apart from its role in extracellular matrix (ECM) structure.
CS-mediated changes in the chondrocyte secretome
By these means we were able to relatively quantify all the identified proteins with statistical significance. To confirm our findings and exclude the possibility of any quantification differences arising from SILAC labeling [24], the whole experiment was replicated with treatment conditions crossed over (swapping the labeled state of the perturbed cells). Finally, among the identified proteins, 18 presented a significant alteration of their levels due to the pharmacological treatment (six increased and 12 decreased), which are listed in Table 2. We detected the modulation of proteins involved in several processes, such as cartilage ECM structural organization (three proteins, including noncollagenous proteins and proteoglycans), ECM remodeling (four proteins, including proteases and their inhibitors), immune response (six proteins) and angiogenesis (two proteins).
Table 2.
Extracellular proteins modulated by chondroitin sulfate treatment in IL-1β-stimulated chondrocytes
| Accession numbera | Name | Symbol | Ratiob | P value | Error factorc |
|---|---|---|---|---|---|
| [P00751] | Complement factor B | CFAB | 0.5566 | 0.0064 | 1.397 |
| [Q08431] | Lactadherin | MFGM | 0.597 | 0.0151 | 1.3855 |
| [Q7Z7G0] | Target of Nesh-SH3 | TARSH | 0.7017 | 0.006 | 1.2209 |
| [P09871] | Complement C1s subcomponent | C1S | 0.7085 | 0.0007 | 1.1398 |
| [P01024] | Complement C3 | CO3 | 0.7241 | 0.0023 | 1.1999 |
| [P02751] | Fibronectin | FINC | 0.7321 | 0.0006 | 1.1891 |
| [P03956] | Interstitial collagenase | MMP1 | 0.7113 | 0 | 1.0977 |
| [P00736] | Complement C1r subcomponent | C1R | 0.7734 | 0.0071 | 1.1755 |
| [P08253] | 72 kDa type IV collagenase | MMP2 | 0.7759 | 0.0001 | 1.0999 |
| [P36222] | Chitinase-3-like protein 1 | CH3L1 | 0.8088 | 0.0216 | 1.4096 |
| [P10909] | Clusterin | CLUS | 0.8224 | 0.05 | 1.2162 |
| [P08254] | Stromelysin-1 | MMP3 | 0.8256 | 0.0086 | 1.1378 |
| [P07093] | Glia-derived nexin | GDN | 1.2894 | 0.0031 | 1.1664 |
| [O00391] | Sulfhydryl oxidase 1 | QSOX1 | 1.3064 | 0.0382 | 1.2709 |
| [Q92954] | Proteoglycan 4 | PRG4 | 1.4393 | 0.05 | 1.445 |
| [P98066] | TNF-inducible gene 6 protein | TSG6 | 1.7773 | 0.0007 | 1.3371 |
| [P61769] | Beta-2-microglobulin | B2MG | 2.1652 | 0.0125 | 1.4553 |
| [P07996] | Thrombospondin-1 | TSP1 | 89.1678 | 0 | >2 |
Extracellular proteins identified by SILAC and liquid chromatography-mass spectrometry analysis as modulated by CS treatment in IL-1β-stimulated chondrocytes. aProtein accession number according to the SwissProt and TrEMBL databases. bAverage SILAC ratios (n = 3) that represent the relative protein abundance in CS-treated versus untreated cells, calculated by Protein Pilot 3.0 software (ABSciex). P ≤ 0.05 was accepted. cError factor of the quantification (measure of the error in the average quantification ratio as calculated by Protein Pilot 3.0 software).
Interestingly, we found distinctively in CS-treated cells a global decrease of immunity-related proteins, degradative enzymes (such as MMP1, MMP2, and MMP3), and some ECM structural proteins (such as fibronectin (FN1) and chitinase-3-like protein 1 (CHI3L1)). Among those proteins described in our previous work as increased by IL-1β [12], which were now decreased by CS, we found FN1 and CHI3L1, two components of normal cartilage matrix (Figure 2). Synthesis and release of both proteins and fragments is often increased in cartilage that is undergoing repair or remodeling, and they have been investigated as markers of cartilage damage in OA [25-27]. Interestingly, the release of FN1 and CHI3L2 from chondrocytes was also detected in a previous proteomic analysis from our group, which aimed to evaluate the differential effect of three distinct CS molecules in chondrocytes [28]. In that work, the presence of these proteins in the chondrocyte secretomes was caused by treatment with a CS of porcine origin, which appeared to trigger catabolic effects in chondrocytes by increasing also the abundance of matrix metalloproteinases (MMP1 and MMP3). On the contrary, treatment with bovine CS (the one employed in the present study) did not have any effect on the release of these four proteins.
Figure 2.
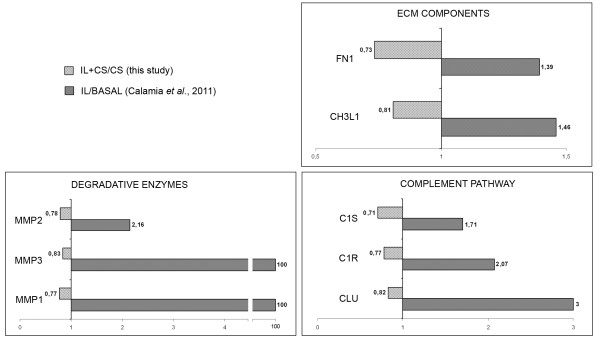
Role of chondroitin sulfate in counteracting IL-1β-mediated increase of proteins. Role of chondroitin sulfate (CS) in counteracting IL-1β-mediated increase of proteins related to extracellular matrix (ECM) remodeling, catabolism and inflammation. Graphics show the quantitative modulation caused by CS on this group of proteins (ratio IL+CS/IL, light-gray bars) detected in the present study, and compare these changes with those attributable to IL-1β treatment (ratio IL/BASAL, dark-gray bars) that were found previously [12]. Protein abbreviations are defined in Table 2.
Putative mediators of CS anti-inflammatory and anti-catabolic effects
We also performed a database search, using STRING software, to visualize protein interactions on the set of CS-modulated proteins and further elucidate its effect on chondrocytes (Figure 3). The role of CS in counteracting the IL-1β-mediated increase of some proteins was also detected for three degradative enzymes and three members of the complement pathway (Figure 2 and Table 2). Recently, a central role for the inflammatory complement system in the pathogenesis of OA has been identified [29]. Expression and activation of complement is abnormally high in human osteoarthritic joints. We show in this study how CS could reduce inflammation directly by decreasing the presence of several complement components (CFAB, CLUS, CO3, C1S and C1R), and also indirectly by increasing proteins such as TSG6. This protein plays a crucial role in ECM formation, inflammatory cell migration and cell proliferation. TSG6 is also a key component of a negative feedback loop operating through the protease network that reduces matrix degradation during the OA process [30]. The mechanism driven by TSG6 leads to a decrease in pro-matrix metalloproteinase activation, which might protect cartilage from extensive degradation even in the presence of acute inflammation (represented in our case by a high level of IL-1β). Western blot analyses were performed to confirm the detected increase of TSG6 caused by CS treatment. As shown in Figure 4, CS increased the amount of TSG6 secreted by chondrocytes, and this increase correlates with a decline in MMP1 and MMP3 levels. These results point to the increase of TSG6 as a putative mediator of the reduction in pro-matrix metalloproteinase activation, suggesting an important role of this mechanism for the anti-catabolic effect of CS.
Figure 3.
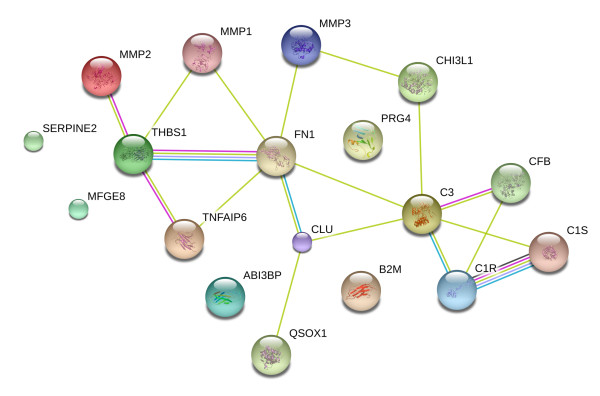
Protein-protein interaction network of chondroitin sulfate effects. The STRING database was searched for protein interaction analyses in order to elucidate the effect of chondroitin sulfate on cartilage extracellular matrix (ECM) proteins. As shown, most of the altered proteins interact with each other to constitute a large network. These proteins are involved in several processes, but essentially belong to immune response, inflammation and ECM remodeling pathways.
Figure 4.
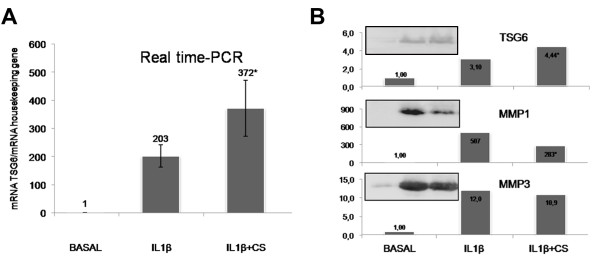
Chondroitin sulfate-dependent increase of TNFα-induced protein and correlation with the decrease in matrix metalloproteinase activation. The chondroitin sulfate (CS)-dependent increase of TNFα-induced protein (TSG6 or TNFAIP6), and its correlation with the decrease in matrix metalloproteinase activation. Overexpression values of TSG6 were determined by (A) real-time PCR and (B) western blot analysis of IL-1β-stimulated human articular chondrocyte secretomes as described in Materials and methods. The CS-mediated decrease of MMP1 and MMP3 activation was confirmed by western blot analysis (B). Each condition was tested in duplicate. Results are expressed as the mean ± standard error of the mean of three independent experiments. Representative images of the western blot assays are shown. *P < 0.05, CS-treated group was significantly different from IL-1β-stimulated group.
Modulation of thrombospondin-1 by CS
A remarkable increase of TSP1, an angiogenesis inhibitor, was detected as a consequence of the CS treatment and counteracting the effect of IL-1β. This result is consistent with our previously observed increase of TSP1 protein driven by CS in the absence of IL-1β stimulation, although in osteoarthritic chondrocytes [28]. TSP1 overexpression reduces inflammation and neovascularization in the OA joint [31]. In our previous study on IL-1β-stimulated chondrocytes, TSP1 presented a ratio of zero [12], indicating a cytokine-dependent dramatic decrease of its release from these cells. IL-1β is a well-recognized angiogenic factor, so the possibility that an increased concentration of IL-1β in OA synovial fluid may reduce the TSP1 expression in severe stages of OA cannot be excluded. The selective inhibition of angiogenesis - also confirmed by the decrease of lactadherin, a protein that promotes vascular endothelial growth factor-dependent neovascularization [32] - demonstrates a novel mechanism of action of CS according to recent results obtained in synoviocytes [33].
The data obtained in the SILAC analysis need to be validated for differences in protein expression profiles before the biological roles of the modulated proteins are extensively studied. We therefore performed additional studies in order to verify the altered abundance of TSP1 in CS-treated chondrocytes. Interestingly, TSP1 is a multifunctional adhesive glycoprotein present in articular cartilage and synthesized by articular chondrocytes [34], whose gene transfer suppresses the disease progression of experimental OA [31]. The inhibitory effect of TSP-1 on angiogenesis has been largely described [35]. Owing to the pivotal role of angiogenesis in OA physiopathology [36], we decided to verify TSP1 gene expression level in CS-treated chondrocytes stimulated with IL-1β by real time-PCR analysis, and also in cells without cytokine stimulation. As shown in Figure 5A, CS upregulates TSP1 already in the absence of IL-1β. When the cytokine is present, CS is capable of counteracting its suppressive effect on TSP1 in chondrocytes. Furthermore, TSP1 protein levels were also evaluated in chondrocyte conditioned media (secretome) and cellular extracts (proteome) by western blot analyses and in cartilage explant culture by immunohistochemistry (Figure 5). The increase of TSP1 protein observed both in cell and tissue cultures following CS treatment suggests the possible mechanism through which this drug could exert an anti-angiogenic action.
Figure 5.

Thrombospondin-1 (TSP1 or THBS1) is increased by chondroitin sulfate. Overexpression values of thrombospondin-1(TSP1) were determined by (A) real-time PCR and (B) western blot (WB) analysis of both IL-1β-stimulated and unstimulated human articular chondrocytes, and by (C) immunohistochemical analysis of cartilage shavings as described in Materials and methods. Each condition was tested in duplicate. Results are expressed as the mean ± standard error of the mean of three independent experiments. Representative images of western blot and immunohistochemical assays are shown. *P < 0.05, CS-treated group was significantly different from IL-1β-stimulated group. CS, chondroitin sulfate; CTL, control.
Conclusion
Our work provides a comprehensive quantitative analysis of the effects of CS in IL-1β-stimulated chondrocyte secretome, as well as novel molecular evidence for its anti-angiogenic, anti-inflammatory, and anti-catabolic properties. Proteins modulated by this drug are potential new targets for OA treatment (for example, TSP1). These findings might provide a rationale for targeting angiogenesis as a disease-modifying therapy for OA.
Abbreviations
CS: chondroitin sulfate; Ct: threshold cycle; DMEM: Dulbecco's modified Eagle's medium; ECM: extracellular matrix; GS: glucosamine sulfate; HAC: human articular chondrocyte; IL: interleukin; LC: liquid chromatography; mAb: monoclonal antibody; MALDI: matrix-assisted laser desorption/ionization; MS: mass spectrometry; OA: osteoarthritis; PCR: polymerase chain reaction; SILAC: stable isotope labeling with amino acids in cell culture; TOF: time of flight; TFA: Trifluoroacetic acid; TNF: tumor necrosis factor; TSG6: TNFα-induced protein; TSP1: thrombospondin-1.
Competing interests
The authors declare that they have no competing interests.
Authors' contributions
VC carried out the experimental work, analyzed the data and drafted the manuscript. LL and BR helped to collect and process protein samples, participated in western blot experiments and helped with statistical data analysis. PF-P and JM carried out the MS analysis and database search. EM and JV provided CS and helped with the study design. CR-R participated in the study design, interpretation of the data and manuscript preparation. FJB conceived and coordinated the project and revised the manuscript. All authors read and approved the final manuscript.
Contributor Information
Valentina Calamia, Email: valentina.calamia@sergas.es.
Lucía Lourido, Email: lucia.m.lourido.salas@sergas.es.
Patricia Fernández-Puente, Email: patricia.fernandez.puente@sergas.es.
Jesús Mateos, Email: jesus.mateos.martin@sergas.es.
Beatriz Rocha, Email: beatriz.rocha.loureda@sergas.es.
Eulalia Montell, Email: lmontell@bioiberica.com.
Josep Vergés, Email: jverges@bioiberica.com.
Cristina Ruiz-Romero, Email: cristina.ruiz.romero@sergas.es.
Francisco J Blanco, Email: fblagar@sergas.es.
Acknowledgements
The authors express appreciation to the Pathology Service from the Orthopaedics Department of CHU A Coruña for providing cartilage samples, and to Purificación Filgueira and Noa Goyanes for their help in the histochemistry assays. This study was supported by grants from Fondo Investigación Sanitaria - Spain (CIBER-CB06/01/0040, PI08/2028, PI11/02397), Ministerio de Ciencia e Innovacion PLE2009-0144 and Secretaría I+D+I Xunta de Galicia (10CSA916058PR). BR (FI10/866), JM (CA11/00050) and PF-P (CA09/00458) are supported by Fondo Investigación Sanitaria - Spain. CR-R is supported by the Miguel Servet program from Fondo Investigación Sanitaria-Spain (CP09/00114).
References
- Martel-Pelletier J, Lajeunesse D, Pelletier J. In: Arthritis & Allied Conditions. A Textbook of Rheumatology. 15. Koopman WJ, Moreland LW, editor. Baltimore, MD: Lippincott, Williams & Wilkins; 2005. Etiopathogenesis of osteoarthritis; pp. 2199–2226. [Google Scholar]
- Alcaraz MJ, Megías J, García-Arnandis I, Clérigues V, Guillén MI. New molecular targets for the treatment of osteoarthritis. Biochem Pharmacol. 2010;80:13–21. doi: 10.1016/j.bcp.2010.02.017. [DOI] [PubMed] [Google Scholar]
- Imada K, Oka H, Kawasaki D, Miura N, Sato T, Ito A. Anti-arthritic action mechanisms of natural chondroitin sulfate in human articular chondrocytes and synovial fibroblasts. Biol Pharm Bull. 2010;33:410–414. doi: 10.1248/bpb.33.410. [DOI] [PubMed] [Google Scholar]
- Monfort J, Pelletier JP, Garcia-Giralt N, Martel-Pelletier J. Biochemical basis of the effect of chondroitin sulphate on osteoarthritis articular tissues. Ann Rheum Dis. 2008;67:735–740. doi: 10.1136/ard.2006.068882. [DOI] [PubMed] [Google Scholar]
- Kahan A, Uebelhart D, De Vathaire F, Delmas PD, Reginster JY. Long-term effects of chondroitins 4 and 6 sulfate on knee osteoarthritis: the study on osteoarthritis progression prevention, a two-year, randomized, double-blind, placebo-controlled trial. Arthritis Rheum. 2009;60:524–533. doi: 10.1002/art.24255. [DOI] [PubMed] [Google Scholar]
- Sawitzke AD, Shi H, Finco MF, Dunlop DD, Harris CL, Singer NG, Bradley JD, Silver D, Jackson CG, Lane NE, Oddis CV, Wolfe F, Lisse J, Furst DE, Bingham CO, Reda DJ, Moskowitz RW, Williams HJ, Clegg DO. Clinical efficacy and safety of glucosamine, chondroitin sulphate, their combination, celecoxib or placebo taken to treat osteoarthritis of the knee: 2-year results from GAIT. Ann Rheum Dis. 2010;69:1459–1464. doi: 10.1136/ard.2009.120469. [DOI] [PMC free article] [PubMed] [Google Scholar]
- McAlindon TE, LaValley MP, Gulin JP, Felson DT. Glucosamine and chondroitin for treatment of osteoarthritis: a systematic quality assessment and meta-analysis. JAMA. 2000;283:1469–1475. doi: 10.1001/jama.283.11.1469. [DOI] [PubMed] [Google Scholar]
- Clegg DO, Reda DJ, Harris CL, Klein MA, O'Dell JR, Hooper MM, Bradley JD, Bingham CO, Weisman MH, Jackson CG, Lane NE, Cush JJ, Moreland LW, Schumacher HR Jr, Oddis CV, Wolfe F, Molitor JA, Yocum DE, Schnitzer TJ, Furst DE, Sawitzke AD, Shi H, Brandt KD, Moskowitz RW, Williams HJ. Glucosamine, chondroitin sulfate, and the two in combination for painful knee osteoarthritis. N Engl J Med. 2006;354:795–808. doi: 10.1056/NEJMoa052771. [DOI] [PubMed] [Google Scholar]
- Calamia V, Ruiz-Romero C, Rocha B, Fernandez-Puente P, Mateos J, Montell E, Verges J, Blanco FJ. Pharmacoproteomic study of the effects of chondroitin and glucosamine sulfate on human articular chondrocytes. Arthritis Res Ther. 2010;12:R138. doi: 10.1186/ar3077. [DOI] [PMC free article] [PubMed] [Google Scholar]
- Fernandes JC, Martel-Pelletier J, Pelletier JP. The role of cytokines in osteoarthritis pathophysiology. Biorheology. 2002;39:237–246. [PubMed] [Google Scholar]
- Piersma SR, Fiedler U, Span S, Lingnau A, Pham TV, Hoffmann S, Kubbutat MH, Jimenez CR. Workflow comparison for label-free, quantitative secretome proteomics for cancer biomarker discovery: method evaluation, differential analysis, and verification in serum. J Proteome Res. 2010;9:1913–1922. doi: 10.1021/pr901072h. [DOI] [PubMed] [Google Scholar]
- Calamia V, Rocha B, Mateos J, Fernández-Puente P, Ruiz-Romero C, Blanco FJ. Metabolic labeling of chondrocytes for the quantitative analysis of the interleukin-1-beta-mediated modulation of their intracellular and extracellular proteomes. J Proteome Res. 2011;10:3701–3711. doi: 10.1021/pr200331k. [DOI] [PubMed] [Google Scholar]
- Ruiz-Romero C, López-Armada MJ, Blanco FJ. Proteomic characterization of human normal articular chondrocytes: a novel tool for the study of osteoarthritis and other rheumatic diseases. Proteomics. 2005;5:3048–3059. doi: 10.1002/pmic.200402106. [DOI] [PubMed] [Google Scholar]
- Tat SK, Pelletier JP, Mineau F, Duval N, Martel-Pelletier J. Variable effects of 3 different chondroitin sulfate compounds on human osteoarthritic cartilage/chondrocytes: relevance of purity and production process. J Rheumatol. 2010;37:656–664. doi: 10.3899/jrheum.090696. [DOI] [PubMed] [Google Scholar]
- Roche Applied Science. http://www.roche-applied-science.com
- Livak KJ, Schmittgen TD. Analysis of relative gene expression data using real-time quantitative PCR and the 2(-Delta Delta C(T)) method. Methods. 2001;25:402–408. doi: 10.1006/meth.2001.1262. [DOI] [PubMed] [Google Scholar]
- Dudhia J. Aggrecan, aging and assembly in articular cartilage. Cell Mol Life Sci. 2005;62:2241–2256. doi: 10.1007/s00018-005-5217-x. [DOI] [PMC free article] [PubMed] [Google Scholar]
- Martel-Pelletier J, Kwan Tat S, Pelletier JP. Effects of chondroitin sulfate in the pathophysiology of the osteoarthritic joint: a narrative review. Osteoarthritis Cartilage. 2010;18:S7–S11. doi: 10.1016/j.joca.2010.01.015. [DOI] [PubMed] [Google Scholar]
- Polacek M, Bruun JA, Johansen O, Martinez I. Differences in the secretome of cartilage explants and cultured chondrocytes unveiled by SILAC technology. J Orthop Res. 2010;28:1040–1049. doi: 10.1002/jor.21067. [DOI] [PubMed] [Google Scholar]
- Clutterbuck AL, Smith JR, Allaway D, Harris P, Liddell S, Mobasheri A. High throughput proteomic analysis of the secretome in an explant model of articular cartilage inflammation. J Proteomics. 2011;74:704–715. doi: 10.1016/j.jprot.2011.02.017. [DOI] [PMC free article] [PubMed] [Google Scholar]
- Kapoor M, Martel-Pelletier J, Lajeunesse D, Pelletier JP, Fahmi H. Role of proinflammatory cytokines in the pathophysiology of osteoarthritis. Nat Rev Rheumatol. 2011;7:33–42. doi: 10.1038/nrrheum.2010.196. [DOI] [PubMed] [Google Scholar]
- Fernández-Puente P, Mateos J, Fernández-Costa C, Oreiro N, Fernández-López C, Ruiz-Romero C, Blanco FJ. Identification of a panel of novel serum osteoarthritis biomarkers. J Proteome Res. 2011;10:5095–5101. doi: 10.1021/pr200695p. [DOI] [PubMed] [Google Scholar]
- Mateos J, Lourido L, Fernández-Puente P, Calamia V, Fernández-López C, Oreiro N, Ruiz-Romero C, Blanco FJ. Differential protein profiling of synovial fluid from rheumatoid arthritis and osteoarthritis patients using LC-MALDI TOF/TOF. J Proteomics. 2012;75:2869–2878. doi: 10.1016/j.jprot.2011.12.042. [DOI] [PubMed] [Google Scholar]
- Ong SE, Mann M. A practical recipe for stable isotope labeling by amino acids in cell culture (SILAC) Nat Protoc. 2006;1:2650–2660. doi: 10.1038/nprot.2006.427. [DOI] [PubMed] [Google Scholar]
- Zivanović S, Rackov LP, Vojvodić D, Vucetić D. Human cartilage glycoprotein 39 - biomarker of joint damage in knee osteoarthritis. Int Orthop. 2009;33:1165–1170. doi: 10.1007/s00264-009-0747-8. [DOI] [PMC free article] [PubMed] [Google Scholar]
- Homandberg GA, Wen C, Hui F. Cartilage damaging activities of fibronectin fragments derived from cartilage and synovial fluid. Osteoarthritis Cartilage. 1998;6:231–244. doi: 10.1053/joca.1998.0116. [DOI] [PubMed] [Google Scholar]
- Zack MD, Arner EC, Anglin CP, Alston JT, Malfait AM, Tortorella MD. Identification of fibronectin neoepitopes present in human osteoarthritic cartilage. Arthritis Rheum. 2006;54:2912–2922. doi: 10.1002/art.22045. [DOI] [PubMed] [Google Scholar]
- Calamia V, Fernandez-Puente P, Mateos J, Lourido L, Rocha B, Montell E, Verges J, Ruiz-Romero C, Blanco FJ. Pharmacoproteomic study of three different chondroitin sulfate compounds on intracellular and extracellular human chondrocyte proteomes. Mol Cell Proteomics. 2012;11:M111.013417. doi: 10.1074/mcp.M111.013417. [DOI] [PMC free article] [PubMed] [Google Scholar]
- Wang Q, Rozelle AL, Lepus CM, Scanzello CR, Song JJ, Larsen DM, Crish JF, Bebek G, Ritter SY, Lindstrom TM, Hwang I, Wong HH, Punzi L, Encarnacion A, Shamloo M, Goodman SB, Wyss-Coray T, Goldring SR, Banda NK, Thurman JM, Gobezie R, Crow MK, Holers VM, Lee DM, Robinson WH. Identification of a central role for complement in osteoarthritis. Nat Med. 2011;17:1674–1679. doi: 10.1038/nm.2543. [DOI] [PMC free article] [PubMed] [Google Scholar]
- Wisniewski HG, Hua JC, Poppers DM, Naime D, Vilcek J, Cronstein BN. TNF/IL-1-inducible protein TSG-6 potentiates plasmin inhibition by inter-alpha-inhibitor and exerts a strong anti-inflammatory effect in vivo. J Immunol. 1996;156:1609–1615. [PubMed] [Google Scholar]
- Hsieh JL, Shen PC, Shiau AL, Jou IM, Lee CH, Wang CR, Teo ML, Wu CL. Intraarticular gene transfer of thrombospondin-1 suppresses the disease progression of experimental osteoarthritis. J Orthop Res. 2010;28:1300–1306. doi: 10.1002/jor.21134. [DOI] [PubMed] [Google Scholar]
- Silvestre JS, Théry C, Hamard G, Boddaert J, Aguilar B, Delcayre A, Houbron C, Tamarat R, Blanc-Brude O, Heeneman S, Clergue M, Duriez M, Merval R, Lévy B, Tedgui A, Amigorena S, Mallat Z. Lactadherin promotes VEGF-dependent neovascularization. Nat Med. 2005;11:499–506. doi: 10.1038/nm1233. [DOI] [PubMed] [Google Scholar]
- Lambert C, Mathy-Hartert M, Dubuc JE, Montell E, Vergés J, Munaut C, Noël A, Henrotin Y. Characterization of synovial angiogenesis in osteoarthritis patients and its modulation by chondroitin sulfate. Arthritis Res Ther. 2012;14:R58. doi: 10.1186/ar3771. [DOI] [PMC free article] [PubMed] [Google Scholar]
- Miller RR, McDevitt CA. Thrombospondin is present in articular cartilage and is synthesized by articular chondrocytes. Biochem Biophys Res Commun. 1988;153:708–714. doi: 10.1016/S0006-291X(88)81152-5. [DOI] [PubMed] [Google Scholar]
- Bornstein P. Thrombospondins function as regulators of angiogenesis. J Cell Commun Signal. 2009;3:189–200. doi: 10.1007/s12079-009-0060-8. [DOI] [PMC free article] [PubMed] [Google Scholar]
- Haywood L, McWilliams DF, Pearson CI, Gill SE, Ganesan A, Wilson D, Walsh DA. Inflammation and angiogenesis in osteoarthritis. Arthritis Rheum. 2003;48:2173–2177. doi: 10.1002/art.11094. [DOI] [PubMed] [Google Scholar]