

Abstract
The prolactin releasing peptide (PrRP) is involved in regulating food intake and body weight homeostasis, but molecular details on the activation of the PrRP receptor remain unclear. C-terminal segments of PrRP with 20 (PrRP20) and 13 (PrRP8-20) amino acids, respectively, have been suggested to be fully active. The data presented herein indicate this is true for the wildtype receptor only; a 5-10-fold loss of activity was found for PrRP8-20 compared to PrRP20 at two extracellular loop mutants of the receptor. To gain insight into the secondary structure of PrRP, we used CD spectroscopy performed in TFE and SDS. Additionally, previously reported NMR data, combined with ROSETTANMR, were employed to determine the structure of amidated PrRP20. The structural ensemble agrees with the spectroscopic data for the full-length peptide, which exists in an equilibrium between α- and 310-helix. We demonstrate that PrRP8-20’s reduced propensity to form an α-helix correlates with its reduced biological activity on mutant receptors. Further, distinct amino acid replacements in PrRP significantly decrease affinity and activity but have no influence on the secondary structure of the peptide. We conclude that formation of a primarily α-helical C-terminal region of PrRP is critical for receptor activation.
Keywords: PrRP, PrRP receptor, RF-amide peptide, NMR, chemical shifts, NOE, Rosetta, RosettaNMR, protein folding, GPCR, peptide receptor, structure/activity
Introduction
The prolactin releasing peptide, or PrRP, is a member of the RF-amide peptide family and is mainly expressed in the medulla oblongata, brainstem, and hypothalamus.1–3 It is the endogenous agonist of the PrRP receptor (also known as GPR10 or hGR3) and interacts with nanomolar binding affinities.4 Furthermore, it has some affinity for other RF-amide and FF-amide receptors, such as the hNPFF2 receptor.5 These receptors are integral membrane proteins that belong to the large family of G-protein coupled receptors, or GPCRs, which constitute about one-third of all major drug targets.6 While the original function of PrRP was proposed to be the stimulation of prolactin secretion,4,7 it is now generally accepted that this is not the primary function of the peptide. Increasing evidence indicates that PrRP plays a significant role in food intake and body weight homeostasis.8 Indeed, intracerebroventricular administration of PrRP with leptin in rats resulted in body weight gain.9 In addition, both PrRP- and PrRP receptor-deficient mice were shown to develop late-onset obesity.10
PrRP exists in two isoforms: PrRP20 and PrRP31, which consist of 20 and 31 residues, respectively. The C-terminal residues of both isoforms are identical, and both isoforms are biologically equipotent in the activation of the PrRP receptor. It has been demonstrated that PrRP can be shortened to PrRP8-20 without any loss of activity at the wildtype (wt) receptor and that these thirteen C-terminal residues are the minimum number of amino acids essential for full activation of the PrRP receptor.11
Little is known about the mode of binding and activation of the PrRP receptor by PrRP, especially on a structural level. This is likely due to the lack of functional antagonists of the PrRP receptor and difficulties in structure determination of GPCRs. Here, we investigate the importance of the peptide’s secondary structure for receptor activation. Nuclear magnetic resonance (NMR) spectroscopy had previously been used to determine the structure of PrRP20 in micelles.12 A second study reported an image of a PrRP20 structural model without revealing experimental details, such as solvent conditions or a list of NMR restraints.13 Neither study made the models publicly available. However, D’Ursi et al. provided a list of sparse chemical shifts and nuclear Overhauser effect distance restraints (NOEs).12 We employed RosettaNMR14–16 to generate an ensemble of peptide conformations that is consistent with newly obtained circular dichroism (CD) spectroscopy data and this set of NMR restraints. Further, we identified receptor mutants for which PrRP8-20 displays a significant loss in activation compared to PrRP20. By comparing the activation ability of four PrRP analogs on two receptor mutants, we can distinguish direct effects on ligand-receptor interaction and indirect effects that result from alteration of peptide helicity. This combined computational-experimental approach allows us to understand the interaction of PrRP and its receptor on a molecular level.
Results
Previous NMR studies of C-terminally amidated PrRP20 reveal a helical C-terminal region
RosettaNMR14–16 was employed to construct a model of C-terminally amidated PrRP from 38 previously reported inter-proton distances (NOEs) and 13 Hα chemical shifts, which were collected at pH 5.5 in 100 mM sodium dodecyl sulfate, or SDS (Tables S1 and S2).12 These NMR data were obtained for PrRP20. We chose to construct structural models for residues 8–20 of PrRP20 because the structural restraints cover mainly these residues, implying that residues 1–7 are conformationally flexible. However, because only a partial dataset was available, the herein discussed peptide model ensemble serves only as a starting point for further structural characterization of the PrRP/PrRP receptor interaction. The generated models were further confirmed with CD spectroscopy (see Structural investigations of PrRP by CD spectroscopy studies indicate a decreased helical propensity for PrRP8-20).
The NOEs and chemical shifts occurring within residues 8–20 are indicative of a combination of α- and 310-helical secondary structure. The presence of αN(i,i+2) NOEs is often associated with i(i+3) hydrogen bonding characteristic of 310-helices. Further, the ratio of αβ(I,i+3) to αN(i,i+3) NOEs, as well as the lack of αN(i,i+4) NOEs, support the idea that the peptide exists in an equilibrium of α- and 310-helix in SDS micelles17–19 (see D’Ursi et al. for original figures12). An ensemble of twenty low-energy models of the PrRP20 residues 8–20 consistent with the NMR data obtained for the full-length peptide was generated and deposited in the Protein Model Database20 (Figure 1, Supplemental Information, PM ID: 0078404).
Figure 1.

The Conformational Ensemble of PrRP8-20 Generated Using RosettaNMR. A) The primary sequence of PrRP8-20. The three arginines are in bold. B) The twenty lowest-energy models resulting from full-atom refinement that had a RosettaNMR restraint score ≤ 1.0 Rosetta Energy Unit (REU). Briefly, ten thousand models were de novo folded in the presence of 38 distance restraints. Energetically favorable models that satisfied the NMR data were then refined to atomic detail using the same 38 restraints. Notice that all three arginine residues are on one side of the amphipathic helix.
Secondary structural analysis of PrRP20 models implies a conformational equilibrium
The final ensemble of PrRP models was chosen based on the models’ overall energy according to the RosettaNMR full-atom soluble protein scoring function,21 as well as their agreement with the NMR distance restraints for the full-length peptide (Tables S3 and S4).12 Define Secondary Structure of Proteins (DSSP)22,23 analysis indicates that these models are mainly α-helical, especially between residues 10–13 and 15–19, with the other residues being coil or bend/turn (Figure 2A). Note the often-observed non-ideal helical character around residue I14. This is likely due to the inability of the nitrogen of P16 to hydrogen bond with the carbonyl oxygen on R12 (distance = 4.98 ± 0.27Å), thus disrupting the hydrogen bond between G13 and V17 (distance = 5.00 ± 0.26Å) (Figure 2B). The models exhibit ϕ and ψ angles (torsion angles around the N-Cα bond and the Cα-C bond, respectively) characteristic of both α- and 310-helix, where α-helices have an average ϕ angle of −57° and an average ψ angle of −70°. 310-helicies typically have average ϕ angles of approximately −49° and average ψ angles of −26° (Figure 2C).24–26 Interestingly, residues 10–13 appear to usually form an α-helical turn, but they can also adopt a 310-helical structure (Table S5, Models 10 and 11). Furthermore, the DSSP secondary structure analysis reveals that approximately 15% of all models de novo folded and refined with RosettaNMR contained both α- and 310-helical conformation, but the majority of models were primarily α-helical (Figure S1). These results match D’Ursi et al.’s NOE data, which support an unambiguously α-helical C-terminal region (residues 15–19), whereas the N-terminus of PrRP20 appeared to be in a conformational equilibrium, fluctuating between α-helix, 310-helix, and nascent helix or coil. It is noteworthy that the new ensemble agrees well with D’Ursi et al. considering the sparseness of the available data, which recapitulates RosettaNMR’s sampling efficiency.
Figure 2.

Evidence of Helical Secondary Structure in the PrRP Ensemble of Models. A) WebLogo (http://weblogo.berkeley.edu/) summarizing the consensus secondary structure information obtained by DSSP; C=coil, T=turn, H=α-helix. B) Close-up view of backbone interactions between residues 12–18. Oxygens are colored in red, nitrogens in blue, and hydrogens in white. C) Ramachandran plot of ϕ/ψ angles of the models as computed by DSSP; gray=angles obtained for all models generated; black=angles for final ensemble.
Structural investigations of PrRP by CD spectroscopy indicate a decreased helical propensity for PrRP8-20
To elucidate the structural and functional requirements for PrRP20 binding and receptor activation, a set of PrRP analogs was synthesized and characterized (Table 1). Because the C-terminal region of the peptide is presumably responsible for receptor binding and activation,1,4,11,13 we focused primarily on N-terminal truncation of PrRP20 to PrRP4-20, PrRP8-20, and the shortest reported full agonist, PrRP14-20.1 CD spectra of PrRP20 and PrRP4-20 recorded in aqueous phosphate buffered solution at pH 7.0 and 22°C show significantly more intense signal between 200–230 nm in comparison to PrRP14-20, which is expected to be flexible and mostly disordered. Further, the CD spectrum of PrRP8-20 in phosphate buffer also suggests a primarily disordered peptide; the slight maximum at approximately 228 nm suggests the presence of some poly-proline II helix conformation as well27,28 (Figure 3A, left panel). Interestingly, according to the spectra of PrRP20 and PrRP4-20, the peptides may contain some ordered secondary structural character, including 310-helix (Table 2); note the deep minima at ~205 nm and the shoulder at ~222 nm. This is also supported by the peptides’ R222/208 values of 0.46 ± 0.01 and 0.37 ± 0.02, respectively. According to Toniolo et al., this ratio is expected to be between 0.15 and 0.40 for 310-helical peptides and ~1.0 for α-helical peptides.29,30
Table 1.
Analytics of PrRP20 Analogs used for Structural and Biological Investigations
| Peptide | Sequence | Mass [M+H]+ | HPLC | |||
|---|---|---|---|---|---|---|
| Calc. | Exp. | ACN [%] |
MeOH [%] |
Purity [%] | ||
| PrRP20 | TPDINPAWYASRGIRPVGRF-NH2 | 2272.6 | 2273.7 | 40.3a | 65.5b | >99 |
| PrRP4-20 | INPAWYASRGIRPVGRF-NH2 | 1959.3 | 1960.4 | 40.5a | 66.9b | >99 |
| PrRP8-20 | WYASRGIRPVGRF-NH2 | 1562.9 | 1563.9 | 38.3a | 61.6b | >92 |
| PrRP14-20 | IRPVGRF-NH2 | 842.5 | 843.5 | 33.8a | 52.6b | >96 |
| A 15PrRP20 | TPDINPAWYASRGIAPVGRF-NH2 | 2186.1 | 2187.2 | 42.9a | 71.7b | >96 |
| A19PrRP20 | TPDINPAWYASRGIRPVGAF-NH2 | 2187.5 | 2188.4 | 41.6a | 70.8c | >99 |
| A20PrRP20 | TPDINPAWYASRGIRPVGRA-NH2 | 2196.5 | 2196.2 | 37.7a | 61.6b | >99 |
10% to 60% ACN (0.08% TFA) in water (0.1% TFA) over 30 min.
20% to 100% MeOH (0.08% TFA) in water (0.1% TFA) over 40 min.
30% to 100% MeOH (0.08% TFA) in water (0.1% TFA) over 30 min.
Figure 3.

Influence of Different Solvents on the Structure of Wildtype and Mutant PrRP. Left panel: Truncation mutants of PrRP20 (PrRP4-20, PrRP8-20, and PrRP14-20). Right panel: Single-mutant PrRP20 analogs (A15PrRP20, A19PrRP20, and A20PrRP20). CD spectra are represented in mean residue ellipticity, measured in 40 µM peptide in 10 mM phosphate buffered solution at pH 7 and 22°C. (A) CD spectra measured without additives, (B) in 100 mM micellar SDS solution, and (C) 25% TFE-containing solution. All curves were calculated with the baseline corrected for buffer effects.
Table 2.
Characterization of CD Data
| Peptide | Condition | Ratio [R] ± SD |
|---|---|---|
| pH 7, 10 mM pb | ||
| PrRP20 | aqueous | 0.46 ± 0.01 |
| PrRP4-20 | aqueous | 0.37 ± 0.02 |
| PrRP8-20 | aqueous | NC |
| PrRP14-20 | aqueous | NC |
| PrRP20 | 100 mM SDS | 0.54 ± 0.01 |
| PrRP4-20 | 100 mM SDS | 0.63 ± 0.01 |
| PrRP8-20 | 100 mM SDS | NC |
| PrRP14-20 | 100 mM SDS | 0.40 ± 0.05 |
| PrRP20 | 25% TFE | 0.68 ± 0.01 |
| PrRP4-20 | 25% TFE | 0.65 ± 0.01 |
| PrRP8-20 | 25% TFE | 0.45 ± 0.08 |
| PrRP14-20 | 25% TFE | 0.54 ± 0.03 |
pb = phosphate buffered; SD = standard deviation; NC = not considered for reasons of missing characteristic helical CD spectra.
Next, we investigated the peptide in solvents mimicking the partially apolar membrane environment while retaining a certain biocompatibility. We will label the three experimental conditions as “aqueous,” “SDS,” and “TFE” throughout the remainder of the manuscript. For PrRP20 tested in 100 mM SDS solution, a well-known membrane mimicking detergent, we observe a maximum at 195 nm, a minimum at 205 nm, and a shoulder around 222 nm (Figure 3B, left panel); the latter two spectral features are indicative of a 310-helical component to the conformational ensemble. The characteristic minima for solely α-helically structured peptides are at 208 nm and 222 nm.31 However, the R222/208 value of 0.54 ± 0.01 is higher than expected for a pure 310-helix. We therefore conclude that, in SDS, PrRP20 adopts a partially α-helical conformation, with 310-helix and other secondary structural components also being present. Similar observations were observed for PrRP4-20 (R222/208 = 0.63 ± 0.01). The CD spectra of PrRP14-20 has 310-helix character, (R222/208 = 0.40 ± 0.05), whereas PrRP8-20 appears to remain primarily coil/poly-proline II helix under these conditions (Figure 3B, left panel; Table 2).
Fluorinated alcohols, such as trifluoroethethanol, or TFE, are organic solvents that induce environmental constrains; TFE/water mixtures exhibit helix-inducing biocompatible conditions. For CD spectroscopy of PrRP20 and PrRP4-20 measured in TFE/water, R222/208 values of 0.68 ± 0.01 and 0.65 ± 0.01, respectively, were calculated. These values support the assumption that the peptides are primarily α-helical (Table 2). Indeed, in TFE/water, the helical content of the full-length peptide increased, with the spectrum exhibiting deep minima at 208 nm and 222 nm. These minima are more pronounced than those seen in the CD spectra obtained in SDS micelles. In contrast, the spectra of PrRP8-20 and PrRP14-20 in TFE are more reminiscent of that of a mixture of helices with a strong 310-helix component. Both peptides exhibit a minimum at approximately 202 nm and a shoulder at about 220 nm (Figure 3C, left panel). Further, the R222/208 values for these peptides were 0.45 ± 0.08 and 0.54 ± 0.03, respectively (Table 2). The experiments in TFE were repeated at various pH-values and temperatures of 25°, 37°, and 50° for both PrRP20 and PrRP8-20 in order to confirm that the spectra were largely independent of these parameters (Figure 4).
Figure 4.

Structural Effects of pH and Temperature. CD spectra were recorded from 190–250 nm with 40 µM PrRP8-20 and PrRP20 in 10 mM phosphate buffered solution (Materials and Methods), and mean residue ellipticity was calculated. (A) Measurement performed at pH 7 and 5.5. (B) PrRP20 was tested at different temperatures and showed no change.
Single-substituted PrRP20 analogs do not exhibit different secondary structure from wt PrRP20
Single alanine mutants of PrRP20 at R15, R19, and F20 positions have been previously implicated with peptide activity1,11,13 and were also tested here. Note that the highly conserved C-terminal residues, R19 and F20, make PrRP a member of the RF-amide peptide family. To study the influence of the conserved RF-amide motif and the impact of charged amino acids at the hydrophilic side of the helix on the overall peptide structure, we performed CD spectroscopy on A15PrRP20, A19PrRP20, and A20PrRP20 compared to wt PrRP20 (Figure 3, right panel; Table 2). Interestingly, all tested conditions (aqueous, SDS, TFE) resulted in almost identical CD spectra for PrRP20 and all alanine mutants. Although CD spectroscopy is not sensitive to identify small, local rearrangements in the peptide, we conclude that the modified single side chains at positions 15, 19, and 20 have no impact on the overall secondary structure of the peptide. Therefore, any loss of activity when interacting with the receptor results from a change in the interaction with the receptor rather than a change in structure or dynamics of the peptide (see Binding to and activation of the wt PrRP receptor is primarily mediated by direct interactions with PrRP).
Binding to and activation of the wt PrRP receptor is primarily mediated by direct interactions with PrRP
To evaluate the biological relevance of the PrRP20 analogs, binding and signal transduction capabilities were investigated in COS-7 cells transiently transfected with the PrRP receptor. In a displacement assay with the wt PrRP receptor using 1 nM N[propionyl3H]hPrRP20, an IC50-value of 4.1 ± 0.7 nM was obtained, where IC50 is the inhibition concentration of the ligand at half maximum biological activity of the receptor. A dissociation constant, or KD, value of 0.58 nM was computed using established methods.32 The activity of PrRP20 was determined using an IP, or inositol phosphate, accumulation assay (see Materials and Methods) and resulted in an EC50-value of 2.2 ± 0.3 nM (Table 3). The EC50 is the effective concentration of the ligand at half maximum biological activity.
Table 3.
Effects of Mutation of PrRP on Binding and Signaling
| Peptide | Binding Assay | Signal Transduction Assay |
||
|---|---|---|---|---|
| IC50 [nM]a | x-foldb | EC50 [nM]c | x-foldd | |
| PrRP20 | 4.1 ± 0.7 | 1 | 2.2 ± 0.3 | 1 |
| PrRP4-20 | 1.2 ± 0.1 | 0.3 | 1 ± 0.2 | 0.5 |
| PrRP8-20 | 7 ± 1.8 | 1.7 | 2.3 ± 0.5 | 1 |
| PrRP14-20 | 430 ± 16 | 105 | 14 ± 2 | 6 |
| A15PrRP20 | 882 ± 376 | 215 | 49 ± 12 | 22 |
| A19PrRP20 | > 10000 | >2440 | 1198 ± 231 | 545 |
| A20PrRP20 | 870 ± 288 | 212 | 20 ± 5 | 9 |
Values are the standard deviation (± SD) of parameters deduced by using GraphPad Prism 3.0 software. IC50 and EC50 values were obtained from resulting concentration-response curves. All signal transduction assays were performed in duplicates and repeated at least twice independently.
COS-7 cells were transiently transfected with PrRP receptor. The IC50 value was determined by competition assays using N[propionyl3H]hPrRP20.
Ratios with respect to the IC50 values of wt peptide: IC50 (peptide)/IC50 (PrRP20).
COS-7 cells were transiently transfected with wt hPrRP receptor. EC50-values were obtained from IP accumulation assay.
Ratios with respect to the EC50 values of wt peptide: EC50 (peptide)/EC50 (PrRP20).
The radioligand binding assays revealed IC50-values of 1.2 ± 0.1 nM and 7 ± 1.8 nM for PrRP4-20 and PrRP8-20, respectively. These values are comparable to PrRP20 (4.1 ± 0.7 nM, The heptapeptide, PrPR14-20, exhibited a 105-fold reduction in binding compared to PrRP20. Loss of binding was even more dramatic in the single mutant analogs: an IC50-value of 870 ± 288 nM was obtained for A20PrRP20, whereas for A19PrRP20, no IC50-value could be determined for concentrations of up to 10 µM of the ligand. A15PrRP20 behaved similarly to A20PrRP20, resulting in a 215-fold decrease in binding (Table 3).
In the signal transduction assays with the wt receptor, A19PrRP20 revealed a 545-fold increase in EC50-values (1198 ± 231 nM) over unmodified PrRP20 (2.2 ± 0.3 nM). A20PrRP20 and A15PrRP20 had a lower impact in IP accumulation. The EC50-values were only 9- and 22-fold increased compared to the unmodified PrRP20, respectively. Apart from PrRP14-20, which exhibited a 6-fold increased EC50-value of 14 ± 2 nM, the truncated analogs, PrRP4-20 and PrRP8-20, showed wildtype-like signaling properties (Table 3).
PrRP8-20’s is unable to activate extracellular loop 1 PrRP receptor mutants
Next, we investigated the interaction of PrRP8-20 and PrRP20 with different receptor mutants. Because extracellular loop 1, referred to as EL1 for the remainder of this discussion, of other peptide receptors is known to be important for interactions with the ligands,33,34 we assumed that charged or aromatic amino acids of the EL1 region may be involved in ligand recognition via hydrophobic, ionic, or π-cationic interactions. Therefore, we substituted all such residues between position 2.64 and 2.73 to alanine (Table 4). The single-substituted F2.66A, E2.67A, R2.69A, and F2.73A receptor mutants behaved like wt PrRP receptor after treatment with PrRP20 in an IP accumulation assay. However, Y2.64A and W2.71A PrRP receptor variants resulted in significantly increased EC50-values when stimulated with PrRP20 (50 ± 7.5 nM and 593 ± 78 nM, respectively). Stimulation of receptor mutants Y2.64A and W2.71A with PrRP8-20 revealed a further right-shifted concentration-response curve when compared to activation with PrRP20 (Figure 5) and hence elevated EC50-values (434 ± 96 nM and 2119 ± 390 nM, respectively, Table 4). We hypothesized that changes in structure or dynamics of the ligand might cause this difference in receptor activation, as mutation/deletion studies of residues 1–7 did not suggest a direct contact point between this part of the ligand and the receptor.
Table 4.
Signaling Properties of PrRP8-20 with Respect to PrRP Receptor
| Receptor Mutants |
PrRP20 | PrRP8-20 | ||
|---|---|---|---|---|
| EC50 [nM]a |
x-foldb | EC50 [nM]a |
x-foldb | |
| wt PrRP receptor | 2.2 ± 0.3 | 1 | 2.3 ± 0.5 | 1 |
| Y2.64A | 50 ± 7.5 | 23 | 434 ± 96 | 197 |
| F2.66A | 6.2 ± 3.3 | 3 | NT | - |
| E2.67A | 7.2 ± 3.4 | 3 | NT | - |
| R2.69A | 4.2 ± 2.5 | 2 | NT | - |
| W2.71A | 593 ± 78 | 270 | 2119 ± 390 | 963 |
| F2.73A | 4.4 ± 2 | 2 | NT | - |
NT = not tested; Values are the standard deviation (± SD) of parameters deduced by using GraphPad Prism 3.0 software. EC50 values were obtained from resulting concentration-response curves. All signal transduction assays were performed in duplicate and repeated at least twice independently.
COS-7 cells were transiently transfected with wt hPrRP receptor. EC50-values were obtained from IP accumulation assay.
Ratios with respect to the EC50 values of wt peptide: EC50 (peptide)/EC50 (PrRP20).
Figure 5.
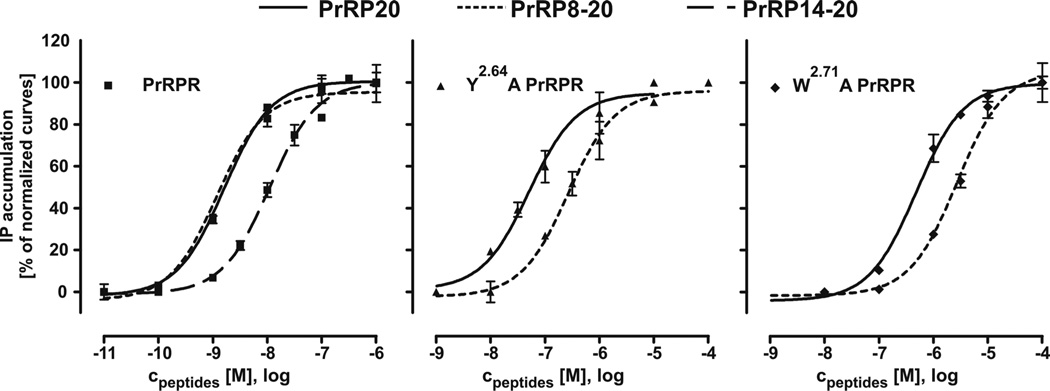
IP Accumulation of PrRP and Truncated Analogs Tested at PrRP Receptor Mutants. COS-7 cells were transiently transfected with DNA coding for the wt, Y2.64A, or W2.71A receptor. The signal transduction assay was performed with PrRP20, PrRP8-20, as well as with PrRP14-20 for wt PrRP receptor. All experiments performed with PrRP8-20 lead to a significantly right shifted curve, whereas PrRP8-20 behaves like PrRP20 with respect to wt receptor.
Discussion
Structure-activity/affinity studies are needed to understand PrRP receptor activation
The objective of this study is to better understand the structural determinants of PrRP receptor activation, an important milestone towards the development of potent small-molecule agonists given the increasing prevalence for the physiological role of PrRP20 and its receptor.35 This is a formidable challenge, as structure-activity relationship studies of PrRP/PrRP receptor system are rare. Initial investigations of the truncated PrRP20 analogs, PrRP4-20 and PrRP8-20, exhibited wildtype-like binding and IP accumulation behavior. Further, in our assay system, a reduced affinity of the full agonist, PrRP14-20, is in accordance with recent studies.1,11 We hypothesized that the structure and dynamics of PrRP’s interaction with the receptor is altered through the truncation, rather than single point mutation, of the peptide. This hypothesis was tested through CD and NMR spectroscopic studies that assert the secondary structure of the peptide. To mimic the amphipathic environment of the peptide when it is interacting with the receptor, the additives SDS and TFE were used.36,37
CD and NMR spectroscopic studies support a mainly helical peptide conformation
While SDS is an accepted membrane mimic, TFE mainly induces secondary structure.38 SDS micelles provide a non-isotropic, apolar environment in which the membrane interactions of the biomolecules can be investigated. A molecular dynamics study has shown that, in a TFE/water mixture, the organic co-solvent aggregates around the peptide, forming a matrix that partly excludes water. This process stabilizes the secondary structure, as the formation of proximate interactions is assisted.38 We suggest that, to some extent, both solvents mimic the membrane surface thought to contribute to the transition of the peptide from a random coil to a helical conformation that is recognized by the receptor.39 Accordingly, we assume that PrRP20 will adopt a conformation more similar to the bioactive form when interacting with these solvents.
According to our CD spectroscopic studies, the single mutant PrPR20 analogs, A15PrRP20, A19PrRP20, and A20PrRP20, fully maintained their PrRP20-like α/310-helical conformation in SDS and TFE. This is especially remarkable because all of them display significantly reduced binding and signaling properties with respect to the wt receptor. It is noteworthy that the binding and signaling studies herein are in agreement with recently published structure-activity studies that describe the importance of R15, as well as the RF-amide motif.1,11 PrRP20 and PrRP4-20, while exhibiting some 310-helical character in phosphate buffer, became increasingly α-helical in SDS and TFE. In contrast, PrRP8-20 appears to be primarily disordered, or nascent helix at most, in SDS. Its 310-helix component does increase in TFE, but it is almost undoubtedly not an α-helix, unlike the full-length peptide. Our results indicate that the peptide length of PrRP is a significant determinant in its ability to form an α-helix. It appears that the N-terminus, which exhibits increased flexibility, is nevertheless involved in stabilizing the C-terminal helical segment. Even though PrRP8-20 fully activates the wt receptor (Figure 5), it shows little α-helical propensity in SDS and TFE when compared to PrRP20.
Earlier CD studies could not clearly distinguish between 310- and α-helical peptide structures, which were investigated using a set of seven peptides ranging in length from 10 to 21 amino acid residues.40 In contrast, a recent report describes the standard CD spectrum of a 310-helial octapeptide.29 Indeed, evidence of this combination of coil and helical secondary structure can be seen in the CD spectra of the PrRP analogs, which were collected in SDS micelles or TFE (Figure 3, left panel). The shape of PrRP20 and PrRP4-20 in TFE fits to the former described spectrum for an α-helical peptide.29,41 In the case of PrRP8-20, the membrane-mimicking SDS micelles are not capable of inducing α- or 310-helical conformation, in contrast to the longer peptides. For the analogs PrRP8-20 and PrRP14-20, the shape of the curves is altered, having a lower Cotton effect and different minima.
The combination of CD and computational modeling results, as well as analysis of the 13 C-terminal residues of PrRP20, imply a structural model for the full-length peptide, in which the peptide forms an extended helix. According to a secondary structure analysis of the final ensemble with DSSP,22,23 it appears that, in most low-energy RosettaNMR models, 8–9 of the 13 residues tend to be α-helical. The ideal helical geometry is broken around residue I14. This is expected due to the lack of ideal α-helix hydrogen bonding between R12 and P16, as well as between G13 and V17. In our model, the helix bulges and bends in this area. Interestingly, the helical character of the models can either consist of all α-helix or a combination of approximately half α-helix and half 310-helix (Table S5, Models 10 and 11); this matches observations from CD investigations of PrRP20 and PrRP4-20, as well as the combination of i(i+2) and i(i+3) NOEs obtained by D’Ursi et al. on PrRP20 (Table S2). According to these data, PrRP20 in solution is not solely α-helical, nor is it completely random coil.
The presence of potential 310-helical character in the PrRP20 models may be a result of its amphipathic nature and the fact that the NMR data were also collected in SDS micelles at high PrRP20 concentration (0.5−15 mM).12 Indeed, there is evidence that amphipathic helices can assume extended (often 310) helical conformations in certain mediums, such as in detergent micelles.42,43 Remarkably, it has been proposed that the R1xxR2xxR3xxR4xxR5xxR6 motif in the Kv1.2- and Kv2.1-chimeric potassium ion channel structures form an extended 310-helix, which allows the arginine residues to sit on the same side of the helix.44,45 This is also often observed in our models of PrRP, which contains three arginine residues in an R1xxR2xxxR3 motif. Further, the conformational equilibrium between nascent, α-, and 310-helix is seen in other systems. Another neuropeptide, the galanin-like peptide (GALP) has been shown to be only loosely ordered in solution, but in TFE, it forms stable helical structures. Indeed, its CD spectrum resembles that of a 310-helix and is similar to our CD spectra obtained for PrRP20 in buffer and SDS and PrRP8-20 in TFE.46 The 16 amino acid sequences of the C-terminal helices of two bacterial cytochromes were synthesized and characterized by CD and NMR spectroscopy. These peptides’ spectra also imply a dynamic equilibrium between α- and 310-helix.47 It is possible that this conformational equilibrium is due to folding and unfolding of the free (as opposed to receptor-bound) peptide in solution; the 310-helix is often considered to be a kinetic intermediate when forming an α-helix from coil.25,48,49
Receptor residues Y2.64 and W2.71 may induce ligand helicity and facilitate binding and activation
To further elucidate the role of N-terminal PrRP20 truncations with respect to ligand binding, we chose to study the EL1 of the receptor because this region is known to be a prominent agonistic binding region in GPCRs. With respect to receptor activation, the alanine scan of selected amino residues within EL1 of the PrRP receptor identified the aromatic residues Y2.64 and W2.71 to be important. Both residues might contribute to a hydrophobic cluster, as described for the neurotensin receptor 1, where EL1 is described to be stabilized by π-stacking clusters and was proved to be important for agonist binding.33 In addition, Y2.64 in particular has already been identified to participate in ligand binding in the Y1 receptor50 and is thought to be part of a formed cluster in the binding-site crevice at the aminergic GPCR.51 PrRP20 stimulation resulted in increased EC50-values in Y2.64A and W2.71A PrRP receptor mutants. This fits to the reported ligand-binding and receptor-activating role of EL1 in GPCRs.52–54 In particular, W2.71 is located in the previously described WxGF-motif,34 which is necessary for receptor activation. Activation by a ligand occurs most likely by inducing movement of the transmembrane helices. While PrRP20 and PrRP8-20 exhibit identical potency for the wt receptor, PrRP8-20 was less potent at theY2.64A or W2.71A PrRP receptor.
Combining these findings, we expect that the receptor assists PrRP in forming its bioactive α-helical conformation. This conformation is induced by the wt receptor for PrRP20, as well as PrRP8-20, even though its α-helical propensity is reduced due to the missing residues 1–7. However, the mutations Y2.64A and W2.71A partially impair the helix-inducing capabilities of the receptor. This leads to a reduced activity for both peptides PrRP20 and PrRP8-20. The reduced helical propensity of PrRP8-20 results in a more dramatic loss of activity for its interaction with the mutant receptors. The results obtained from our structure-activity and spectroscopic studies suggest that Y2.64 and W2.71 provide part of the hydrophobic framework that induces helicity in the ligand.
Conclusion
The C-terminal segment of PrRP20 was shown by NMR and CD spectroscopy to adopt a combination of α- and 310-helical conformation in SDS micelles and becomes primarily α-helical in TFE. Moreover, the decreased stability of the helical segment generated by shorter PrRP20 analogs resulted in reduced biological activity. In contrast, single amino acid replacement of crucial residues led to significantly decreased binding and activity, while the overall peptide structure was maintained. With respect to future structure/activity studies, we disclose that a stable C-terminal α-helix facilitates the ligand recognition by its receptor. By making a three-dimensional structure of PrRP publicly available, the structure-function studies can now be performed more effectively with the ability to look at the structure of the peptide itself. Additionally, the identification of the important residues Y2.64 and W2.71 with respect to ligand binding and receptor activation offers an initial step, as comprehensive structure/activity studies are rare and no antagonist of the PrRP receptor is known. Due to the involvement of PrRP20 in energy and body weight homeostasis and food intake, it provides a remarkable target for future drugs.35 The Cartesian coordinates of the ensemble of structures of the PrRP20 C-terminal segment discussed herein has been included in the Supplementary Information, as well as deposited in the Protein Model Database (PM ID: PM0078404) for other researchers to use to further their own studies.
Materials and Methods
Structure determination using RosettaNMR
Details of the RosettaNMR protocol have been described elsewhere.14–16,55 Briefly, torsion angle restraints were derived from 13 Hα chemical shift values using TALOS56 (Table S1). Further, 28 distance restraints obtained from NOEs between backbone hydrogen atoms were used and were classified as either “strong” (proton-proton distance ≤ 3Å) or “weak” (proton-proton distance ≤ 5Å) (Table S2). A library of overlapping 3- and 9-amino acid peptides spanning residues 8–20 of PrRP20 were generated from coordinates found in the PDB. During folding, an additional 10 NOEs resulting from resonances between side chain protons – again, classified as “strong” (≤ 3Å) or “weak” (≤ 5Å) – were included as distance restraints (Table S2).
Ten thousand backbone-only structural models were generated using RosettaNMR’s de novo folding algorithm.57,58 From these original models, the 10% most energetically favorable models (according to the RosettaNMR scoring function) were refined to atomic detail, including the addition of the functionally obligatory C-terminal amide functional group. The RosettaNMR energy function includes solvation, electrostatic interactions, van der Waals attraction/repulsion, and hydrogen bonding, all of which were included in the assessment of overall structural quality.21,57 The 20 conformations that fulfill the distance restraints with deviations smaller than 1Å and have the lowest RosettaNMR energies constitute a conformational ensemble that is consistent with the published NMR data and is physically plausible according to the RosettaNMR energy function (Figure 1).
Peptide synthesis
PrRP20, PrRP14-20, PrRP8-20, PrRP4-20, A15PrRP20, A19PrRP20, and A20PrRP20 were synthesized by automated multiple solid-phase peptide synthesis on the multiple peptide synthesizer Syro II (MultiSynTech GmbH, Witten, Germany) using the orthogonal Fmoc/tBu strategy.59 Rink amide resin (30 mg, resin loading 0.6 mmol·g−1), obtained from Iris Biotech GmbH (Marktredwitz, Germany), was used to produce the C terminally amidated peptides. Nα-Fmoc (N-(9-fluorenyl)methoxycarbonyl)-protected amino acids were purchased from Iris Biotech GmbH (Marktredwitz, Germany). The protected amino acids (10eq) were dissolved in 0.5 M tert-butyl alcohol in dimethylformamide and activated in situ by diisopropylcarbodiimide (DIC) (10eq). Removal of protection groups and final cleavage of the peptide from the resin was accomplished simultaneously using a cleavage cocktail consisting of either trifluoroacetic acid (TFA)/thioanisole/1,2-ethanedithiol (90:7:3 v/v/v) for tryptophane-containing peptides or TFA/thioanisole/p-thiocresol (90:5:5 v/v/v) within 3 hours.
Peptide purification was achieved by preparative reversed-phase HPLC (Vydac RP18-column, 22 × 250 mm, 10 µm/300Å, Grace, Deerfield, IL, USA or Phenomenex Jupiter 10 U Proteo column, 250 × 21.20 mm, 90Å, Aschaffenburg, Germany) using 0.08% TFA in either acetonitrile or methanol and 0.1% TFA in water as the eluting system to yield homogenous peptides of > 90% purity. The peptides were characterized by mass spectrometry using matrix-assisted laser desorption ionization time-of-flight (MALDI-TOF) mass spectrometry on an Ultraflex III MALDI-TOF/TOF mass spectrometer (Bruker Daltonics, Bremen, Germany). Analytical reversed-phase HPLC was performed on a Vydac RP18-column (4.6 × 250 mm; 5 µm/300 Å; Grace, Deerfield, IL, USA) by using two different linear gradient systems of 0.1% (v/v) TFA in water and 0.08% (v/v) TFA in either acetonitrile or methanol. Analytical data are summarized in Table 1.
Cloning of the RF-amide peptide receptors in eukaryotic expression vectors
To obtain genomic DNA from SMS-KAN cells, approximately 1 million cells were digested overnight at 55°C with 500 µL lysis buffer (1 M NaCl, 20% SDS, 0,5 M EDTA, 1 M Tris, pH 8.5) containing 50 µg proteinase K (Promega, Mannheim, Germany). Genomic DNA was extracted using phenol/chloroform and precipitated from the aqueous phase with isopropanol, washed with ethanol, and then dissolved in water. The coding sequence of the human PrRP receptor was obtained by PCR amplification from the genomic DNA of SMS-KAN cells. Cloning of cDNA into the eukaryotic expression vector pEYFP-N1 (Clontech, Heidelberg, Germany) C-terminally fused to EYFP was performed, using the XhoI and BamHI site to result in the constructs phPrRP receptor_EYFP-N1. Mutations were introduced with the QuikChange™ site-directed mutagenesis method (Stratagene). The residues are numbered according to the system of Ballesteros and Weinstein.60 The correctness of all constructs was confirmed by sequencing of the entire coding sequence.
Cell culture
Cell culture material was supplied by PAA Laboratories GmbH (Pasching, Austria). COS 7 cells (African green monkey, kidney) were cultured in Dulbecco’s Modified Eagle’s Medium containing 10% (v/v) heat-inactivated fetal calf serum (FCS), 100 units/mL penicillin and 100 µg/mL streptomycin. SMS-KAN cells (human neuroblastoma cells) were maintained in nutrient mixture Ham’s F12/Dulbecco’s modified Eagle medium (1:1) with 15% (v/v) FCS, 4 mM glutamine, 0.2 mM non essential amino acids, 10 units/mL penicillin, and 10 µg/mL streptomycin. Cells were grown as monolayers at 37°C in a humidified atmosphere of 5% CO2 and 95% air.
Signal transduction assay
For signal transduction (inositol phosphate accumulation) assays, COS-7 cells were seeded into 24-well (1.0 × 10⁵ cells/well) or 48-well plates (6.0 × 10⁴ cells/well) and transiently transfected with 0.4 µg plasmid DNA using 1.2 µL metafectene (Biontex Laboratories GmbH, Martinsried/Planegg, Germany). Incubation with 2 µCi/mL [3H]myo-inositol (GE Healthcare Europe GmbH, Braunschweig, Germany) in DMEM supplemented with 10% (v/v) FCS was performed one day after transfection and 16 h before stimulation. Labeled cells were washed once and stimulated with increasing concentrations of each peptide for 1 h at 37°C in DMEM containing 10 mM LiCl (Sigma-Aldrich, Taufkirchen, Germany) as described previously.59,61 Receptor stimulation and IP accumulation were stopped by aspiration of medium, and cell lysis was performed with 0.1 M NaOH (24-well plate: 150 µL/well; 48-well plate: 100 µL/well) for 5 minutes. After neutralizing with 0.2 M (24-well plate: 50 µL/well) or 0.13 M (48-well plate: 50 µL/well) formic acid, IP dilution buffer (5.0 mM Na-borate + 0.5 mM Na-EDTA; 24-well plate: 1 mL/well; 48-well plate: 750 µL/well) was added to each well.
Intracellular IP levels were determined by anion-exchange chromatography on Bio-Rad AG 1-X8 resin either by manual pipetting or using an automated pipetting robot system (USK-UTZ GmbH, Limbach-Oberfrohna, Germany). Radioactivity was measured by a scintillation counter (Win Spectral 1414 Liquid Scintillations Counter Wallac).62,63 Data were analyzed with GraphPad Prism 3.0 program (GraphPad Software, San Diego, USA) and EC50-values were obtained from concentration response curves. The EC50-determinations were performed in duplicate and signal transduction assays were repeated at least twice independently.
Radioligand binding studies
For radioligand binding studies, 1.5 × 10⁶ COS-7 cell were seeded into 25 cm2 flasks. At 60–70% confluency, cells were transiently transfected using 4 µg vector DNA and 15 µL of Metafectene™ (Biontex Laboratories GmbH, Martinsried/Planegg, Germany). Approximately 24 hours after transfection, binding assays were performed on intact cells using N[propionyl3H]hPrRP20. Binding was determined with 1 nM N[propionyl3H]hPrRP20 in the absence (total binding) or in the presence (non-specific binding) of 1 µM unlabeled hPrRP20, respectively, as described previously.61,64 N[propionyl3H]hPrRP20 was obtained by selective labeling as described previously and resulted in a KD-value of 0.58 nM.65 Specific binding of each PrRP receptor mutant was compared to specific binding of the PrRP wt receptor. IC50-values and KD-values were calculated with GraphPad Prism 3.0 (GraphPad Software, San Diego, USA), fitted to a one-site competition or a one-site binding model, respectively. Each experiment was performed in triplicate.
CD spectroscopy
CD measurements of 40 µM peptide solutions buffered with 10 mM phosphate buffer at pH 5.5 or 7 were performed in the far ultraviolet region from 250 to 190 nm using a Jasco J-715 spectropolarimeter. Additionally, CD spectra of 10 mM phosphate buffered peptide solutions were measured in either 25% TFE or 100 mM SDS-containing solutions. Cuvettes with 2 mm path length (quartz cuvette; Hellma, Jena, Germany), as well as the following parameters, were used: 50 nm·min−1 scanning speed, 4 s response, 0.2 nm step resolution, 2 nm bandwidth, temperature of 22°C. Peptide concentration was determined from the aromatic spectrum determined in aqueous solution and calculated using the molar extinction coefficient of the peptides at 280 nm (6990 M−1 cm−1). For PrRP14-20, the pure lyophilized peptide was weighed and diluted to 40 µM, considering that the final peptide mass results from the salt with TFA as counterion for both arginine residues. Spectra were measured in a constant nitrogen stream of 15 L·min−1. The final spectra were averaged from 6 to 9 baseline-corrected scans without any smoothing. The raw CD signal [mdeg] was converted to mean residue ellipticity, [Θ], by [Θ] = [Θ]observed(MRW/l·c·10), where MRW is the mean residue weight (molecular mass divided by number of peptide bonds), l is path length [cm] and c is the concentration of peptide in mg/mL. Graphs were processed using GraphPad Prism 3.0 program (GraphPad Software, San Diego, USA), Microsoft Excel 2011™, as well as with the Jasco-715 spectropolarimeter-related Jasco software.
Supplementary Material
Acknowledgements
We thank D’Ursi et al., the authors of the original report of the structure of PrRP, the NMR data without which we could not determine the structure with RosettaNMR. We also thank the members of the RosettaCOMMONS for their assistance, especially Oliver Lange (folding with NMR restraints) and Steven Combs (addition of C-terminal amidation capability). Financial support of the DFG to ABS (SFB 610, BE 1264-11) and NIH to JM (R01 MH090192, R01 GM GM080403) is kindly acknowledged.
Footnotes
Supporting Information
Detailed computational procedures, including RosettaNMR chemical shift and NOE input files, fragment generation, Rosetta command line options, and secondary structure information obtained by DSSP for all models in the final ensemble are available in the Supporting Information. The three-dimensional coordinates of the herein discussed model are also included.
References
- 1.Roland BL, Sutton SW, Wilson SJ, Luo L, Pyati J, Huvar R, Erlander MG, Lovenberg TW. Endocrinology. 1999;140:5736–5745. doi: 10.1210/endo.140.12.7211. [DOI] [PubMed] [Google Scholar]
- 2.Ibata Y, Iijima N, Kataoka Y, Kakihara K, Tanaka M, Hosoya M, Hinuma S. Neurosci Res. 2000;38:223–230. doi: 10.1016/s0168-0102(00)00182-6. [DOI] [PubMed] [Google Scholar]
- 3.Fujii R, Fukusumi S, Hosoya M, Kawamata Y, Habata Y, Hinuma S, Sekiguchi M, Kitada C, Kurokawa T, Nishimura O, Onda H, Sumino Y, Fujino M. Regulat Pept. 1999;83:1–10. doi: 10.1016/s0167-0115(99)00028-2. [DOI] [PubMed] [Google Scholar]
- 4.Hinuma S, Habata Y, Fujii R, Kawamata Y, Hosoya M, Fukusumi S, Kitada C, Masuo Y, Asano T, Matsumoto H, Sekiguchi M, Kurokawa T, Nishimura O, Onda H, Fujino M. Nature. 1998;393:272–276. doi: 10.1038/30515. [DOI] [PubMed] [Google Scholar]
- 5.Engström M, Brandt A, Wurster S, Savola JM, Panula P. J Pharmacol Exper Therapeut. 2003;305:825–832. doi: 10.1124/jpet.102.047118. [DOI] [PubMed] [Google Scholar]
- 6.Hopkins AL, Groom CR. Nat Rev Drug Discov. 2002;1:727–730. doi: 10.1038/nrd892. [DOI] [PubMed] [Google Scholar]
- 7.Matsumoto H, Noguchi J, Horikoshi Y, Kawamata Y, Kitada C, Hinuma S, Onda H, Nishimura O, Fujino M. Biochem Biophys Res Commun. 1999;259:321–324. doi: 10.1006/bbrc.1999.0789. [DOI] [PubMed] [Google Scholar]
- 8.Lawrence CB, Celsi F, Brennand J, Luckman SM. Nat Neurosci. 2000;3:645–646. doi: 10.1038/76597. [DOI] [PubMed] [Google Scholar]
- 9.Ellacott KLJ, Lawrence CB, Rothwell NJ, Luckman SM. Endocrinology. 2002;143:368–374. doi: 10.1210/endo.143.2.8608. [DOI] [PubMed] [Google Scholar]
- 10.Bjursell M, Lennerås M, Göransson M, Elmgren A, Bohlooly-Y M. Biochem Biophys Res Commun. 2007;363:633–638. doi: 10.1016/j.bbrc.2007.09.016. [DOI] [PubMed] [Google Scholar]
- 11.Boyle RG, Downham R, Ganguly T, Humphries J, Smith J, Travers S. J Pept Sci. 2005;11:161–165. doi: 10.1002/psc.612. [DOI] [PubMed] [Google Scholar]
- 12.D'Ursi AM, Albrizio S, Di Fenza A, Crescenzi O, Carotenuto A, Picone D, Novellino E, Rovero P. J Med Chem. 2002;45:5483–5491. doi: 10.1021/jm020975p. [DOI] [PubMed] [Google Scholar]
- 13.Danho W, Swistok J, Khan W, Truitt T, Kurylko G, Fry D, Greeley D, Sun H, Dvorozniak M, Machie G, Spence C, Goodnow R. In: Chorev M, Sawyer T, editors. 18th Amer Pept Symp; Norwell, MA: Boston: Kluwer Academic; 2003. pp. 750–751. [Google Scholar]
- 14.Bowers PM, Strauss CEM, Baker D. J Biomolec NMR. 2000;18:311–318. doi: 10.1023/a:1026744431105. [DOI] [PubMed] [Google Scholar]
- 15.Meiler J, Baker D. Proc Natl Acad Sci USA. 2003;100:15404–15409. doi: 10.1073/pnas.2434121100. [DOI] [PMC free article] [PubMed] [Google Scholar]
- 16.Rohl CA. Methods Enzymol. 2005;394:244–260. doi: 10.1016/S0076-6879(05)94009-3. [DOI] [PubMed] [Google Scholar]
- 17.Millhauser GL, Stenland CJ, Hanson P, Bolin KA, van de Ven FJ. J Molec Biol. 1997;267:963–974. doi: 10.1006/jmbi.1997.0923. [DOI] [PubMed] [Google Scholar]
- 18.Millhauser GL. Biochemistry. 1995;34:3873–3877. doi: 10.1021/bi00012a001. [DOI] [PubMed] [Google Scholar]
- 19.Schievano E, Pagano K, Mammi S, Peggion E. Biopolymers. 2005;80:294–302. doi: 10.1002/bip.20199. [DOI] [PubMed] [Google Scholar]
- 20.Castrignanò T, De Meo P, Cozzetto D, Talamo I, Tramontano A. Nucl Acids Res. 2006;34:D306–D309. doi: 10.1093/nar/gkj105. [DOI] [PMC free article] [PubMed] [Google Scholar]
- 21.Bradley P, Misura KMS, Baker D. Science. 2005;309:1868–1871. doi: 10.1126/science.1113801. [DOI] [PubMed] [Google Scholar]
- 22.Joosten RP, te Beek TAH, Krieger E, Hekkelman ML, Hooft RWW, Schneider R, Sander C, Vriend G. Nucl Acids Res. 2011;39:D411–D419. doi: 10.1093/nar/gkq1105. [DOI] [PMC free article] [PubMed] [Google Scholar]
- 23.Kabsch W, Sander C. Biopolymers. 1983;22:2577–2637. doi: 10.1002/bip.360221211. [DOI] [PubMed] [Google Scholar]
- 24.Haridas V. Euro J Org Chem. 2010:5112–5128. [Google Scholar]
- 25.Rohl C. Protein Sci. 1996;5:1687–1696. doi: 10.1002/pro.5560050822. [DOI] [PMC free article] [PubMed] [Google Scholar]
- 26.Tonlolo C, Benedetti E. Trends Biochem Sci. 1991;16:350–353. doi: 10.1016/0968-0004(91)90142-i. [DOI] [PubMed] [Google Scholar]
- 27.Liu Z, Chen K, Ng A, Shi Z, Woody RW, Kallenbach NR. J Amer Chem Soc. 2004;126:15141–15150. doi: 10.1021/ja047594g. [DOI] [PubMed] [Google Scholar]
- 28.Woody RW. J Amer Chem Soc. 2009;131:8234–8245. doi: 10.1021/ja901218m. [DOI] [PubMed] [Google Scholar]
- 29.Toniolo C, Polese A, Formaggio F, Crisma M, Kamphuis J. J Amer Chem Soc. 1996;118:2744–2745. [Google Scholar]
- 30.Toniolo C, Formaggio F, Tognon S, Broxterman QB, Kaptein B, Huang R, Setnicka V, Keiderling TA, McColl IH, Hecht L, Barron LD. Biopolymers. 2004;75:32–45. doi: 10.1002/bip.20109. [DOI] [PubMed] [Google Scholar]
- 31.Greenfield NJ. Anal Biochem. 1996;235:1–10. doi: 10.1006/abio.1996.0084. [DOI] [PubMed] [Google Scholar]
- 32.Cheng Y, Prusoff WH. Biochem Pharmacol. 1973;22:3099–3108. doi: 10.1016/0006-2952(73)90196-2. [DOI] [PubMed] [Google Scholar]
- 33.Harterich S, Koschatzky S, Einsiedel J, Gmeiner P. Bioorg Med Chem. 2008;16:9359–9368. doi: 10.1016/j.bmc.2008.08.051. [DOI] [PubMed] [Google Scholar]
- 34.Klco JM, Nikiforovich GV, Baranski TJ. J Biol Chem. 2006;281:12010–12019. doi: 10.1074/jbc.M600548200. [DOI] [PubMed] [Google Scholar]
- 35.Findeisen M, Rathmann D, Beck-Sickinger AG. Pharmaceuticals. 2011;11:1248–1280. [Google Scholar]
- 36.Chorev M, Gurrath M, Behar V, Mammi S, Tonello A, Peggion E. Biopolymers. 1995;36:473–484. doi: 10.1002/bip.360360410. [DOI] [PubMed] [Google Scholar]
- 37.Padmanabhan S, Jimenez MA, Laurents DV, Rico M. Biochemistry. 1998;37:17318–17330. doi: 10.1021/bi9813678. [DOI] [PubMed] [Google Scholar]
- 38.Roccatano D, Colombo G, Fioroni M, Mark AE. Proc Natl Acad Sci USA. 2002;99:12179–12184. doi: 10.1073/pnas.182199699. [DOI] [PMC free article] [PubMed] [Google Scholar]
- 39.Schwyzer R. Biopolymers. 1991;31:785–792. doi: 10.1002/bip.360310624. [DOI] [PubMed] [Google Scholar]
- 40.Sudha TS, Vijayakumar EK, Balaram P. Int J Pept Protein Res. 1983;22:464–468. doi: 10.1111/j.1399-3011.1983.tb02116.x. [DOI] [PubMed] [Google Scholar]
- 41.Wang J, McElheny D, Fu Y, Li G, Kim J, Zhou Z, Wu L, Keiderling TA, Hammer RP. Biopolymers. 2009;92:452–464. doi: 10.1002/bip.21258. [DOI] [PubMed] [Google Scholar]
- 42.Biron Z, Khare S, Samson AO, Hayek Y, Naider F, Anglister J. Biochemistry. 2002;41:12687–12696. doi: 10.1021/bi026261y. [DOI] [PubMed] [Google Scholar]
- 43.Hammarström LG, Gauthier TJ, Hammer RP, McLaughlin ML. J Pept Res. 2001;58:108–116. doi: 10.1034/j.1399-3011.2001.00858.x. [DOI] [PubMed] [Google Scholar]
- 44.Chen X, Wang Q, Ni F, Ma J. Proc Natl Acad Sci USA. 2010;107:11352–11357. doi: 10.1073/pnas.1000142107. [DOI] [PMC free article] [PubMed] [Google Scholar]
- 45.Vieira-Pires RS, Morais-Cabral JH. J Gen Physiol. 2010;136:585–592. doi: 10.1085/jgp.201010508. [DOI] [PMC free article] [PubMed] [Google Scholar]
- 46.Dastmalchi S, Church WB, Morris MB, Iismaa TP, Mackay JP. J Struct Biol. 2004;146:261–271. doi: 10.1016/j.jsb.2004.01.004. [DOI] [PubMed] [Google Scholar]
- 47.Bouchayer E, Stassinopoulou CI, Tzougraki C, Marion D, Gans P. J Pept Res. 2001;57:39–47. doi: 10.1034/j.1399-3011.2001.00792.x. [DOI] [PubMed] [Google Scholar]
- 48.Armen R, Alonso DOV, Daggett V. Protein Sci. 2003;12:1145–1157. doi: 10.1110/ps.0240103. [DOI] [PMC free article] [PubMed] [Google Scholar]
- 49.Sheinerman FB, Brooks CL. J Amer Chem Soc. 1995;117:10098–10103. [Google Scholar]
- 50.Sautel M, Rudolf K, Wittneben H, Herzog H, Martinez R, Munoz M, Eberlein W, Engel W, Walker P, Beck-Sickinger AG. Molec Pharmacol. 1996;50:285–292. [PubMed] [Google Scholar]
- 51.Shi L, Javitch JA. Ann Rev Pharmacol Toxicol. 2002;42:437–467. doi: 10.1146/annurev.pharmtox.42.091101.144224. [DOI] [PubMed] [Google Scholar]
- 52.Hawtin SR, Simms J, Conner M, Lawson Z, Parslow RA, Trim J, Sheppard A, Wheatley M. J Biol Chem. 2006;281:38478–38488. doi: 10.1074/jbc.M607639200. [DOI] [PubMed] [Google Scholar]
- 53.Peeters MC, van Westen GJ, Guo D, Wisse LE, Muller CE, Beukers MW, Ijzerman AP. FASEB J. 2011;25:632–643. doi: 10.1096/fj.10-164319. [DOI] [PubMed] [Google Scholar]
- 54.Peeters MC, van Westen GJ, Li Q, AP IJ. Trends Pharmacol Sci. 2011;32:35–42. doi: 10.1016/j.tips.2010.10.001. [DOI] [PubMed] [Google Scholar]
- 55.Meiler J, Baker D. J Mag Resn. 2005;173:310–316. doi: 10.1016/j.jmr.2004.11.031. [DOI] [PubMed] [Google Scholar]
- 56.Cornilescu G, Delaglio F, Bax A. J Biomolec NMR. 1999;13:289–302. doi: 10.1023/a:1008392405740. [DOI] [PubMed] [Google Scholar]
- 57.Rohl C, Strauss C, Misura K, Baker D. Methods Enzymol. 2004;383:66–93. doi: 10.1016/S0076-6879(04)83004-0. [DOI] [PubMed] [Google Scholar]
- 58.Simons KT, Kooperberg C, Huang E, Baker D. J Molec Biol. 1997;268:209–225. doi: 10.1006/jmbi.1997.0959. [DOI] [PubMed] [Google Scholar]
- 59.Findeisen M, Rathmann D, Beck-Sickinger AG. Chem Med Chem. 2011;6:1081–1093. doi: 10.1002/cmdc.201100089. [DOI] [PubMed] [Google Scholar]
- 60.Ballesteros JA, Weinstein H. Methods Neurosci. 1995;25:366–428. [Google Scholar]
- 61.Bohme I, Morl K, Bamming D, Meyer C, Beck-Sickinger AG. Peptides. 2007;28:226–234. doi: 10.1016/j.peptides.2006.08.042. [DOI] [PubMed] [Google Scholar]
- 62.Berridge MJ. Biochem J. 1983;212:849–858. doi: 10.1042/bj2120849. [DOI] [PMC free article] [PubMed] [Google Scholar]
- 63.Berridge MJ, Dawson RM, Downes CP, Heslop JP, Irvine RF. Biochem J. 1983;212:473–482. doi: 10.1042/bj2120473. [DOI] [PMC free article] [PubMed] [Google Scholar]
- 64.Höfliger MM, Castejon GL, Kiess W, Beck-Sickinger AG. J Recept Signal Transduct Res. 2003;23:351–360. doi: 10.1081/rrs-120026974. [DOI] [PubMed] [Google Scholar]
- 65.Koglin N, Lang M, Rennert R, Beck-Sickinger AG. J Med Chem. 2003;46:4369–4372. doi: 10.1021/jm0341251. [DOI] [PubMed] [Google Scholar]
Associated Data
This section collects any data citations, data availability statements, or supplementary materials included in this article.