Abstract
The responses of the malleus and the stapes to sinusoidal acoustic stimulation have been measured in the middle ears of anesthetized chinchillas using the Mössbauer technique. With “intact” bullas (i.e., closed except for venting via capillary tubing), the vibrations of the tip of the malleus reach a maximal peak velocity of about 2 mm/s in responses to 100-dB SPL tones in the frequency range 500–6000 Hz; vibration velocity diminishes toward lower frequencies with a slope of about 6 dB/oct. Opening the bulla widely increases the responses to low-frequency stimuli by as much as 16 dB. At low frequencies, malleus response sensitivity with either open or intact bullas far exceeds all previous measurements in cats and matches or exceeds such measurements in guinea pigs. Whether measured in open or intact bullas, phase-versus-frequency curves closely approximate those predicted from the magnitude-versus-frequency curves by minimum phase theory. The stapes responses are similar to those of the malleus, except that stapes response magnitude is lower, on the average, by 7.5 dB at frequencies below 2 kHz and 10.7 dB at 2 kHz and above. Comparison of the responses of the middle ear with those of the basilar membrane at a site 3.5 mm from the stapes indicates that, at frequencies below 150 Hz, the basilar membrane displacement is proportional to stapes acceleration. At frequencies between 150 and 2000 Hz, basilar membrane displacement is proportional to stapes velocity.
Introduction
This paper presents results of an investigation, using the Mössbauer technique, on the vibrations of the manubrium mallei and the stapes of the chinchilla middle ear. This investigation is part of an ongoing effort to clarify the relationship between the mechanics of the inner ear and the generation of spikes in the cochlear nerve. A major obstacle to specifying the mechanical bases of spike initiation—including the question of the timing relationship between inner hair cell response and basilar membrane motion—is the lack of comparable measurements of the responses to the same stimuli of various stages of acoustical signal processing (middle ear, basilar membrane, hair cells, cochlear afferents) in situ, in the same species and, preferably, in the same laboratory, utilizing standardized techniques. We have focused on the responses of the chinchilla auditory periphery to low-frequency tones, describing these responses at the levels of the auditory nerve, cochlear microphonics and the basilar membrane (Ruggero and Rich, 1983, 1987, and 1989; Ruggero et al. 1986b–d). The latter measurements are, of necessity, performed with widely opened bullas, while the auditory-nerve measurements have been often obtained with the bulla vented via a single small hole. Therefore, a principal motivation of the present study is to ascertain the extent to which the input to the cochlea (middle-ear ossicular motion) is affected by opening the bulla cavity. A second motivation for this investigation is to specify stapes motion as a function of pressure at the tympanic membrane, so as to permit computation of the cochlea-specific contributions to the response of the chinchilla basilar membrane. This question is of interest because there is evidence that low-frequency cochlear responses can be quite different in different species and, in particular, that the chinchilla basilar membrane displacement at very low frequencies is proportional to stapes acceleration (Dallos, 1970; Ruggero et al., 1986a,b), rather than stapes velocity, as is the case for the guinea pig and squirrel monkey (e.g., Johnstone and Taylor, 1970; Rhode, 1971). Finally, the study of the middle ear of the chinchilla is interesting in itself, given the widespread use of this species in auditory research. While many studies have measured middle ear vibration in the cat and guinea pig (see Table III) and in other mammalian species (Rhode, 1971 and 1978; Wilson and Bruns, 1983; Relkin and Saunders, 1980; Aitkin and Johnstone, 1972), no such measurements have yet been published for the chinchilla.
Table III.
Measurements of middle-ear vibration in cat, guinea pig, and chinchilla. Listed are all studies from which data were taken for Figs. 12 and 13. The abbreviations at left refer to labels in these figures. “Fig. No.” refers to the original papers; N is the number of ears included in each study. Parentheses indicate intact-bulla data derived from open-bulla measurements.
| Open bulla | Intact bulla | Source of data | Method | ||||
|---|---|---|---|---|---|---|---|
|
|
|
||||||
| Fig. No. | N | Fig. No. | N | ||||
| Cat | |||||||
| BV | Buunen and Vlaming, 1981 | 6 | 3 | 6 | 3 | malleus | laser interferometry |
| De | Decraemer et al., 1989 | 8 | 3 | malleus | laser interferometry | ||
| GP | Guinan and Peake, 1967 | 22 | 25 | 21 | (25) | stapes | stroboscopic microscopy |
| JT | Johnstone and Taylor, 1971 | 1 | 2 | stapes | Mössbauer | ||
| KT | Khanna and Tonndorf, 1972 | 10 | 4 | malleus | laser holography | ||
| TK67 | Tonndorf and Khanna, 1967 | 6 | 1 | 6 | 1 | malleus | forced vibration, CM |
| TK68 | Tonndorf and Khanna, 1968 | 10 | 3 | malleus | laser interferometry | ||
| Guinea pig | |||||||
| D75 | Dancer et al., 1975 | 9 | malleus | laser interferometry | |||
| D80 | Dancer et al., 1980 | 11 | 11 | malleus | laser interferometry | ||
| G | Gilad et al., 1967 | 1 | <3 | malleus | Mössbauer | ||
| H | Hoeft et al., 1964 | 4 | 6 | malleus | capacitive probe | ||
| JT | Johnstone and Taylor, 1971 | 1 | 6 | stapes | Mössbauer | ||
| MJ | Manley and Johnstone, 1974 | 2 | 3 | 2 | 4 | malleus | Mössbauer |
| N | Nuttall, 1974 | 4 | 9 | 6 | 4 | stapes | forced vibration, CM |
| R | Rhode, 1978 | 13(a) | 1 | incus | Mössbauer | ||
| WJ | Wilson and Johnstone, 1975 | 4 | 9 | 4 | (9) | incus | capacitive probe |
| Chinchilla | |||||||
| Ruggero et al., 1990 | 4 | 11 | 4 | 5 | malleus | Mössbauer | |
| 10 | 3 | 10 | (3) | stapes | Mössbauer | ||
I. Methods
A. Animal preparation
All experimental procedures, including surgery and all measurements of middle ear vibration, were carried out in live chinchillas anesthetized with sodium pentobarbital (initial dose: 65 mgAg intraperitoneally, with additional doses as required to maintain deep anesthesia). The animals were tracheotomized and intubated but usually not forcibly respired. The pinna and most of the external bony canal of the left ear were removed to permit easy visualization of most of the tympanic membrane. A metal speculum was sealed to what remained of the bony ear canal, with its central axis approximating the direction of motion of either the tip of the manubrium of the malleus or the stapes. The speculum was coupled to an earphone and a microphone via side tubes and was closed at its back by a removable plastic window which was transparent to gamma radiation. The tendon of the tensor tympani muscle was cut in all animals where stapes measurements were made, but it was left intact in those ears in which only malleus measurements were obtained. A ball electrode was placed on the round window through a small hole in the bulla, which was subsequently resealed with cement. The electrode was used to record cochlear microphonics and to monitor the compound action potential (CAP) in response to short tone pips. Data presented here were obtained from chinchillas whose initial CAP audiograms were judged to be normal.
B. Sound generation and calibration
Stimulation consisted of acoustic sinusoids (1- to 4-s duration; on/off ratio of to ; 25–120 repetitions, for a total on time of 60–120 s) transduced by a Beyer DT 48 earphone. Electrical sinusoids were generated by a custom digital wave generator controlled by a PDP 11/34 computer (Ruggero and Rich, 1983), which also provided synchronizing signals for processing of the gamma photon pulses. A miniature microphone, located outside the metal speculum and equipped with a plastic probe tube terminating some 2 mm from the umbo, was used to measure acoustic pressure (magnitude and phase) at all frequencies at which ossicular velocity data were collected. The acoustic calibration table, obtained immediately preceding velocity measurements for each of the experimental middle-ear conditions (with the bulla intact, perforated with a single small hole or widely open) was used by the computer to control the wave generator and a programmable attenuator to produce sinusoids with well-specified phases and intensities. Stimulus intensities, expressed in dB SPL (i.e., re: 0.0002 dyn/cm2), were selected to yield response velocities within the most favorable region of the dynamic range of our Mössbauer system; 2/3 of the responses had velocities in the range 0.07–0.35 mm/s.
C. Mössbauer methodology
The Mössbauer method to measure very small velocities is based on the detection of the Doppler frequency shift imparted on gamma radiation by motion of its source (Gilad et al. 1967; Rhode, 1971; Johnstone and Sellick, 1972; Lynch et al. 1982; Peake, 1989). Its application in our laboratory for the measurement of basilar membrane vibrations has been described in detail (Robles et al. 1986). In its present application, the Mössbauer source consisted of a 130 × 200-or 250 × 400-μm piece of a 6-μm-thick rhodium-foil matrix coated with Co-57, which was placed either on the external surface of the tympanic membrane, overlying the widest portion of the manubrium mallei, or on the footplate of the stapes. The source was manipulated by means of a metal probe under observation with an operation microscope (Zeiss Opmi-1). Placement of the source on the tympanic membrane umbo was performed manually, after lightly dabbing the source with petroleum jelly. Placement of the source on the footplate of the stapes was aided by a micromanipulator. In this case the source was held on the probe tip by means of a drop of thick sucrose syrup, which rapidly dissolved when the source contacted the stapes and became attached to it.
The gamma radiation was detected by means of a proportional counter placed immediately behind the back window of the ear speculum, with its receiving window covered by a piece of Fe-57-enriched palladium foil. The 14.4-KeV pulses were isolated by means of a single-channel analyzer. The combination of the rhodium-matrix source and the palladium absorber produces a velocity-versus-photon-countrate Lorentzian shaped curve (see Lynch et al. 1982) with an isomer shift of 0.07 mm/s and a half-height line width of 0.45 mm/s. The nonzero isomer shift allows the measurement of velocity phase with ambiguity of 360 deg (as opposed to 180 deg when there is no isomer shift).
The output of the single-channel analyzer—trains of uniform-height pulses (synchronous with the 14.4 keV gamma rays)—was binned in the form of 32-bin period histograms, which were displayed on-line and also stored for off line analysis. A least-squares-fit computer program was used to estimate a peak velocity and phase for each histogram, on the assumption that the source vibration was sinusoidal. Velocity and displacement magnitudes are presented as peak (i.e., rms· ) values, normalized to a stimulus level of 100 dB SPL, or (in Figs. 12 and 13) as rms displacement divided by rms stimulus pressure. With very few exceptions, data were actually collected at intensities below 100 dB SPL, at which the middle ear has been shown to respond linearly (e.g. Guinan and Peake, 1967; Buunen and Vlaming, 1981; Lynch et al., 1982). For the stapes measurements, mean stimulus intensity was 93 dB SPL; for the malleus, the mean was 86 dB. In order to explore whether middle-ear responses grew linearly with stimulus intensity, we divided the output ratio by the input ratio in 198 cases where responses of a given malleus or stapes at a single stimulus frequency were measured at more than one stimulus intensity (generally 5 to 10 dB apart). The mean output/input slope was 1.12 dB/dB and differed significantly from a slope of 1 dB/dB; thus responses nominally grew at a rate slightly faster than linear. This expansive nonlinearity is almost certainly due to errors in the procedure used to derive response magnitude and phase by fitting a velocity sinusoid (transformed by a nonlinear, Lorentzian-shaped, multiparameter equation) to each gamma-ray-count histogram. Errors of about 1 dB over a 10-dB range have, in fact, been measured in calibrating the Mössbauer method against well-specified vibrations of a speaker cone.
FIG. 12.
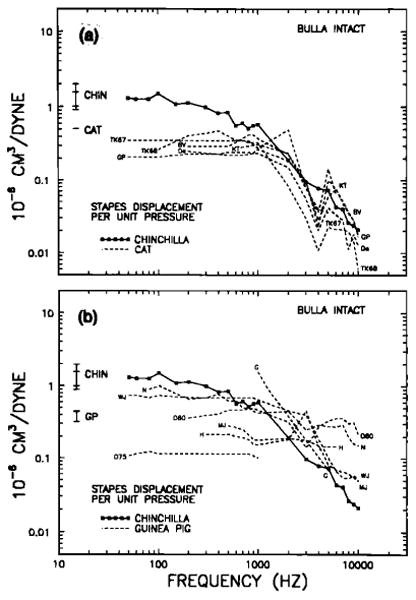
Stapes displacement per unit pressure, as a function of frequency, in the intact middle ears of chinchillas, cats (a) and guinea pigs (b). Included are results from all studies (see Table III) where middle ear vibration was directly measured as a function of stimulus frequency and pressure, including one in which results for intact middle ears were derived from open-bulla data (Wilson and Johnstone, 1975). Also included are results from two studies in which the responses to acoustic stimulation were de rived from recordings of cochlear microphonics elicited by mechanically forced ossicular motion (Nuttall, 1974, and Tonndorf and Khanna, 1967). In some cases, stapes displacement has been derived from malleus measurements, using a “lever ratio” of 2 for cats and guinea pigs. The chinchilla curve is that derived for middle ears with intact tympanic membrane and uncut tensor-tympani tendon (Fig. 10). The labels next to the curves for cats and guinea pigs identify the studies listed in Table III. The vertical bars on the left indicate theoretical low-frequency stapes displacements computed according to Eqs. (1)–(3) (see Table II).
FIG. 13.
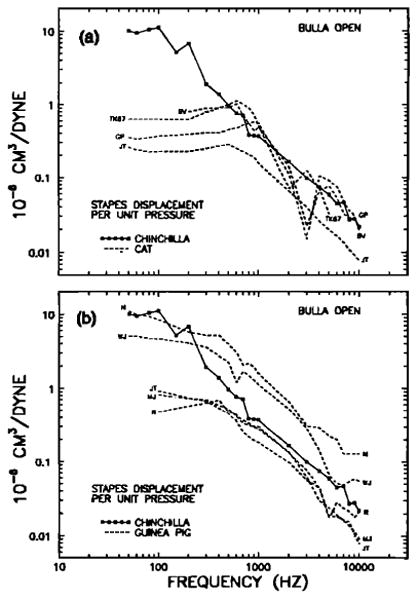
Stapes displacement per unit pressure, as a function of stimulus frequency, in the open middle ears of chinchillas, cats(a) and guinea pigs (b). See Fig. 11 caption for other details.
The measurements of malleus motion were carried out with the Mössbauer detector at an angle estimated to be about 45 deg from a tangent to the arc of motion of the tip of the manubrium mallei; this angle presumably caused under estimation of the actual, on-axis, malleus motion by 20 log [cos(45°)] =3 dB. In addition, because the Mössbauer source was placed on the umbo overlying the widest part of the manubrium, some 0.6 mm from its tip, the measured velocity must have underestimated the tip velocity by about 1 dB. Therefore, malleus data presented in this paper have been corrected to compensate for these two sources of underestimation. The stapes measurements, on the other hand, were carried out with the Mössbauer detector positioned at an angle sufficiently close to the stapes axis of motion (with in 20 deg) to require no correction.
II. Results
A. Malleus/umbo response in intact bullas
Figures 1–4 present results for the response of the tip of the manubrium mallei to sinusoidal acoustic stimulation in middle-ears approximating the normal closed-bulla situation (with intact tympanic membrane and middle-ear muscles uncut), hereafter called “intact.” In order to prevent the buildup of negative middle-ear pressure (Guinan and Peake, 1967), the bullas were vented with a capillary plastic tube (25 cm long, 0.28-mm inner diameter), which could be expected to significantly alter the middle-ear response only at very low frequencies.1 We verified experimentally, using cochlear microphonic recordings, that the tube's presence, in fact did not alter middle-ear transmission even at the lowest frequency (30 Hz) for which measurements are presented in this paper. The curves in Fig. 1 represent manubrium mallei peak velocities in three typical chinchillas, referred to a constant sound-pressure level of 100 dB, and plotted against stimulus frequency. Although there are many irregularities, all three curves follow certain common trends. For frequencies below 1000 Hz, malleus velocity increases with frequency at a rate of about 6 dB/oct. Between, roughly, 500 and 6000 Hz, there is a velocity plateau with a value close to 2 mm/s. Between 5 and 9 kHz, the three curves have negative slopes but they diverge widely at frequencies between 10 and 16 kHz. Although data were collected for higher frequencies, uncertainties as to the quality of acoustic calibration at these frequencies lead us to question their validity, and they are not presented here or elsewhere in this paper.
FIG. 1.
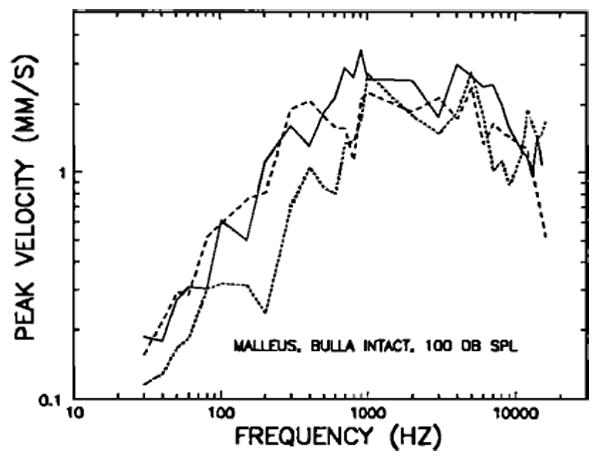
Peak velocity of vibration of the tip of the manubrium mallei at 100 dB SPL, as a function of stimulus frequency, measured in three chinchilla middle ears with intact bullas (ventad via a capibullary tube).
FIG. 4.
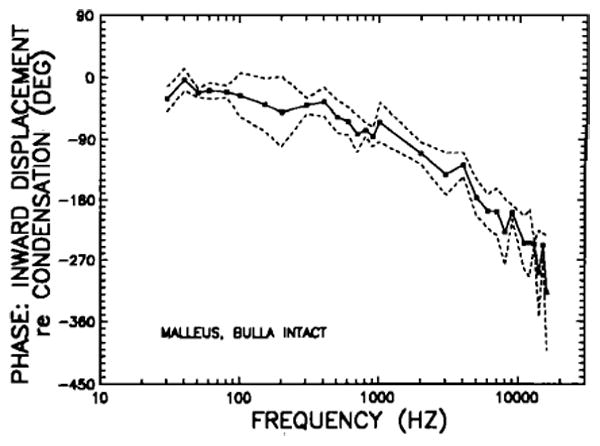
Displacement phases of the tip of the manubrium mallei in intact chinchilla middle ears, plotted as a function of stimulus frequency. The mean phases for the five middle ears represented in Fig. 2 correspond to peak inward displacement of the malleus relative to maximum condensation near the eardrum; dashed line indicates ± 1 standard deviation from the mean.
Figure 2 shows the means of peak velocities for five chinchillas (including the three of Fig. 1) referred to a constant 100 dB SPL; the dashed lines indicate ± 1 standard deviation from the mean. Comparison of Figs. 1 and 2 suggests that the prominent features in the magnitude curves of individual middle ears are generally well represented in the average curve. Below 500 Hz, there is generally a steady growth of velocity with increasing frequency; the slope of growth, computed by a least-squares algorithm for frequencies 30–500 Hz, is 5.1 dB/oct. Between 100 and 150 Hz, there appears to be a short plateau; this plateau corresponds to irregularities (velocity dips) which were found in three (out of five) middle ears at 150 or 200 Hz; such dips may be observed in two curves of Fig. 1. Due to the presence of this plateau, the velocity responses at frequencies below 500 Hz might be more accurately characterized as consisting of two segments with equal slopes, one between 150 and 500 Hz, the other extending to frequencies below 100 Hz; the slopes of these segments are 5.9 dB/oct (30–100 Hz) and 5.7 dB/oct (150–500 Hz). At 5 kHz, there is a relatively narrow response peak; this peak reflects similar peaks in the responses of four (out of five) middle ears. Two of these may be seen in Fig. 1. Above 5 kHz, responses steadily decrease with increasing frequency; between 5 and 16 kHz, the slope averages − 5.6 dB/oct.
FIG. 2.
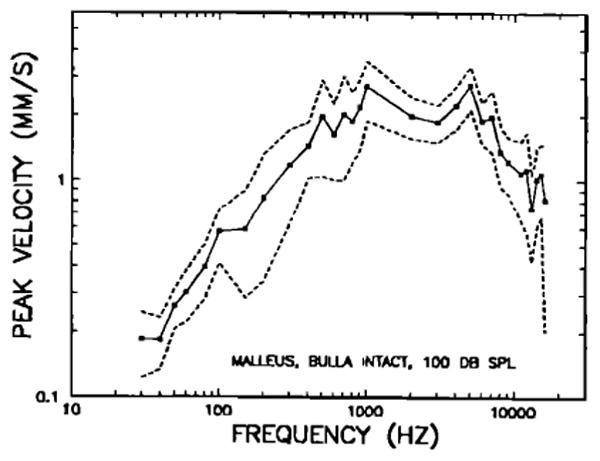
Peak velocity of vibration of the tip of the manubrium mallei at 100 dB SPL, as a function of stimulus frequency, in intact middle ears. The means of measurements in five chinchillas are indicated by closed symbols; dashed lines indicate ± 1 standard deviation from the mean.
Figure 3 presents the response phases for the three middle ears represented in Fig. 1. At the lowest frequencies (30–100 Hz), umbo inward displacement is close to being in phase with peak positive pressure (i.e., maximum condensation) in the external ear canal. At higher frequencies, phase lag increases with stimulus frequency. The mean phases for five chinchilla middle ears are shown in Fig. 4 as a function of frequency. Except for a few irregularities, phase lags tend to increase steadily as a function of increasing frequency: from about 20 deg below 100 Hz to 90 degrees at 1.5 kHz, 180 deg at 5 kHz, and 270 deg at 16 kHz. The low-frequency (< 150 Hz) displacement phases generally lag peak condensation at the tympanic membrane by statistically insignificant amounts. A displacement response in phase with condensation would be consistent with the (nearly) + 6-dB/oct slope of velocity magnitude in the same frequency range: Both measurements indicate that, at low frequencies, the intact middle-ear response is dominated by a compliance. In the next section, it will be shown that the compliance is that of the air trapped within the middle-ear cavities.
FIG. 3.
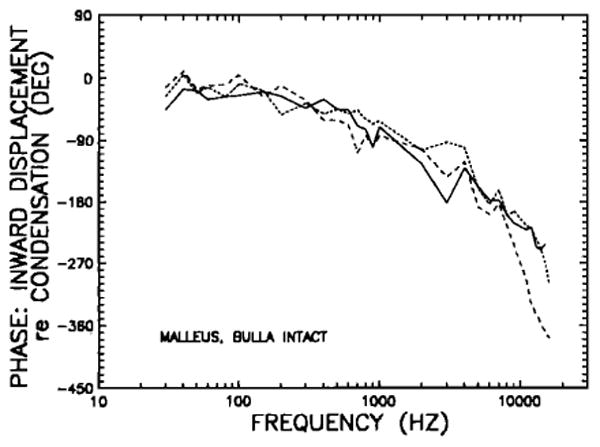
Displacement phases of the tip of the manubrium mallei in three intact chinchilla middle ears, plotted as a function of stimulus frequency. Phases (peak inward displacement re: maximum condensation at the tympanic membrane) are shown for the three middle ears of Fig. 1.
B. The effect of opening the bulla upon malleus motion
In order to assess the effects of opening the bulla, measurements were carried out under two other conditions, one in which the bulla was opened widely (hereafter referred to as “open bulla”) and the second with the bulla vented via a single small hole (1–2 mm in diameter, hereafter referred to as “small-hole”), as was the case for VIIIth-nerve single-unit recordings previously obtained in our laboratory (Ruggero and Rich, 1983 and 1987). Figure 5 presents the mean intact-bulla curve of Fig. 2 and, in addition, shows mean malleus velocities at 100 dB SPL for measurements in widely opened bullas and in bullas vented by means of single small holes. (For all three conditions, the tensor tympani tendon was left uncut.) As expected, at low frequencies, malleus velocity in the open-bulla condition exceeds that for the intact bulla. Below 100 Hz, the open- and the intact-bulla curves are roughly parallel, the latter being displaced some 16 dB below the former. This difference diminishes at higher frequencies, with the intact-bulla responses mostly coinciding with the open-bulla responses above 800 Hz. The response differences between open bulla and intact bulla at and below (but not above) 200 Hz are statistically significant. Between 100 and 300 Hz, there are prominent features in the open-bulla response: a velocity dip at 150 Hz, followed by a peak at 200 Hz and a decline at 300 Hz. The dip at 150 Hz is probably related to the velocity plateau in the intact-bulla response at 100–150 Hz; that this feature is more prominent in the responses of middle ears with open bulla than in those with intact bulla is consistent with its origin being either in the cochlea or in the ossicular chain, and with its effects at the malleus being attenuated by the dominant impedance of the bulla cavity.
FIG. 5.
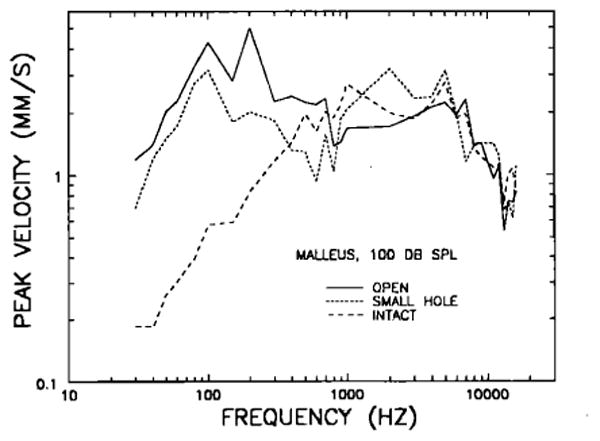
Comparison of the manubrium mallei's peak velocity responses to 100-dB SPL tones in intact middle ears (long-dash line), in widely opened middle ears (“open,” solid line) and in middle ears vented via single holes 1 - 2 mm in diameter (“small hole,” short-dash line). The intact middle-ear data (N =5) are the same as in Fig. 2. The open middle-ear data represent means for eight chinchillas. The data for small-hole bullas represent means for eight chinchillas.
The middle ears vented via a single 1- to 2-mm hole yielded what, to us, was an unexpected result: On the average, motion in the small-hole condition is more similar to that for the open-bulla than for the intact-bulla condition. At low frequencies (< 100 Hz), the malleus velocity curves for small-hole and open bullas are practically indistinguishable; at higher frequencies, there are some differences, the small-hole curve indicating lower velocities in the range 200–1000 Hz and higher velocities between 1 and 3 kHz. On the other hand, malleus motion in the small-hole condition is similar to that for the intact bulla only above 300 Hz. This discrepancy between intact-bulla and small-hole curves at low frequencies has implications for interpreting the relationship between basilar membrane mechanical data and cochlear-afferent neural data, which were obtained in our laboratory, respectively, with bullas widely opened or vented via single small holes (see Sec. III). It is noteworthy (but not shown in Fig. 5) that the variability of the response magnitudes was substantially larger for measurements when the bulla was vented by a single small hole than in the other two conditions.
Figure 6 presents the intact-bulla mean phase curve of Fig. 4 and, in addition, the phases corresponding to the magnitude data for open bullas and small-hole bullas (Fig. 5), in terms of phase of inward displacement of the manubrium mallei relative to maximum condensation in front of the eardrum. The curves for open bullas and small-hole bullas are nearly indistinguishable over the frequency ranges 30–500 Hz and above 2 kHz; they differ substantially between 600 and 1000 Hz. The intact-bulla curve leads the open-bulla curve at most frequencies below 2 kHz; the phase differences are statistically significant in the range 300–1000 Hz.
FIG. 6.
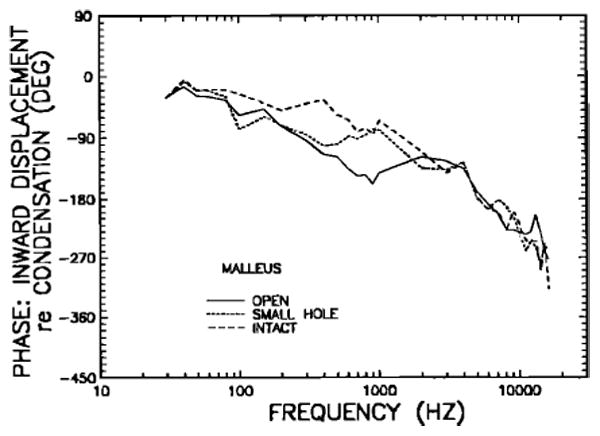
Comparison of the phases of inward malleus displacement, re: condensation near the eardrum, in intact middle ears (long-dash line), open middle ears (solid line), and small-hole middle ears (short-dash line). Phases are computed for the same data of Fig. 5.
For certain linear physical systems (“minimum-phase systems”), the magnitudes and phases of their frequency response are entirely interdependent and it is possible to compute the phase characteristic from the magnitude characteristic. We have used a minimum-phase algorithm (Bode, 1945; Thomas, 1947; see also Gummer and Johnstone, 1984) to compute predicted response phases on the basis of the magnitude data of Fig. 5. These are shown in Fig. 7, along with the intact- and open-bulla phase curves from Fig. 6. This comparison indicates that the acoustic-pressure/malleus-motion system may be described, at least to a first approximation, as being minimum phase.
FIG. 7.
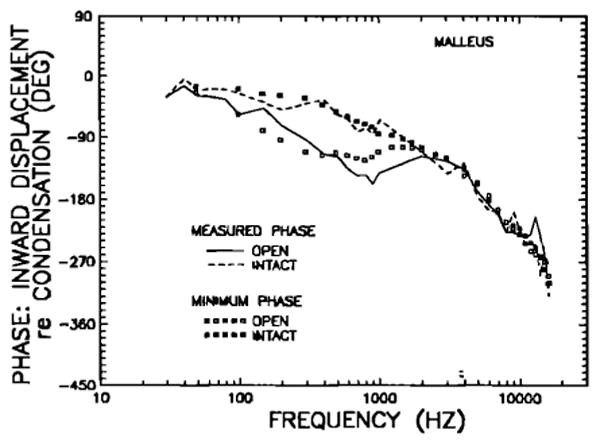
Comparison of measured malleus phases in intact and open middle ears (dashed and continuous lines, respectively) with the phases computed, using a minimum-phase algorithm, from the magnitudes of displacement responses (intact and open middle ears, closed and open symbols, respectively). The magnitude data for the minimum-phase computation are shown in Fig. 5.
C. Motion of the stapes in open bullas
Stapes motion was measured in seven chinchilla ears with widely opened bullas, including three ears in which malleus motion was also measured. In order to place the Mössbauer source on the footplate of the stapes (see Sec. I), it was necessary to make a slit (about 1.5 mm long) in the tympanic membrane, close to its superior edge and approximately parallel to the manubrium of the malleus. After placement of the source, a small piece of 13-μm-thick polyethylene sheet (0.52 mil, “Handi-Wrap II,” Dow), aided by fluid exudate, sealed the opening in the tympanic membrane. (The tensor tympani tendon was cut in all middle ears from which stapes data were obtained.) Figure 8 shows the mean velocity measurements for the stapes, referred to a sound pressure level of 100 dB, together with the open-bulla malleus data of Fig. 5. The two curves are generally similar except for a relative vertical displacement. At frequencies below 2 kHz, the malleus vibrates with velocities larger than the stapes by some 9.37 dB on average. This is equivalent to a “lever ratio” of 2.94, which is substantially larger than the accepted value of 2 for cats and guinea pigs (e.g., Guinan and Peake, 1967; Wilson and Johnstone, 1975) but differs little from the anatomical lever ratio (2.84) obtained in chinchillas by Vrettakos et al. (1988).
FIG. 8.
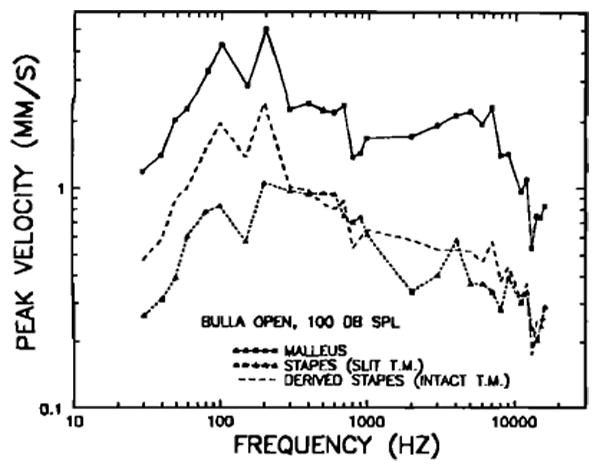
Comparison of mean peak velocity responses to 100-dB SPL tones of the tip of the manubrium mallei (squares and continuous line) and of the stapes (dashed lines) in open middle ears. The malleus data, measured in eight chinchillas with intact tympanic membrane and middle-ear muscles, are also shown in Fig. 5. The triangles connected with short-dash lines indicate stapes velocities measured in seven chinchilla middle ears in which a 1.5-mm slit had been made in the tympanic membrane and where the ten don of the tensor tympani muscle had been cut. Because there is evidence that these procedures diminished the magnitude of middle-ear response at low frequencies, a second stapes velocity curve (long dashes) was derived from the malleus responses in open bullas with intact tympanic membranes and uncut tensor tympani muscle (upper curve) and from the mean differences (smoothed using a five-point running average) between malleus and stapes responses in three chinchillas whose tympanic membranes had been slit and the tensor-tympani tendon had been cut. The derived stapes curve (long-dash line) should approximate stapes response in open-bulla middle ears with intact tympanic membranes and uncut middle-ear muscles.
Because the stapes measurements were performed in middle ears altered by slitting the tympanic membrane and with the tendon of the tensor tympani cut, it was important to estimate the effect of the procedures upon ossicular motion. This was accomplished by comparing malleus measurements in eight open-bulla middle ears with intact tympanic membranes and middle-ear muscles, with those from three open-bulla middle ears in which slits were made in the tympanic membrane and in which the tensor tympani tendon was severed. Except principally for the lowest frequencies, malleus motion was similar in both conditions; however, at frequencies less than 300 Hz, the malleus sensitivity in ears with intact tympanic membranes (and uncut tensor tympani tendons) exceeded, by about 6 dB, the sensitivity in middle ears with slit tympanic membranes. These differences, although not statistically significant, suggest that the lever ratio computed above may have been corrupted at low frequencies by the differences in experimental procedures and that the lever ratio should be derived using only the three middle ears in which both malleus and stapes measurements were carried out under identical conditions. (A comparison of stapes measurements for these three ears with results from four others indicates that the three are representative of stapes responses in middle ears with slit tympanic membrane and severed tensor-tympani tendon.) Stapes-to-malleus magnitude ratios and phase differences, computed frequency by frequency for these three middle ears and smoothed using a five-point running average, were used to derive stapes velocity- and phase-versus-frequency curves from the intact-bulla malleus data of Figs. 2 and 4. On the assumption that slitting the tympanic membrane and severing the tensor tympani tendon did not alter the ossicular lever ratio, these derived curves should closely approximate stapes responses in middle-ears with intact tympanic membrane and middle-ear muscles. The magnitude curve is plotted in Fig. 8 (long-dash line) and the phase curve is plotted in Fig. 9 (long-dash line). The average low-frequency (<2 kHz) lever ratio of these three middle ears was 2.38 (i.e., a malleus/stapes magnitude ratio of 7.54 dB). This alternative lever-ratio estimate, which we consider more valid than the one derived above from dissimilar middle-ear conditions for the malleus and stapes measurements, does not differ significantly, in a statistical sense, from the anatomical lever ratio (2.84) measured by Vrettakos et al. (1988). Above 1 kHz, the malleus/stapes ratios were generally larger, averaging 10.65 dB (lever ratio of 3.41) between 2 and 16 kHz.
FIG. 9.
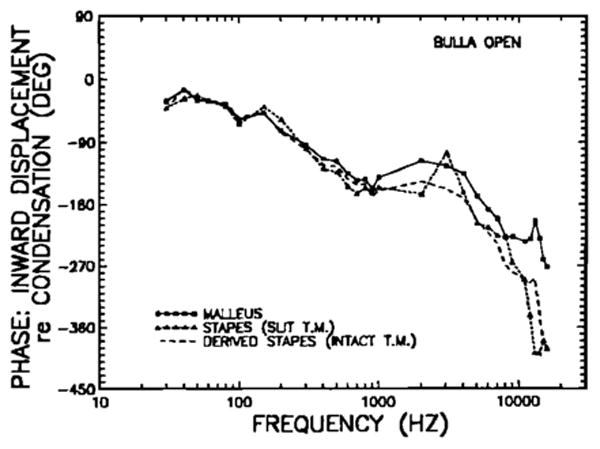
Comparison of the response phases of inward displacement of the malleus (squares and continuous lines) and of the stapes (dashed lines) in open middle ears, relative to condensation near the tympanic membrane. Phases are computed for the same data of Fig. 8. The malleus data are also shown in Fig. 6. The short-dash line indicates stapes phases measured in middle ears where the tympanic membrane had been slit and the tendon of the tensor tympani muscle had been cut. The long-dash line has been de rived: First, malleus phases were subtracted from stapes phases for three middle ears with slit tympanic membrane and cut tensor-tympani tendon; second, these phase differences (smoothed using a five-point running aver age) were added to the malleus phases for open middle ears with intact tympanic membrane and uncut tensor tympani tendon.
A comparison of the response phases of the malleus and stapes in open-bulla middle ears is shown in Fig. 9. The stapes phase curve for the middle ears with slit tympanic membrane and that derived for middle ears with intact tympanic membrane are very similar, except that the former displays a relative phase lead at 3 kHz, which is not present in the curve for intact tympanic membranes. Over most of the frequency range shown, from 30 Hz to 10 kHz, response phases of the malleus and stapes are also very similar; above 1 kHz, there is a systematically increasing lag of the stapes relative to the malleus. While the stapes phase lag relative to the malleus amounts to less than 10 degrees at low frequencies, over the range of 30–10 000 Hz, the lag grows slowly, becoming substantial (nearly 130 deg) only at the highest measured frequencies.
D. Derived motion of the stapes in intact bullas
Although no measurements of stapes motion were made in intact middle ears, it was possible to derive the expected response magnitudes and phases on the basis of the measured motion of the manubrium mallei and the stapes with open bullas (Figs. 8 and 9) and of the manubrium mallei motion in intact bullas (Figs. 2 and 4). A smoothed version of the average magnitude-versus-frequency curve for stapes re: malleus motion was computed on the basis of stapes and malleus measurements obtained under identical conditions (tympanic membrane slit and tendon of the tensor tympani muscle cut) in three middle ears with open bullas. Multiplication of these gains by the measured manubrium mallei velocity magnitudes in intact bullas (Fig. 2) permitted computation of an intact-bulla stapes-displacement frequency response. This derived intact-bulla curve is shown in Fig. 10 together with an open-bulla stapes-displacement curve computed from the derived velocity responses of Fig. 8 (long-dash line). The stapes frequency response in intact bullas has low-pass form, with a corner frequency near 500 Hz. Below 500 Hz the curve is flat, most displacement values lying close to 0.35 μm for a stimulus level of 100 dB. In this log–log plot, displacements at frequencies above 900 Hz have a locus approximated by a straight line with a slope of − 8.1 dB/oct. A similar straight line (slope of − 8.6 dB/oct) describes the open-bulla stapes displacements at frequencies above the low-frequency plateau, which, in this case, is confined to frequencies at or below 100 Hz.
FIG. 10.
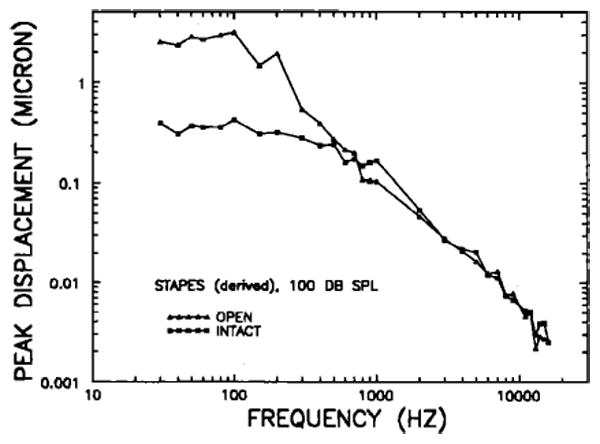
Stapes displacement at 100 dB SPL in intact bullas (squares) and open bullas (triangles). The curves for intact and open bullas have been derived from the malleus measurements in intact and open middle ears, respectively (Figs. 3 and 5) and from differences between stapes and malleus responses in three middle ears with open bullas, slit tympanic membrane and severed tensor-tympani tendon.
An intact-bulla stapes-displacement phase-versus-frequency curve (Fig. 11) was derived from the intact-bulla manubrium mallei phase curve (Fig. 4) by adding to the latter a smoothed version of the stapes re: malleus phase curve measured in three open-bulla middle ears with slit tympanic membrane and severed tensor tympani tendon. In general, intact-bulla stapes displacements progressively lag pressure at the eardrum as frequency increases: by less than 30 degrees below 100 Hz, 90 deg at 1 kHz, 180 deg near 5 kHz, 270 deg at 10 kHz, and 360 deg at 13 kHz.
FIG. 11.
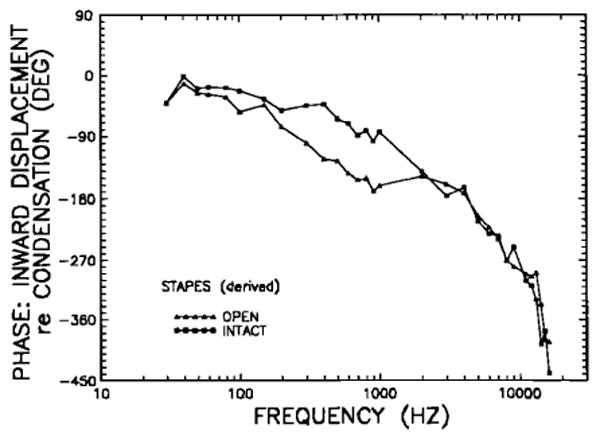
The phases of inward stapes displacement in the intact chinchilla middle ear, relative to condensation near the eardrum. The stapes curves for open (triangles) and intact (squares) middle ears have been derived from the malleus phases in open and intact middle ears, respectively (Figs. 4 and 6), according to the difference in response phases between stapes and malleus in open-bulla middle ears with slit tympanic membrane and severed tensor-tympani tendon.
III. Discussion
A. Effect of opening the bulla upon middle-ear transmission
It has long been recognized (e.g., Békésy, 1936; Stevens and Davis, 1938, pp. 261–262; Wever and Lawrence, 1954; Zwislocki, 1963) that the volume of air enclosed within the middle-ear cavity provides an acoustic compliance that can dominate the response of the middle-ear ossicles at low frequencies. The extent to which this occurs depends on the relative impedance of the middle-ear cavity due to its acoustic compliance, on the one hand, and the combined impedance of the tympanic membrane, the ossicular chain, and the cochlea, on the other. Measurements of ossicular motion with open and intact bullas allow estimation of the respective contributions of these two factors in determining both the overall input impedance measurable in front of the eardrum and the magnitude of vibration of the ossicular chain.
As shown in Fig. 5, the major effect of opening the bulla in the chinchilla is to uniformly boost (by about 16 dB) the magnitude of the ossicular responses at stimulus frequencies below 100 Hz. At higher frequencies, responses are increased to a lesser extent, with the effect becoming negligible above 700 Hz. Three studies, based on recordings of cochlear microphonics (CM) in the chinchilla, have presented comparable results. Dallos (1970) showed, in a single animal, a response increment of some 20 dB at very low frequencies, diminishing to some 6 dB at 1 kHz. Teas and Nielsen (1975) measured a sensitivity increase of 14 dB at 300 Hz, with negligible effects above 1 kHz. Drescher and Eldredge (1974) found a uniform boost of 15 dB at frequencies below 300 Hz, diminishing up to 700 Hz. Results of these and other studies of the effects of opening the bulla in cats, guinea pigs, and chinchillas are summarized in Table I. For both chinchillas and guinea pigs, opening the bulla provides a 15- to 20-dB boost at low frequencies, with diminishing effects at higher frequencies. The magnitude of the effect of opening the bulla in chinchilla and guinea pig indicates that the combined tympanic-membrane, ossicular, and cochlear impedance at low frequencies is much less than the acoustic impedance of the middle-ear cavity by itself. The situation is somewhat different in cats, in which the effect of opening the bulla has been measured to be only about 5 dB or less at low frequencies (Table I).
Table I.
Effect of opening the bulla on low-frequency middle-ear transmission.
| N | Method | Maximum low-freq. boost (dB) | Frequency above which boost disappears | |
|---|---|---|---|---|
| Cat | ||||
| Buunen and Vlaming, 1981 | 3 | laser interf. | 4–8 | 1kHz |
| Dallos, 1970 | 1 | CM | 4 | 1kHz |
| Guinan and Peake, 1967 | 8 | CM | 5 | 1kHz |
| Lynch, 1981 | 5–6 | impedance | 5 | >3kHz |
| Moller, 1963 | 1 | impedance | 7 | 1.5 kHz |
| Wever et al., 1948 | 1 | CM | 2–5 | 1.5 kHz |
| Wilson and Johnstone, 1975 | 1 | CM | 6 | ? |
| Guinea pig | ||||
| Dallos, 1970 | 1 | CM | 22 | (> 1 kHz) |
| Drescherand Eldredge, 1974 | 3–5 | CM | 15 | 2 kHz |
| Franke and Dancer, 1983 | 5 | CM | 17 | 1.5 kHz |
| Nuttall, 1975 | 4–9 | forced vibration, CM | 20 | 2 kHz |
| Teas and Nielsen, 1975 | 7 | CM | 20 | 2 kHz |
| Wilson and Johnstone, 1975 | 1 | CM | 15 | 2 kHz |
| Chinchilla | ||||
| Dallos, 1970 | 1 | CM | 20 | (> 1 kHz) |
| Drescher and Eldredge, 1974 | 3–5 | CM | 15 | 0.7 kHz |
| Ruggero et al., 1990 | 5–11 | Mössbauer | 16 | 0.7 kHz |
| Teas and Nielsen, 1975 | 7–9 | CM | >14 | 0.7–1 kHz |
Equations that relate stapes displacement per unit pressure at low frequencies to the volume of the middle ear are listed below:
| (1) |
| (2) |
| (3) |
where
Zac = the complex middle-ear input impedance due exclusively to the acoustic compliance of air trapped in the middle ear cavity;
j =
ρa = resting density of air (1.2 × 10 −3 g/cm3);
c = velocity of sound in air (3.44 × 105 cm/s);
f = frequency;
υ = total volume of middle-ear cavities;
Z = the total (complex) middle-ear input impedance;
R = the complex ratio of cochlear or middle-ear response with intact bulla relative to the response with open bulla;
d/p = the complex ratio of stapes displacement relative to pressure near the tympanic membrane;
Aeff = effective area of eardrum: the volume velocity of the tympanic membrane divided by the velocity of the manubrium mallei's tip;
L = effective lever ratio: the response ratio of the manubrium mallei's tip relative to the incus tip or stapes.
For a given species, knowledge of the volume of the middle-ear cavity permits computation of the theoretical acoustic input impedance at the eardrum due solely to the compliance of the trapped air in the middle ear [Zac, Eq. (1)]. The total input impedance (Z), due to both the trapped air volume and the impedance of the tympanic membrane, the ossicular chain and the cochlea, may then be computed from R, the intact re: open-bulla sensitivity ratio of ossicular motion or cochlear microphonic responses [Eq. (2)]. Finally, Eq. (3) permits computation of low-frequency stapes displacement from the total middle-ear input impedance on the assumption, generally supported by observations, that the lever ratio and the effective area of the eardrum are both constants at low frequencies (Guinan and Peake, 1967). We have (arbitrarily) presumed the effective eardrum area to be 2/3 of the area enclosed by the tympanic ring (Wever and Lawrence, 1954). The computed low-frequency stapes displacements per unit pressure for cats, guinea pigs, and chinchillas are listed in Table II and indicated in Fig. 12, for comparison with actually measured stapes displacement responses.
Table II.
Theoretical intact-bulla low-frequency stapes displacement per unit pressure for cat, guinea pig, and chinchilla. Stapes displacement was computed using Eqs. (1)–(3). The “effective” tympanic-membrane areas were taken to be 2/3 of the listed (anatomical) areas. The second stapes displacement value for the guinea pig and the second and third values for the chinchilla were computed using averages of the two areas listed, in each case, for guinea pig and chinchilla (effective areas of 0.19 and 0.35 cm2, respectively). Lever ratios used for cat, guinea pig, and chinchilla were 2, 2, and 2.38, respectively.
| Middle-ear volume(cm3) | Tympanic membrane area(cm2) | Stapes displacement per unit pressure(10−6 cm/dyn) | |
|---|---|---|---|
| Cat | |||
| Lynch, 1981 | 0.89 | ||
| Wever et al., 1948 | 0.42 | 0.51 | |
| Guinea pig | |||
| Mundie, 1963 | 0.25 | 0.25 | 0.45 |
| Teas and Nielsen, 1975 | 0.20 | 0.32 | |
| Wilson and Johnstone, 1975 | 0.31 | 0.32 | 0.44 |
| Chinchilla | |||
| von Bismarck, 1967 | 1.2 | 0.50 | 0.90 |
| Drescher and Eldredge, 1974 | 2.2 | 1.56 | |
| Teas and Nielsen, 1975 | 2.8 | 1.98 | |
| Vrettakos et al., 1988 | 1.5 | 0.56 | 1.00 |
B. Chinchilla middle-ear response compared to guinea pig and cat
We shall compare our measurements of chinchilla ossicular vibrations with their counterparts in cats and guinea pigs because of the abundance of data available for these two species. These data have been obtained using a variety of methods, including Mössbauer spectroscopy, laser interferometry, optical observations, and forced mechanical vibrations coupled to cochlear microphonic recordings. Table III and Figs. 12 and 13 provide a survey of results from seven such studies for the cat, nine studies for the guinea pig, and the present results for the chinchilla, all expressed in terms of stapes displacement per unit pressure as a function of sinusoidal stimulus frequency. In some cases, stapes displacements were derived from malleus-displacement data on the assumption that the effective lever ratio is 2 in cats and guinea pigs.
All displacement-sensitivity curves for intact bullas [Fig. 12(a) and (b)] have a relatively flat low-frequency segment that extends from the lowest frequencies up to 1–2 kHz. Such flat displacement segments correspond to + 6-dB/oct slopes for velocity-sensitivity curves, as expected when the middle-ear input impedance is dominated (at low frequencies) by the acoustic compliance of the air enclosed by the middle-ear cavities. The magnitude of vibration of chinchilla ossicular response to low-frequency sounds substantially exceeds (by approximately 10 dB) that of cats; chinchilla ossicular vibration probably also exceeds responses in guinea pig, although a conclusive statement is precluded by the large variability of results for the guinea pig. To the extent that the middle-ear response at these frequencies is controlled by the acoustic compliance of the air within the bulla, it is not surprising that the middle ear's low-frequency response is larger in the chinchilla than in the cat or guinea pig, since the volume of the chinchilla bulla cavity exceeds that of the cat and guinea pig, respectively, by factors of 1.35–3.15 and 3.87–14 (Table II).
At low frequencies, chinchilla displacement measurements are bracketed by the range of theoretical values based on bulla volume (Table II), which were computed using our functional assessment of lever ratio (2.38). For the cat, the predicted low-frequency stapes sensitivity somewhat exceeds the measured values in Fig. 12(a): Predicted sensitivity is about 0.5 × 10⁻⁶ cm3/dyn and measured values range from 0.2–0.4 × 10⁻⁶ cm3/dyn. This is consistent with results of Lynch (1981), who correlated measurements of middle-ear volume and input impedance in individual cats and found that the latter tended to overestimate bulla volume by a small constant amount. In the case of the guinea pig, it is difficult to reach a conclusion regarding the adequacy of the theoretical low-frequency calculation because of substantial inconsistency among results from different studies [Fig. 12(b)]. At 1000 Hz, middle-ear sensitivities encompass a range of almost 24 dB. At lower frequencies, the sensitivity range is smaller but still substantial (about 15 dB), with the values in the upper margin of the range (Nuttall, 1974; Wilson and Johnstone, 1975) approaching those in chinchillas.
Turning now to the high-frequency stapes responses in the intact bulla, it appears that chinchilla responses tend to fall among the more sensitive responses in cat, but are invariably lower than stapes responses in guinea pigs. As already noted, the high-frequency responses in chinchillas, when expressed as displacement per unit pressure, decay at a rate of 8.4 dB/oct, with little difference between results for open or intact bullas. The high-frequency responses for cat may be described as following, at least roughly, the same slope. In contrast, the high-frequency responses are larger in guinea pigs than in the other two species, and the response slopes appear to be shallower; again, the responses in guinea pig are highly variable in comparison to those in cat. Perhaps significantly, the only experimental series from a single laboratory that measured stapes vibration in both cats and guinea pigs (Johnstone and Taylor, 1971; see also Johnstone and Sellick, 1972) indicated that middle ear ossicles vibrate with somewhat larger magnitudes in guinea pigs than in cats, and that guinea pig responses decay at a lower rate as a function of frequency.
In the case of middle ears with open bullas [Fig. 13(a) and (b)] the most striking contrast is between the low-frequency responses of chinchilla and cat. At these frequencies, chinchilla measurements exceed the stapes responses of cats by 30 dB or more. This indicates that, at low frequencies (< 300 Hz), the combined impedance of the tympanic membrane,the ossicular chain, and the cochlea is larger in cats than in chinchillas. Guinea pig open-bulla middle - ear responses appear to be segragated into two groups: the measurements of Nuttall (1974) and Wilson and Johnstone (1975) are substantially larger (by 15 or 20 dB) than three other measurements in the same species [Fig 13(b)]. At low frequencies, chinchilla stapes responses equal the largest measured in the guinea pigs. At high frequencies, the chinchilla stapes sensitivity is similar in both absolute magnitude and rate of the decay to results for cats and the majority of results for guinea pigs. It would seem that the guinea pig data of Figs. 12(b) and 13(b) are not fully compatible, since the responses differ of opening the bulla should be confined to low frequencies.
C. Cochlear input impedence in the chinchilla
Cochlear input impedence — pressure in scala vestibuli(SV) near the oval window divided by stapes volume velocity— has been measured directly in cats (Lynch et al., 1982), but not in chinchilla. Nevertheless, it is possible to estimate cochlear input impedence for the chinchilla on the basis of our stapes velocity measurments (Fig.8), first-turn SV pressure measurements of Décory et al. (1989), and stapes footplate area measurements of Vrettakos et al. (1988). The magnitudes of the velocity and pressure measurements are presented in Fig. 14 as a function of frequency. The SV pressure measurements are expressed in terms of decibels re: pressure at the eardrum, but the scale applies arbitrarily to the velocity data. Comparison of the two curves shows similar dependence on stimulus frequency over the range 400–16000 Hz, while, at low frequencies, pressure diminishes faster than velocity as frequency decreases.
FIG. 14.
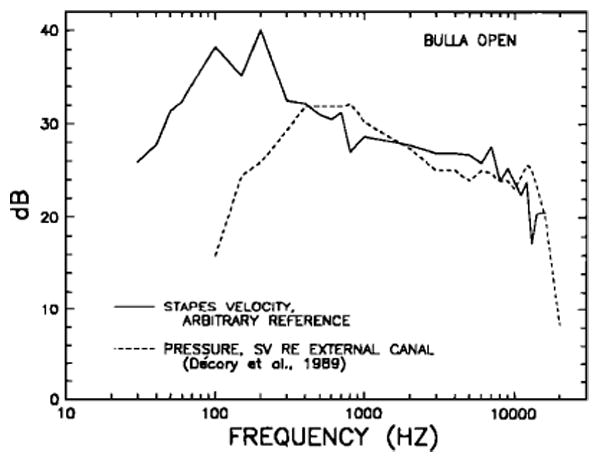
Comparison in the chinchilla open middle ear of peak stapes velocity and peak pressure in scala vestibuli, both as a function of frequency. The latter measurements (dashed line) were carried out by Décory et al. (1989) and are referred to pressure near the eardrum. The stapes velocity data (continuous line) are those of Fig. 8 (derived for middle ears with intact tympanic membrane and middle-ear muscles); the stapes velocities are referred to an arbitrary reference.
Figure 15 depicts the magnitude of the cochlear input impedance (smoothed using a three-point running average) computed by division of rms pressure in SV (Fig. 14) by rms stapes volume velocity, both at the same stimulus level; stapes volume velocity was obtained by multiplying rms stapes velocity (derived from the peak velocity data of Fig. 8, wide-dash line) by the stapes footplate area (2 mm2). To a first approximation, the cochlear acoustic input impedance of the chinchilla appears to be relatively constant in the range 400–16000 Hz, hovering within 3 dB of 0.65 MΩ (c.g.s., dyn·s/cm5). For comparison, also shown in Fig. 15 are the direct measurements of Lynch et al. (1982) for the cat and an estimate by Dancer and Franke (1980) for the guinea pig. [Other, less direct, estimations of cat cochlear input impedance have been published that differ from each other by as much as 20 dB (Tonndorf et al., 1966; Nedzelnitsky, 1980). The Lynch et al. (1982) data, which are probably the most reliable (because both stapes velocity and SV pressure were measured in individual animals), have values intermediate between the other two sets of measurements.] The curves for cat and chinchilla are similar in that the impedance magnitude is an increasing function of frequency below 500 Hz and is relatively constant at higher frequencies. The cat input impedance, however, exceeds that of the chinchilla over the entire frequency range; the difference amounts to 5–13 dB over the range 400–5000 Hz, and grows larger at lower frequencies.
FIG. 15.
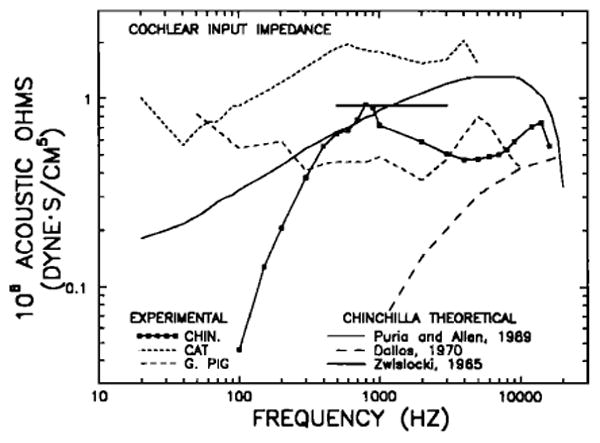
Magnitude of experimental and theoretical estimates of cochlear input impedance, as a function of frequency, for the chinchilla, guinea pig, and cat. The experimental cochlear input impedance for the chinchilla has been computed on the basis of rms stapes velocity (derived from Fig. 8, wide-dash line), rms pressure in scala vestibuli (Fig. 14) and the area of the stapes footplate (2 mm2, Vrettakos et al., 1989); the squares and continuous line indicate the cochlear input impedance after smoothing by means of a three-point running average. The experimental estimates for cat and guinea pig are from Lynch et al. (1982) and Dancer and Franke (1980), respectively. Also shown are theoretical estimates by Puria and Allen (1989, continuous line) and Dallos (1970, long-dash line) of the chinchilla cochlear input impedance, as well as a midfrequency estimate of impedance for a site of the chinchilla cochlea located 3.5 mm from the stapes, according to Zwislocki's (1965) theory (thick flat line; see Table IV).
The input impedance curve for the guinea pig was derived by Dancer and Franke (1980) on the basis of their SV pressure measurements, stapes velocity data of Dancer et al. (1980), and a stapes footplate area measurement of Fernández (1952). Atmost frequencies, the guinea pig curve hovers around a value of 0.45 MΩ, i.e., somewhat lower than in the chinchilla at middle frequencies. At the lowest frequencies, the curves for the guinea pig and chinchilla diverge sharply: In contrast with the chinchilla, in which the input impedance diminishes as frequency is lowered, in the guinea pig, input impedance remains relatively high. At 100 Hz, the input impedance in the guinea pig exceeds that in the chinchilla by 21 dB.
Figure 16 presents a comparison of the phases corresponding to the pressure and velocity magnitudes of Fig. 14. In the frequency range 150–10000 Hz, there is a fairly similar dependence of phase on frequency for both curves. The differences (pressure phase minus velocity phase) are depicted in Fig. 17 after smoothing with a three-point running average. Over the range 200–7000 Hz, SV pressure leads stapes velocity by a relatively constant value that fluctuates around + 35 deg (± 15). For comparison with the chinchilla curve, also shown in Fig. 17 is the phase part of the cochlear input impedance measured by Lynch et al. (1982) in cats. In the midfrequency range, the cat phase curve lies close to zero, systematically decreasing toward a 90-deg lag at very low frequencies (20 Hz).
FIG. 16.
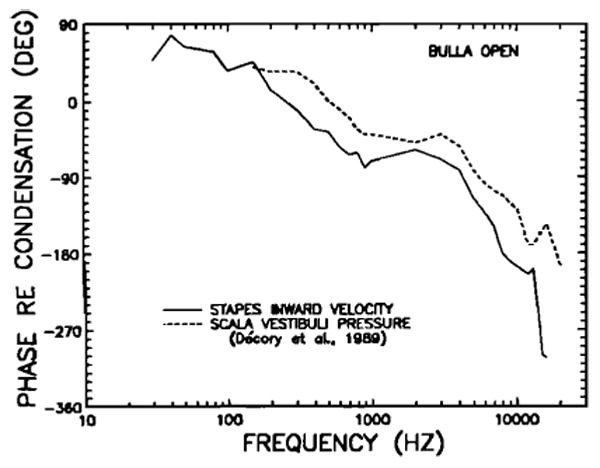
Comparison in the chinchilla open middle ear of the phase of inward stapes velocity and the phase of pressure in scala vestibuli, both referred to condensation at the eardrum. The latter measurements were obtained by Décory et al. (1989); the stapes phase data are those of Fig. 9 (derived for middle ears with intact tympanic membrane and middle-ear muscles).
FIG. 17.
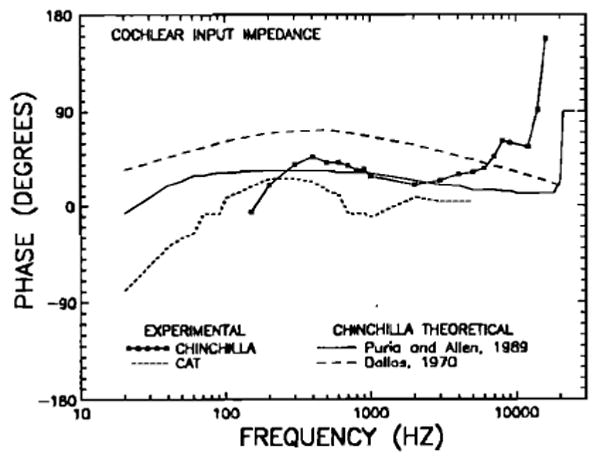
Phases of experimental and theoretical estimates of cochlear input impedance re: condensation at the eardrum, as a function of frequency, for the chinchilla and the cat. The experimental phases of the chinchilla cochlear input impedance have been computed on the basis of stapes-velocity phase (Figs. 9 and 16) and scala vestibuli pressure phase (Fig. 16); the squares and continuous line indicate these phases after smoothing by means of a three-point running average. The curve for the cat (short-dash line) was derived by Lynch et al. (1982). Theoretical phase curves for the chinchilla are from Dallos (1970, long-dash line) and Puria and Allen (1989, continuous line).
Two theoretical models have provided quantitative estimates for the frequency dependence of the cochlear input impedance in the chinchilla: Dallos (1970) and Puria and Allen (1989). The magnitudes and phases of these impedance estimates are plotted in Figs. 15 and 17, respectively. It is clear that Dallos' model predicts impedance magnitudes that differ substantially from experimental results except at the highest frequencies (Fig. 15). The model of Puria and Allen (1989), on the other hand, matches the experimentally derived curves in some respects: Its magnitude part has values close to the experimental curve in the range 300–1000 Hz and at the highest frequencies (Fig. 15) and the phase part lies close to the experimental values in the range 300–6000 Hz (Fig. 17). At frequencies below 300 Hz and at 2–12 kHz, however, the magnitudes of the theoretical curve substantially exceed those of the experimental curve (Fig. 15). At low frequencies, the theoretical phase curve remains relatively constant over a much wider frequency range than do the experimental values (Fig. 17). It should be noted that the theoretical analysis did not take into account the effects of the round window; inclusion of such effects probably would bring the theoretical phase values closer to the experimental results at low frequencies.
Our derived values for the cochlear input impedance of the chinchilla may be also compared to Zwislocki's (1965) model, which, although not explicitly designed to account for chinchilla data, was formulated in a manner that readily permits computation of cochlear impedance as a function of distance from the stapes on the basis of estimates of the partition compliance and the cross-sectional areas of the cochlear scalae. This model is one of several (see discussion by Lynch et al., 1982) which predict that, over some (wide) frequency range (from, say, a few hundred Hz to several kHz), the impedance across the partition (i.e., pressure difference across the partition divided by volume velocity) should be resistive and constant (see discussion by Lynch et al., 1982). To the extent that pressure in scala vestibuli substantially exceeds pressure in scala tympani, as is the case for the chinchilla in the frequency range 500–2000 Hz (Décory et al., 1989), the cochlear input impedance should be nearly identical to the impedance across the partition at locations close to the stapes (Lynch et al., 1982; Nedzelnitsky, 1980). Our estimate of cochlear input impedance does not unambiguously support Zwislocki's model: In the midfrequency range, where a phase of zero is predicted theoretically, the experimental phases actually hover between +20 and +50 deg, suggesting that cochlear input impedance is actually intermediate between being resistive (as the Zwislocki model posits) and being inertance dominated. Nevertheless, since the magnitude part of the experimentally derived cochlear input impedance is, to a first approximation, constant at midfrequencies (as predicted by the model), it is instructive to quantitatively compare the model's magnitude prediction with the experimental values. According to the Zwislocki (1965) model:
| (4) |
| (5) |
where
Z(x) = impedance of cochlea at x cm from stapes;
ρp = density of perilymph (about 1 g/cm3);
SSV(x) = cross-sectional area of scala vestibuli at x cm from stapes;
SST(x) = cross-sectional area of scala tympani at x cm from stapes;
C(x) = basilar membrane compliance per unit length at x cm from stapes.
From previously presented chinchilla basilar membrane (BM) displacement measurements (Ruggero et al., 1986c) and from the first-turn pressure measurements of Décory et al. (1989), it is possible to derive the volume compliance of the cochlear partition for a site 3.5 mm (or 20%) from the base. From Fig. 3 of Ruggero et al. (1986c), the 1-kHz BM response amounts to 7.2 × 10⁻⁷ cm3/dyn. The pressure difference across the first turn of the cochlear base was measured by Décory et al. (1989) to represent a gain of × 26.7 re: pressure at the eardrum. Thus, the compliance across the partition is (7.2×10⁻⁷ cm3/dyn)/26.7 = 27–10−9 cm3/dyn. To convert to acoustic compliance per unit length, it is necessary to multiply the volume compliance by the effective width of the BM. According to Bohne and Carr (1979, Fig. 4), at 20% distance from the base, the BM width is 260 μm. Assuming that the effective BM width is 1/2 of the anatomical width, C(0.35 cm), the acoustic compliance per unit length for the 0.35-cm BM site, is 27×10−9 cm3/dyn×0.013 cm = 3.5×10⁻¹⁰ cm/dyn. For the chinchilla cochlea SSV (0.35 cm) is 0.0046 cm2 (Dallos, 1970, Fig. 10). On the basis of measurements of Fernández (1952) for the guinea pig, which show a ratio of SST (0.35 cm)/SSV (0.35 cm) equal to 3, using Eq. (5) we estimate that in the chinchilla S(0.35 cm) equals 0.0034 cm2. Using Eq. (4), Z(0.35 cm) = 0.9 ×10⁶ dyn·s/cm5.
This theoretical estimate of cochlear impedance at the base of the chinchilla cochlea comes very close (within 2 dB) to the 1-kHz cochlear input impedance (i.e., impedance at x= 0 cm) that we derived above (Fig. 15) from pressure and velocity data for the chinchilla. Table IV shows similar computations at 1 or 1.5 kHz based on BM data from several studies on live cats and guinea pigs, as well as chinchillas. Also included are two impedance estimates derived from measurements of static BM stiffness in dead guinea pigs (Gummer et al., 1981; Miller, 1985).2 Given the variability in the experimental data and the uncertainty in the derivation of S, the cochlear cross-sectional area parameter, the match between experimental and theoretical values for the cat is good and appears to support the validity of the assumptions on which Eq. (4) was based. For the guinea pig, however, the predicted values of cochlear impedance are larger than the measurements of Dancer and Franke (1980) by 8–15 dB.
Table IV.
Comparison of Zwislocki's (1965) theoretical prediction of cochlear impedance at middle frequencies, with input impedance data for basal locations of cochleas of cat, guinea pig, and chinchilla. The last column lists experimental determinations of cochlear input impedance. The column immediately to its left presents predictions of cochlear impedance computed using Eqs. (4) and (5) (Zwislocki, 1965). The theoretical predictions are based on either BM responses to acoustic stimuli in live animals (second column) or static BM stiffness measurements in dead guinea pigs [Gummer et al., 1981, Eq. (28); Miller, 1985, her Table I]. The S is related to the cross-sectional area of scala vestibuli (SSV) and scala tympani (SST) according to Eq. (5). Fernández (1952) gives measurements for both SSV and 5ST in guinea pigs as a function of cochlear location. For cats and chinchillas, only measurements of SSV are available (Dallos, 1970).SST for the cat has been (somewhat arbitrarily) presumed to be 2.5 × SSV both at the 0.6-cm location (as suggested by Lynch et al., 1982) and at the 0.3-cm location. For the chinchilla, S(0.35 cm) was computed on the assumption that, as in the guinea pig (Fernández, 1952), SST (0.35 cm) = 3 × SSV (0.35 cm). The effective BM width was taken to be 1/2 of the listed (anatomical) width, for the cat, from Cabezudo(1978); for the chinchilla, from Bohne and Carr (1979); for the guinea pig, except as noted, from Fernández (1952). The BM width from Gummer et al. (1981) and Miller (1985) are means from Table I of each of their papers.
| Species (x = cm from stapes) | BM displacement/unit pressure at TM (10−7 cm3/dyn) | Pressure difference gain re: TM | BM compliance 10−9 cm3/dyn) | BM width (cm) | BM compliance/unit length 10−10 cm4/dyn) | S Eq. (5) cm2 | Input impedance (106dlyn s/cm5) | |
|---|---|---|---|---|---|---|---|---|
| Predicted | Experimental (x = 0) | |||||||
| Cat | 0.707 | 3.3 | ||||||
| (0.6) | Evans and Wilson, 1975(mean of 2 measurements, Figs. 1 & 2) | 3.6 | 0.02 | 0.36 | 0.005 | 2.4 | Tonndorf et al.(1966) | |
| 19.8 Nedzel- nitsky(1980) | 1.8 Lynch et al. (1982) | |||||||
| (0.3) | 0.445 Khanna and Leonard, 1986, Tab. II(mean of 14 measurements) | 2.2 | 0.016 | 0.18 | 0.008 | 2.6 | 0.8 Nedzelnitsky(1980) | |
|
| ||||||||
| Guinea pig(0.2) | 1.25 Wilson and Johnstone1975, Fig. 7b | 5.8 | 0.015 | 0.44 | 0.006 | 1.9 | ||
| 21.4 Dancer and Franke (1980) | 0.5 Dancer and Franke (1980) | |||||||
| (0.34) | 1.71 Sellick et al. 1982, Fig. 10 | 8.0 | 0.016 | 0.64 | 0.003 | 2.3 | ||
| (0.15) | 9.7 | 0.017 | 0.82 | 0.007 | 1.3 | |||
| (0.16) | Gummer et al. (1981) 2.7 Miller (1985) | Gummer et al. (1981) 0.014Miller (1985) | 0.19 | 0.007 | 2.7 | |||
|
| ||||||||
| Chinchilla | 0.71 | |||||||
| (0.35) | 26.7 | Ruggero et al. (1990) and Décory et al. (1989) | ||||||
| 7.23 Ruggero et al. 1986c, Fig. 3 | Décory et al. (1989) | 27.1 | 0.026 | 3.52 | 0.0034 | 0.91 | ||
D. Transfer function of a basal location of the chinchilla basilar membrane
We have previously presented frequency-response data for the chinchilla basilar membrane (BM) at a site some 3.5 mm from its basal end (Robles et al., 1986; Ruggero et al. 1986c,d). These BM data, collected with widely opened bullas, were presented in the form of isoresponse- (peak velocity or displacement) and phase-versus-frequency plots referred to sound pressure in the external ear canal, near the tym panic membrane. The present middle-ear measurements permit relating the BM data to the input to the cochlea, namely, motion of the stapes. Figure 18 shows a comparison between a mean BM isovelocity tuning curve, derived from five cochleas in good physiological state, and a mean stapes isovelocity curve derived from the stapes data of Fig. 8 (wide-dash line). The velocity used in this comparison (0.1 mm/s) is close to the lowest that can be measured reliably with the Mössbauer methodology.
FIG. 18.
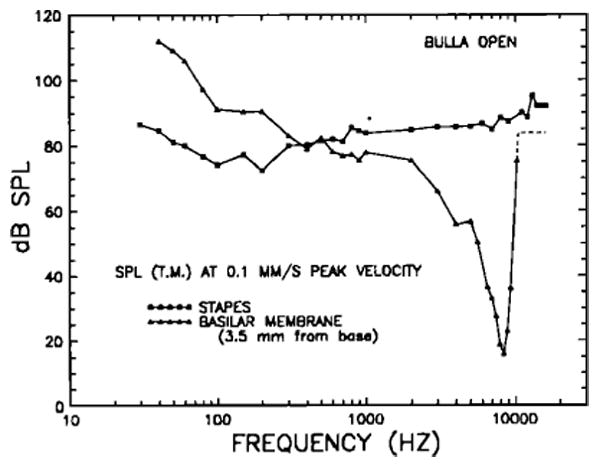
Mean isovelocity frequency-response curves for the stapes and for a basilar membrane site 3.5 mm from its basal end. The ordinate indicates the stimulus SPL at the tympanic membrane required to elicit 0.1 -mm/s responses. Both sets of data were obtained in chinchilla ears with open bullas. The BM data are means for five sensitive preparations and have been previously described in detail (Robles et al., 1986,; Ruggero et al., 1986c,d). Above 10 kHz, the BM response appears to reach a plateau (dashed line).
At 3.5 mm from its basal end, the BM of the chinchilla is sharply tuned to a frequency [characteristic frequency (CF)] of about 8.4 kHz (Robles et al., 1986). At this frequency, the tuning curve is very sensitive, reaching a peak velocity of 0.1 mm/s (displacement of 19 Å) at 16 dB SPL. Its high-frequency slope exceeds 300 dB/oct near the CF, but it seems to reach a shallow plateau above 10 kHz, at levels close to those of the stapes isovelocity curve. The low-frequency isovelocity slope is very steep near CF (although less so than the high-frequency slope), but becomes much shallower below 2 kHz (— 4.8 dB/oct between 100 Hz and 1 kHz). Below 100 Hz, the isovelocity slope (— 16.2 dB/oct) is steeper than at intermediate frequencies. By comparison, the stapes curve is insensitive and essentially untuned.
Figure 19 shows the gain of BM motion relative to stapes motion (obtained as the ratio between BM and stapes velocity responses; Fig. 18). At CF, BM motion exceeds that of the stapes by more than 70 dB. The high-frequency plateau level slightly exceeds the magnitude of stapes vibration. Below 400 Hz, stapes motion is greater than that of the BM. Included for comparison are a long-dash straight line with a slope of + 6 dB/oct and a short-dash straight line with a slope of + 12 dB/oct. It appears that, in the frequency range 300–3000 Hz, the BM gain relative to the stapes grows linearly as a function of frequency or, equivalently, that, in this range, the BM displacement is proportional to stapes velocity. The actual slope of the BM re: stapes gain, in the frequency range 300–3000 Hz, is 5.9 dB/oct. At lower frequencies (below 150 Hz), the gain curve is better approximated by a slope of + 12 dB/oct, suggesting that the BM displacement in this frequency region is proportional to the second derivative of stapes displacement (i.e., stapes acceleration). The actual BM re: stapes slope between 50 and 100 Hz is 11.4 dB/oct; between 40 and 100 Hz, the slope is 8.6 dB/oct.
FIG. 19.
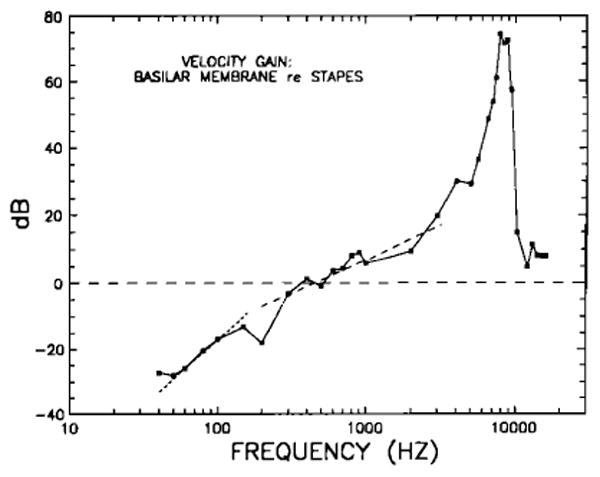
Basilar membrane gain-versus-frequency curve relative to stapes motion, for a chinchilla cochlear site 3.5 mm from the stapes. This curve represents the dB difference between the (0.1-mm/s isovelocity) BM and stapes curves of Fig. 18. Also shown for comparison are lines with slopes of + 12 dB/oct (short-dash line) and + 6 dB/oct (long-dash line).
Because the BM responds linearly at low frequencies, it is reasonable to ask whether the slopes of its gain re: stapes function at low frequencies are correlated with appropriate phases. In particular, it might be expected that a slope of + 5.9 dB/oct (i.e., close to + 6 dB/oct) should correspond to a lead of about 90 deg. Similarly, slopes of 8.6–11.4dB/oct should correspond to leads approaching 180 deg. Figures 20 and 21 indicate that these expectations are correct. Figure 20 permits a comparison of the response phases of stapes in ward displacement (same data as in Fig. 9, wide-dash line) and of BM data (peak displacement toward scala tympani), in each case relative to peak pressure at the eardrum (maximum condensation). The BM curve below 1 kHz presents the mean from measurements in 24 chinchillas. Above 1 kHz, the two curves were drawn to indicate the full range of variation in BM phase data near and above CF (see Figs. 12 and 13 of Robles et al., 1986). Figure 21 shows the phase of BM relative to stapes motion. There are several noteworthy features of the curves: (1) At frequencies of 100 Hz and below, the BM leads the stapes by a constant phase, which approximates 180 deg; (2) there is an abrupt phase change at 100-150 Hz, and, between 150 Hz and 1 kHz, the BM leads the stapes by a constant phase of about 90 deg; and (3) at frequencies above CF, phases reach constant lag values relative to the stapes, clustering close to either 2.3 or 3.3 periods. Constant high-frequency phase lags have been noticed in some previous BM studies (e.g., Rhode, 1971 and 1978; Wilson and Evans, 1983). When they occur, the phase plateaus appear to have lag values close to multiples of 1/4 period: 2.25 or 3.25 periods relative to the stapes in the chinchilla; 0.25, 1.25 or 2.25 periods relative to the incus in the cat (Wilson and Evans, 1983); and 3.5, 4.0, 4.25, or 4.5 periods relative to the malleus in the squirrel monkey (Rhode, 1971 and 1978). The significance of the high-frequency amplitude and phase plateaus—which may actually be a feature of damaged cochleas (see Gummer and Johnstone, 1984, p. 1399 and Robles et al., 1986, p. 1373)—is unknown.
FIG. 20.
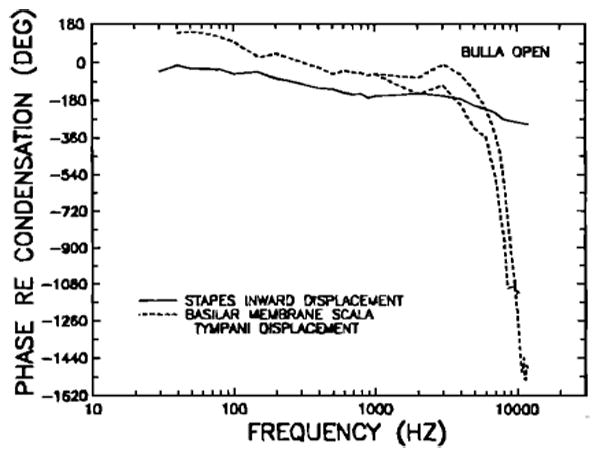
Phase-versus-frequency curves for stapes inward displacement (continuous line) and basilar membrane displacement toward scala tympani (dashed lines), relative to condensation near the eardrum. The basilar membrane curves indicate the extremes of interanimal variation, including phase-plateau values at frequencies above CF. Both sets of data were obtained with open bullas. The BM phase data have been previously described in detail (Robles et al., 1986; Ruggero et al, 1986c,d).
FIG. 21.
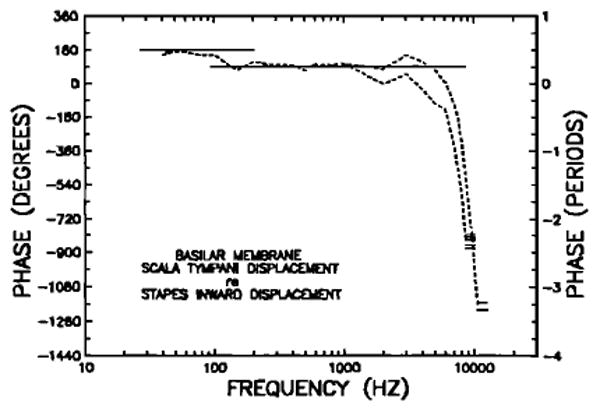
Phases of basilar membrane displacement toward scala tympani relative to stapes inward displacement. Continuous lines at the top indicate BM leads of 90 and 180 deg. The short horizontal lines indicate high-frequency phase plateaus of eight individual basilar membranes; note that they cluster near lags of either 2.3 or 3.3 periods.
The abrupt BM re; stapes phase transition at 100–150 Hz (Fig. 21) may be related to other transitions or irregularities that exist at similar frequencies in recordings of ear-canal pressure, ossicular responses, basilar membrane vibration, cochlear microphonics, and cochlear afferent responses in chinchillas. As shown in Fig. 8, in middle ears with open bulla, the malleus and stapes response magnitudes at 100 and 200 Hz on the average exceeded the response at 150 Hz by several decibels. Inflections corresponding to the phase transition are also evident, though less clearly than in Fig. 21, in the response magnitude of the malleus in middle ears with intact bulla (Fig. 2) and in the response phases (re: stimulus pressure at the eardrum) of cochlear microphonics, BM displacement or high-characteristic-frequency cochlear afferents (Fig. 23; see, also, Dallos, 1970). In addition, nonlinear, intensity-dependent phase changes have been noted in cochlear microphonics recorded from the round window (Ruggero et al., 1986b). Kim et al. (1980) measured a notch at 115 Hz in the pressure frequency response of the ear canals of live chinchillas, which disappeared after death. Relatively large harmonic distortion (up to − 22 dB relative to the stimulus) was detected at the same frequency. All of these findings suggest that some property of the cochlea is able to influence middle-ear and ear-canal responses to sound at a frequency that corresponds approximately to the apical extreme of the tonotopic map of the chinchilla BM (Eldredge et al., 1981). A related phenomenon may be the short magnitude plateau at 100 Hz that is often seen in cochlear microphonics recordings from guinea pigs (e.g., Dallos, 1970; Franke and Dancer, 1982 and 1983). Franke and Dancer (1982) suggested that this plateau results from the transition in the predominance of three factors that determine the pressure difference across the cochlear partition: a resistive helicotrema impedance at frequencies below the plateau (80 Hz), the BM compliance over the extent of the plateau, and the resistive cochlear impedance at frequencies above the plateau (130 Hz).
FIG. 23.
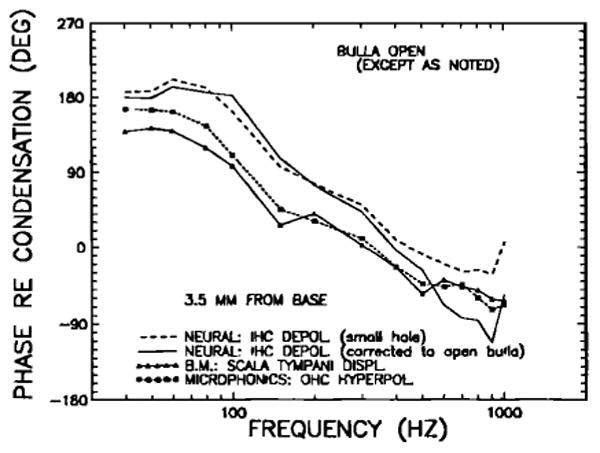
A comparison of chinchilla low-frequency response phases of basal cochlear afferents at near-threshold levels, of the basilar membrane at a site 3.5 mm from the base, and of the hyperpolarization of basal outer hair cells (OHCs). The neural-response phases, expressed as inner hair cell (IHC) depolarization, are shown both as originally measured with bullas vented via a single small hole (dashed line, no symbols; Fig. 5 of Ruggero et al., 1986c) and after correction to the open-bulla condition (continuous line, no symbols) by means of the phase data of Fig. 6. Microphonic recordings (used to infer OHC responses) and basilar membrane data were collected with open bullas. All measurements are referred to peak condensation near the eardrum. Noteworthy are: (1) the close match of outer hair cell hyper polarization and BM peak displacement toward scala tympani; (2) the 180-deg lead/lag at very low frequencies of BM displacement toward ST, relative to maximal inward stapes displacement (in contrast with the 90-deg lead found in guinea pigs, e.g., Johnstone and Taylor, 1970; Wilson and Johnstone, 1975);and (3) the moderate lead at frequencies below 500 Hz of IHC depolarization (derived from neural responses) relative to BM ST displacement.
As a conclusion of their minimum-phase analysis of von Békésy's (1947 and 1960) BM data, Flanagan and Bird (1962) argued that, at very low frequencies, BM displacement phases should asymptote to a 90-deg lead relative to stapes displacement, rather than being in phase with it, as indicated by von Békésy's measurements (Fig. 11-57 in von Békésy, 1960). This conclusion was consistent with other theoretical analyses, such as Zwislocki's (1965), which suggested that, at least at midfrequencies, cochlear impedance is resistive and constant: To the extent that this also holds at low frequencies, and to the extent that BM displacement is proportional to the pressure difference across the partition, then BM displacement at low frequencies should be proportional to, and in phase with, stapes velocity. Subsequent BM vibration data from the guinea pig (Johnstone and Taylor, 1970; Wilson and Johnstone, 1975; Rhode, 1978; Sellick et al., 1983) and squirrel monkey (Rhode, 1971 and 1978) have supported the theoretical predictions.
In contrast to the situation in guinea pig, there is substantial evidence that, at low frequencies, BM displacement in the cat and the chinchilla is proportional to stapes acceleration. On the basis of cochlear microphonics measurements, Dallos (1970) first drew attention to the contrasting low-frequency BM behavior between cat and chinchilla, on the one hand, and guinea pig, on the other. The species distinction noted by Dallos has been strengthened by other microphonics and mechanical cochlear data in both cat and chinchilla. For the cat, microphonics data (Weiss et al., 1971) and pressure difference measurements (Nedzelnitsky, 1980), both referred to pressure at the eardrum, suggest BM displacements that must grow at low frequencies at the rate of + 12 dB/oct relative to stapes displacement, with phases that approach 180 deg at 20–40 Hz (Lynch et al., 1982; however, see Wilson and Evans, 1983). Similarly, for the chinchilla, our round-window microphonics data and BM data for a site 3.5 mm from the stapes (Fig. 23), measured relative to pressure at the eardrum, strongly imply a BM displacement response proportional to, and in phase with, stapes acceleration. This has now been confirmed, as is shown in Figs. 19 and 21.
It is as yet not clear which aspect of cochlear anatomy is responsible for the different low-frequency mechanical behavior among different species. Dallos (1970) noted that both the sizes and spatial gradients of the cochlear cross-sectional area and the helicotrema size in several species appeared to be well correlated with the mechanical low-frequency behavior inferred from his microphonics measurements; however, he considered the contribution of cross-sectional areas in causing differences in cochlear input impedance to be unimportant. As shown in Fig. 15, his model, which gives a determining role to the helicotrema, does a poor job of fitting the chinchilla input impedance. The model of Puria and Allen (1989), which takes explicit account of the tapering of the cross-sectional area of the cochlea, achieves a better fit to the chinchilla input impedance curve over limited midfrequency ranges.
E. The low-frequency response of chinchilla cochlear afferents in relation to basilar membrane motion
We have previously compared the magnitudes of the low frequency responses of basal cochlear afferents and of the BM (Ruggero et al., 1986c,d). Recordings from cochlear afferents were obtained in chinchillas whose bullas were vented via a single small hole, 1–2 mm in diameter (Ruggero and Rich, 1983 and 1987), while chinchilla BM vibrations were measured in ears with widely opened bullas (Robles et al., 1986; Ruggero et al., 1986c,d). We derived open-bulla neural responses on the assumption that the venting hole in the preparations used for neural recordings left the middle ears essentially closed. When these derived neural responses were compared with BM motion, it was concluded that, on average, neural frequency-response curves matched closely BM isodisplacement curves while markedly diverging from BM isovelocity curves (see Fig. 3 of Ruggero et al., 1986c and Fig. 3 of Ruggero et al., 1986d). The present investigation tends to weaken this conclusion. In particular, as shown in Figs. 5 and 6, single small (1–2 mm) holes such as those used in the bullas of chinchillas in which neural recordings were carried out lead to middle-ear low-frequency transmission that is more similar to that measured for open bullas than intact bullas (i.e., those vented via capillary tubing). Therefore, it is clear that the corrections used by Ruggero et al., (1986c,d) were inappropriate. Figure 22 is an updated version of Fig. 3 from Ruggero et al., (1986d). It reproduces the neural data both without correction and with a new correction based on the averaged measured difference between malleus vibration in open middle ears and in middle ears vented via a single 1- to 2-mm hole. Figure 22 also shows the average isodisplacement and isovelocity curves for the 8.4-kHz site of the chinchilla BM. It may be seen that the neural curve does not closely match either BM curve over the entire frequency range, although it does lie closer to the BM isodisplacement curve. At the lowest frequencies (30–100 Hz), the neural curve is 26 dB more sensitive than the isovelocity curve, but 15 dB less sensitive than the isodisplacement curve.
FIG. 22.
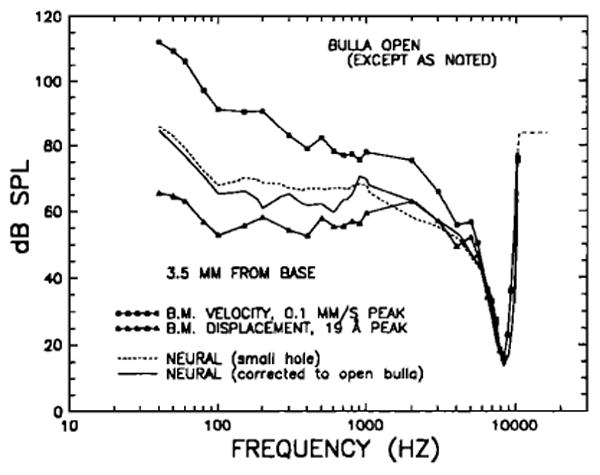
Basilar membrane isovelocity (squares) and isodisplacement (triangles) tuning curves for a site 3.5 mm from the cochlear base, compared with a mean cochlear-afferent rate-threshold tuning curve. The BM curves, which were collected with open bullas, are those presented by Ruggero et al. (1986d) in their Fig. 3 (see also Fig. 11 of Robles et al., 1986). The neural tuning curves (continuous and dashed lines) represent a synthesis based on recordings from 63 cochlear-afferent fibers innervating ears with bullas vented via single small (1–2 mm) holes (Ruggero et al., 1986d). The short-dash line indicates the “raw” neural data, as originally collected. The continuous line indicates the same data after correction for the difference in transmission in middle ears widely opened or vented via a single small hole (Fig. 5).
In interpreting the response phases of cochlear-afferent responses in relation to BM motion, we implicitly made the assumption that no correction was required to account for the differential effects of opening the bulla (Ruggero et al., 1986c,d). In retrospect, while the assumption was inconsistent with the presumed need for magnitude corrections (since, as shown in Fig. 7, there is a fairly strict minimum-phase correspondence between the magnitude part of the middle-ear frequency response and the corresponding phase-versus-frequency response), it was also fortunate because, as shown in Fig. 6, the single 1- to 2-mm venting holes yield middle-ear phase-versus-frequency curves that differ measurably from those of widely opened bullas only in a restricted frequency range (500–2000 Hz). Figure 23 is an updated version of Fig. 4 from Ruggero et al., (1986c), in which response phases of high-characteristic-frequency fibers are compared with basal BM vibrations and round-window cochlear microphonics in the frequency range 40–1000 Hz. In addition to a long-dash line, which reproduces the neural phase curve from the original figure, a continuous line (no symbols) indicates the neural response phases that might be expected from ears with open bullas, according to the results depicted in Fig. 6. We had previously concluded that spike excitation in response to low-frequency stimulation occurs at a time approximately corresponding to a 45-deg lead relative to maximal BM displacement toward scala tympani (Ruggero et al., 1986b,c,d; Ruggero and Rich, 1987). Figure 23 indicates that this conclusion still applies, at least for frequencies below 500 Hz; the 45-deg lead, however, disappears at frequencies above 400 Hz.
Acknowledgments
W. D. Ward, A. Dancer, R. Franke, L. Décory, and the two referees, J. C. Saunders and W. T. Peake, provided many valuable comments on the paper. John A. Costalupes helped to collect some of the data, Karen LeBeau typed part of the manuscript, and Charles Vale provided assistance with electronic instrumentation. We were supported by NSF Grant BNS-8304587 and NIH (NIDCD) Grants DC-00419 and DC-00110. We wish to recognize our special indebtedness to Bill Peake and his students and colleagues, whose thorough and clear papers are models for work on middle-ear mechanics.
Footnotes
Portions of this paper were presented previously [Ruggero et al., Soc. Neurosci. Abstr. 12, 778 (1986)].
where l and r are the tube's length and radius, respectively, j is f is frequency, ρa is the resting density of air (1.2× 10− 3 g/cm3), and μ is the coefficient of viscosity for air (1.8× 10⁻⁴ g/cm s). For a tube with a length of 25 cm and radius of 0.014 cm, |Zl, | (X02265) 2.98 × 10⁵dyns/cm5. Therefore, the tube's impedance is at least ten times larger than the (compliancedominated) impedance due to the air trapped in the bulla [Eq. (1) in main text] at all frequencies above a few Hz.
In order to obtain a volume-compliance estimate from these point compliance measurements, in each case we have multiplied the latter (units of cm/dyn) by the area of the tip of the probe used to displace the BM. This calculation is justified on the simplistic assumption that coupling of the BM to adjacent regions is negligible in all directions. If, on the other hand, one presumes that there is significant radial (but not longitudinal) coupling (Voldřich, 1978; Miller, 1985), then an approximate volume-compliance estimate may be obtained by multiplying the measured compliance by an “effective” area with longitudinal dimension equal to the probe-tip diameter and radial dimension equal to the BM width. This calculation leads to volume-compliance estimates that are much larger than under the no-coupling hypothesis (and also much larger than compliances derived from acoustic stimulation; see Table IV): 42×10−9 cm/dyn for the data of Gummer et al. (1981) and 24×10−9 cm3/dyn for the data of Miller (1985).
References
- Aitkin LM, Johnstone BM. Middle-ear function in a monotreme, the echidna (Tachyglossus aculeatus) J Exp Zool. 1972;180:245–250. doi: 10.1002/jez.1401800210. [DOI] [PubMed] [Google Scholar]
- Békésy G von. Zur Physik des Mittelhores und über das Hören bei fehlerhaften Trommelfell. Akust Z. 1936;1:13–23. reprinted in Békésy (1960) [Google Scholar]
- Békésy G von. The variation of phase along the basilar membrane with sinusoidal vibrations. J Acoust Soc Am. 1947;19:452–460. reprinted in 460–169 of Békésy (1960) [Google Scholar]
- Békésy G von. In: Experiments in Hearing. Wever EG, editor. McGraw-Hill; New York: 1960. [Google Scholar]
- Beranek LL. Acoustics. McGraw-Hill; New York: 1954. p. 135. [Google Scholar]
- Bismarck G von. MS thesis. Massachusetts Institute of Technology; Cambridge, MA: 1967. The sound pressure transformation function from free field to the eardrum of chinchilla. [Google Scholar]
- Bode HW. Network Analysis and Feedback Amplifier Design. Van Nostrand; New York: 1945. [Google Scholar]
- Bohne BA, Carr CD. Location of structurally similar areas in chinchilla cochleas of different lengths. J Acoust Soc Am. 1979;66:411–414. doi: 10.1121/1.383092. [DOI] [PubMed] [Google Scholar]
- Buunen TJF, Vlaming MSMG. Laser-Doppler velocity meter applied to tympanic membrane vibrations in cat. J Acoust Soc Am. 1981;69:744–750. doi: 10.1121/1.385574. [DOI] [PubMed] [Google Scholar]
- Cabezudo LM. The ultrastructure of the basilar membrane in the cat. Acta Otolaryngol. 1978;86:160–175. [PubMed] [Google Scholar]
- Dallos P. Low-frequency auditory characteristics: species dependence. J Acoust Soc Am. 1970;48:489–499. doi: 10.1121/1.1912163. [DOI] [PubMed] [Google Scholar]
- Dancer A, Franke R. Intracochlear sound pressure measurements in guinea pigs. Hear Res. 1980;2:191–205. doi: 10.1016/0378-5955(80)90057-x. [DOI] [PubMed] [Google Scholar]
- Dancer A, Franke R, Buck K, Smigielski P, Stimpfling A. Etude par interférométrie laser des déplacements du tympan du cobaye sous l'action de sons purs et de bruits impulsifs. Acustica. 1980;46:178–188. [Google Scholar]
- Dancer A, Franke R, Pfeifer HJ, Koch B, Smigielski P, Albe F, Fagot H. Etude par interférométrie classique et holographique des déplacements du tympan du cobaye soumis à des stimulations acoustiques diverses. Rev d'Acoust. 1975;32:47–53. [Google Scholar]
- Décory L, Dancer A, Franke R. Intracochlear pressure measurements in the cat, the chinchilla and the guinea pig. 1989 to be published. [Google Scholar]
- Decraemer WF, Khanna SM, Funnell RJ. Interferometric measurements of the amplitude and phase of tympanic membrane vibrations in cat. Hear Res. 1989;38:1–18. doi: 10.1016/0378-5955(89)90123-8. [DOI] [PubMed] [Google Scholar]
- Drescher DG, Eldredge DH. Species differences in cochlear fatigue related to acoustics of outer and middle ears of guinea pig and chinchilla. J Acoust Soc Am. 1974;56:929–934. doi: 10.1121/1.1903350. [DOI] [PubMed] [Google Scholar]
- Eldredge DH, Miller JD, Bohne BA. A frequency-position map for the chinchilla cochlea. J Acoust Soc Am. 1981;69:1091–1095. doi: 10.1121/1.385688. [DOI] [PubMed] [Google Scholar]
- Evans EF, Wilson JP. Cochlear tuning properties: concurrent basilar membrane and single fiber measurements. Science. 1975;190:1218–1221. doi: 10.1126/science.1198110. [DOI] [PubMed] [Google Scholar]
- Fernández C. Dimensions of the cochlea (guinea pig) J Acoust Soc Am. 1952;24:519–523. [Google Scholar]
- Flanagan JL, Bird CM. Minimum phase responses for the basilar membrane. J Acoust Soc Am. 1962;34:114–118. [Google Scholar]
- Franke R, Dancer A. Cochlear mechanisms at low frequencies in the guinea pig. Arch Otorhinolaryngol. 1982;234:213–218. doi: 10.1007/BF00453634. [DOI] [PubMed] [Google Scholar]
- Franke R, Dancer A. Etude du potentiel microphonique cochléaire chez le cobaye en fonction des conditions expérimentales. Acustica. 1983;52:160–168. [Google Scholar]
- Gilad P, Shtrikman S, Hillman P, Rubinstein M, Eviatar A. Application of the Mössbauer method to ear vibrations. J Acoust Soc Am. 1967;41:1232–1236. doi: 10.1121/1.1910464. [DOI] [PubMed] [Google Scholar]
- Guinan JJ, Jr, Peake WT. Middle-ear characteristics of anesthetized cats. J Acoust Soc Am. 1967;41:1237–1261. doi: 10.1121/1.1910465. [DOI] [PubMed] [Google Scholar]
- Gummer AW, Johnstone BM. Group delay measurement from spiral ganglion cells in the basal turn of the guinea pig cochlea. J Acoust Soc Am. 1984;76:1388–1400. doi: 10.1121/1.391456. [DOI] [PubMed] [Google Scholar]
- Gummer AW, Johnstone BM, Armstrong NJ. Direct measurement of basilar membrane stiffness in the guinea pig. J Acoust Soc Am. 1981;70:1298–1309. [Google Scholar]
- Hoeft LO, Ackerman E, Anthony A. Measurement of the displacements and nonlinearities of the guinea-pig tympanum. J Acoust Soc Am. 1964;36:1836–1844. [Google Scholar]
- Johnstone BM, Sellick PM. The peripheral auditory apparatus. Q Rev Biophys. 1972;5:1–57. doi: 10.1017/s0033583500000032. [DOI] [PubMed] [Google Scholar]
- Johnstone BM, Taylor KJ. Mechanical aspects of cochlear function. In: Plomp R, Smoorenburg GF, editors. Frequency Analysis and Periodicity Detection in Hearing. Sijthoff; Leiden, The Netherlands: 1970. pp. 81–93. [Google Scholar]
- Johnstone BM, Taylor KJ. Physiology of the middle ear transmission system. J Oto-Laryngol Soc Austr. 1971;3:226–228. [PubMed] [Google Scholar]
- Khanna SM, Leonard DGB. Relationship between basilar membrane tuning and hair cell condition. Hear Res. 1986;23:55–70. doi: 10.1016/0378-5955(86)90175-9. [DOI] [PubMed] [Google Scholar]
- Khanna SM, Tonndorf J. Tympanic membrane vibrations in cats studied by time-averaged holography. J Acoust Soc Am. 1972;51:1904–1920. doi: 10.1121/1.1913050. [DOI] [PubMed] [Google Scholar]
- Kim DO, Siegel JH, Molnar CE. Postmortem effects and species difference for acoustic input characteristics at the eardrum of the chinchilla and the cat. Soc Neurosci Abstr. 1980;6:41. [Google Scholar]
- Lynch TJ., III . PhD thesis. M. I. T.; Cambridge, MA: 1981. Signal processing by the cat middle ear: admittance and transmission, measurements and models. [Google Scholar]
- Lynch TJ, III, Nedzelnitsky V, Peake WT. Input impedance of the cochlea in cat. J Acoust Soc Am. 1982;72:108–130. doi: 10.1121/1.387995. [DOI] [PubMed] [Google Scholar]
- Manley GA, Johnstone BM. Middle-ear function in the guinea pig. J Acoust Soc Am. 1974;56:571–576. doi: 10.1121/1.1903292. [DOI] [PubMed] [Google Scholar]
- Miller CE. Structural implications of basilar membrane compliance measurements. J Acoust Soc Am. 1985;77:1465–1474. doi: 10.1121/1.392041. [DOI] [PubMed] [Google Scholar]
- MØller AR. Transfer function of the middle ear. J Acoust Soc Am. 1963;35:1526–1534. [Google Scholar]
- Mundie JR. The impedance of the ear—a variable quantity. In: Fletcher JL, editor. Proceedings of the Middle-Ear Function Seminar. U.S. Army Medical Res Lab.; Ft. Knox, KY: 1963. pp. 63–85. Rep # 576. [PubMed] [Google Scholar]
- Nedzelnitsky V. Sound pressures in the basal turn of the cat cochlea. J Acoust Soc Am. 1980;68:1676–1689. doi: 10.1121/1.385200. [DOI] [PubMed] [Google Scholar]
- Nuttall AL. Measurements of the guinea-pig middle-ear transfer characteristic. J Acoust Soc Am. 1974;56:1231–1238. doi: 10.1121/1.1903413. [DOI] [PubMed] [Google Scholar]
- Peake WT. Application of Mössbauer technique for middle-ear vibration measurement. In: Nastuk WL, Khanna SM, editors. Submicroscopic Vibration Measurement Techniques Applied to Biological Systems. 1989. in press. [Google Scholar]
- Puria S, Allen JB. A parametric study of cochlear input impedance. 1989 doi: 10.1121/1.400675. to be published. [DOI] [PubMed] [Google Scholar]
- Relkin EM, Saunders JC. Displacement of the malleus in neonatal golden hamsters. Acta Otolaryngol. 1980;90:6–15. doi: 10.3109/00016488009131692. [DOI] [PubMed] [Google Scholar]
- Rhode WS. Observations of the vibration of the basilar membrane in squirrel monkeys using the Mössbauer technique. J Acoust Soc Am. 1971;49:1218–1231. doi: 10.1121/1.1912485. [DOI] [PubMed] [Google Scholar]
- Rhode WS. Some observations on cochlear mechanics. J Acoust Soc Am. 1978;64:158–176. doi: 10.1121/1.381981. [DOI] [PubMed] [Google Scholar]
- Robles L, Ruggero MA, Rich NC. Basilar membrane mechanics at the base of the chinchilla cochlea. I. Input–output functions, tuning curves, and response phases. J Acoust Soc Am. 1986;80:1364–1374. doi: 10.1121/1.394389. [DOI] [PubMed] [Google Scholar]
- Ruggero MA, Rich NC. Chinchilla auditory-nerve responses to low-frequency tones. J Acoust Soc Am. 1983;73:2096–2108. doi: 10.1121/1.389577. [DOI] [PubMed] [Google Scholar]
- Ruggero MA, Rich NC. Timing of spike initiation in cochlear afferents: Dependence on site of innervation. J Neurophysiol. 1987;58:379–403. doi: 10.1152/jn.1987.58.2.379. [DOI] [PubMed] [Google Scholar]
- Ruggero MA, Rich NC. ‘Peak-splitting’: intensity effects in cochlear afferent responses to low frequency tones. In: Wilson JP, Kemp DT, editors. Cochlear Mechanisms—Structure, Function and Models. Plenum; London: 1989. pp. 259–266. [Google Scholar]
- Ruggero MA, Costalupes JA, Rich NC. Mössbauer measurements of middle ear function in the chinchilla. Soc Neurosci Abstr. 1986a;12:778. [Google Scholar]
- Ruggero MA, Robles L, Rich NC. Cochlear microphonics and the initiation of spikes in the auditory nerve: Correlation of single-unit data with neural and receptor potentials recorded from the round window. J Acoust Soc Am. 1986b;79:1491–1498. doi: 10.1121/1.393763. [DOI] [PubMed] [Google Scholar]
- Ruggero MA, Robles L, Rich NC. Basilar membrane mechanics at the base of the chinchilla cochlea. II. Responses to low-frequency tones and relationship to microphonics and spike initiation in the VIII nerve. J Acoust Soc Am. 1986c;80:1375–1383. doi: 10.1121/1.394390. [DOI] [PubMed] [Google Scholar]
- Ruggero MA, Robles L, Rich NC, Costalupes JA. Basilar membrane motion and spike initiation in the cochlear nerve. In: Moore BCJ, Patterson RD, editors. Auditory Frequency Selectivity. Plenum; London: 1986d. pp. 189–196. [Google Scholar]
- Sellick PM, Patuzzi R, Johnstone BM. Measurement of basilar membrane motion in the guinea pig using the Mössbauer technique. J Acoust Soc Am. 1982;72:131–141. doi: 10.1121/1.387996. [DOI] [PubMed] [Google Scholar]
- Sellick PM, Yates GK, Patuzzi R. The influence of Mössbauer source size and position on phase and amplitude measurements of the guinea pig basilar membrane. Hear Res. 1983;10:101–108. doi: 10.1016/0378-5955(83)90020-5. [DOI] [PubMed] [Google Scholar]
- Stevens SS, Davis H. Hearing—Its Psychology and Physiology. American Institute of Physics; New York: 1938. [Google Scholar]
- Teas DC, Nielsen DW. Interaural attenuation versus frequency for guinea pig and chinchilla CM response. J Acoust Soc Am. 1975;58:1066–1072. doi: 10.1121/1.380766. [DOI] [PubMed] [Google Scholar]
- Thomas DE. Tables of phase associated with a semi-infinite unit slope of attenuation. Bell Syst Tech J. 1947;26:870–899. [Google Scholar]
- Tonndorf J, Khanna SM. Some properties of sound transmission in the middle and outer ears of cats. J Acoust Soc Am. 1967;41:513–521. doi: 10.1121/1.1910362. [DOI] [PubMed] [Google Scholar]
- Tonndorf J, Khanna SM. Submicroscopic displacement amplitudes of the tympanic membrane (cat) measured by a laser interferometer. J Acoust Soc Am. 1968;44:1546–1554. doi: 10.1121/1.1911295. [DOI] [PubMed] [Google Scholar]
- Tonndorf J, Khanna SM, Fingerhood BJ. The input impedance of the inner ear in cats. Ann Otol Rhino Laryngol. 1966;75:752–763. doi: 10.1177/000348946607500315. [DOI] [PubMed] [Google Scholar]
- Voldřich L. Mechanical properties of the basilar membrane. Acta Otolaryngol. 1978;86:331–335. doi: 10.3109/00016487809107511. [DOI] [PubMed] [Google Scholar]
- Vrettakos PA, Dear SP, Saunders JC. Middle-ear structure in the chinchilla: a quantitative study. Am J Otolaryngol. 1988;9:58–67. doi: 10.1016/s0196-0709(88)80009-7. [DOI] [PubMed] [Google Scholar]
- Weiss TF, Peake WT, Sohmer HS. Intracochlear potentials recorded with micropipets. III. Relation of cochlear microphonic potential to stapes velocity. J Acoust Soc Am. 1971;50:602–615. doi: 10.1121/1.1912676. [DOI] [PubMed] [Google Scholar]
- Wever EG, Lawrence M. Physiological Acoustics. Princeton, U. P.; Princeton, NJ: 1954. [Google Scholar]
- Wever EG, Lawrence M, Smith KR. The middle ear in sound conduction. Arch Otolaryngol. 1948;48:19–35. doi: 10.1001/archotol.1948.00690040026003. [DOI] [PubMed] [Google Scholar]
- Wilson JP, Bruns V. Middle-ear mechanics in the CF-bat Rhinolophus ferrumequinum. Hear Res. 1983;10:1–13. doi: 10.1016/0378-5955(83)90015-1. [DOI] [PubMed] [Google Scholar]
- Wilson JP, Evans EF. Some observations on the ‘passive’ mechanics of cat basilar membrane. In: Webster WR, Aitkin LM, editors. Mechanics of Hearing. Monash U. P.; Clayton, Victoria, Australia: 1983. pp. 30–35. [Google Scholar]
- Wilson JP, Johnstone JR. Basilar membrane and middle-ear vibration in guinea pig measured by capacitive probe. J Acoust Soc Am. 1975;57:705–723. doi: 10.1121/1.380472. [DOI] [PubMed] [Google Scholar]
- Zwislocki J. Analysis of the middle ear function. Part II: Guinea-pig ear. J Acoust Soc Am. 1963;35:1034–1040. [Google Scholar]
- Zwislocki J. Analysis of some auditory characteristics. In: Luce RD, Bush RR, Galanter E, editors. Hand book of Mathematical Psychology. III. Wiley; New York: 1965. pp. 1–97. [Google Scholar]


