

Nonrenal clearance of drugs can be significantly lower in patients with end-stage renal disease (ESRD) than in those with normal renal function. Using erythromycin (ER) as a probe compound, we investigated whether this decrease in nonrenal clearance is due to reduced hepatic clearance (CLH) and/or gut metabolism. We also examined the potential effects of the uremic toxins 3-carboxy-4-methyl-5-propyl-2-furan propanoic acid (CMPF) and indoxyl sulfate (Indox) on ER disposition. Route-randomized, two-way crossover pharmacokinetic studies of ER were conducted in 12 ESRD patients and 12 healthy controls after oral (250 mg) and intravenous (125 mg) dosing with ER. In patients with ESRD, CLH decreased 31% relative to baseline values (0.35 ± 0.14 l/h/kg vs. 0.51 ± 0.13 l/h/kg, P = 0.01), with no change in steadystate volume of distribution. With oral dosing, the bioavailability of ER increased 36% in patients with ESRD, and this increase was not related to changes in gut availability. As expected, plasma levels of CMPF and Indox were significantly higher in the patients than in the healthy controls. However, no correlation was observed between CLH of ER and the levels of uremic toxins.
Chronic kidney disease has long been known to alter drug disposition by reducing renal clearance of drugs and by affecting protein and tissue binding. Renal failure can also affect the nonrenal disposition of drugs that are extensively metabolized by the liver, as previously reviewed.1–5 Initially, the reduction in nonrenal clearance was believed to be caused by decreased metabolic enzyme activity in the liver, given that some of the isoforms of the cytochromes P450 (CYP450s) were found to be downregulated in rats with chronic kidney disease.6,7 More recent studies have suggested that alterations in transporter systems may also be involved,8–10 particularly when the activity of the CYP450 system is normal or not correlated with reduced clearance.11,12 A very recent study13 showed that end-stage renal disease (ESRD) impairs the nonrenal clearance of fexofenadine, most likely because of transporter inhibition, but causes no change in midazolam clearance.
The underlying mechanisms of these alterations in metabolic enzyme and transporter activities of drugs are not well characterized. As shown in a recent review, uremic toxins that accumulate in patients with renal failure may both directly (by inhibition) and indirectly (through regulation of levels of metabolizing enzymes and transporters) modulate enzyme and transporter functions in the liver and the intestine.9,1
Nondialyzable uremic toxins 3-carboxy-4-methyl-5-propyl-2-furan propanoic acid (CMPF) and indoxyl sulfate (Indox) are significantly elevated in the sera of patients with uremia, who show concentration levels approaching 800 μmol/l (Indox) and 400 μmol/l (CMPF).14 These substances are well known for inhibiting drug binding to albumin15,16 and kidney tubular secretion of organic acids.17 More recently, they have been shown to inhibit liver uptake transporters.8,18
In order to investigate the in vivo effects of ESRD on nonrenal drug disposition, we chose erythromycin (ER) as a probe substrate and carried out pharmacokinetic studies after administering oral and intravenous (i.v.) doses of ER to 12 patients with ESRD and 12 healthy subjects with normal renal function. The availability of both oral and i.v. commercial formulations of ER allows us to evaluate whether (i) hepatic clearance (CLH) of ER isdecreased in patients with ESRD, (ii) gut availability (absorption and metabolism) of ER is decreased in patients with ESRD, and (iii) plasma levels of uremic toxins, CMPF and Indox, correlate with the CLH of ER in these patients.
ER exhibits significantly reduced nonrenal clearance in patients with ESRD relative to that in healthy individuals.19,20 Kanfer et al.20 speculated that the markedly increased exposure to ER in patients with ESRD was most likely due to reduced CLH, in view of the fact that only a small fraction of ER is eliminated unchanged in urine. However, effects related to intestinal absorption and gut metabolism could not be excluded, because no parallel study with i.v. dosing of ER was conducted.
In the liver, hepatic uptake mediated by transporters is often of xenobiotics.21 ER uptake is mediated mainly by the organic anion transporter polypeptides (Oatps in rats and OATPs in humans). ER is partially metabolized by CYP3A4 to its N-demethylated metabolite but is primarily excretedunchanged in the bile by P-glycoprotein (P-gp). Therefore, compared to the hepatic metabolizing enzyme systems, the liver uptake and efflux transporters may play a more important role in ER disposition. We previously demonstrated that the uremic toxins CMPF and Indox could directly inhibit hepatic uptake and metabolism of ER in rat hepatocytes.8 The inhibitory effects of these uremic toxins may lead to the reduced CLH of ER inpatients with renal failure.
In the intestine, metabolizing enzymes and transporters also play important roles in drug exposure and disposition.22,23 Inhibition of either intestinal CYP3A4 or P-gp can decrease gut metabolism and increase blood levels of drugs that are substrates of P-gp and CYP3A.22,23 Therefore, metabolism in the gut may contribute to total clearance of ER. In rats with chronic renal failure, the activity levels of both P-gp and CYP3A have been shown to be decreased,24 probably because of the presence of uremic toxins.25 More recent studies in rats have evaluated the effects of chronic kidney disease on the differential functional expressions of uptake and efflux transporters in the intestine26 and liver.27 Alterations in the quantity or function of CYP3A4, OATPs, and P-gp in the intestine and liver of human patients with ESRD could potentially contribute to the apparent reduction in nonrenal clearance of ER.
RESULTS
Demography and safety
All 24 subjects completed both the oral and i.v. studies. The demographic characteristics of the study subjects are presented in Table 1, including all the medications taken by the patients with ESRD. Two of the subjects reported stomach upset after the oral dose of ER, but this resolved without treatment. No severe adverse effects occurred.
Table 1.
Demographic characteristics of study subjects (mean ± SD) and concomitant drugs taken by ESRD patients
| Healthy volunteers | ESRD patients | |
|---|---|---|
| Basic characteristics | ||
| n | 12 | 12 |
| Sex (IWF) | 6/6 | 9/3 |
| Age (years) | 44.8 ± 8.5 | 56.6 ± 11.4* |
| Weight | 75.0 ± 19.4 | 70.1 ± 6.7 |
| Ethnicity (AA/C/AP) | 7/2/3 | 6/3/3 |
| Clinical chemistry | ||
| AST (U/I) | 17.8 ± 4.8 | 20.3 ± 11.2 |
| ALT (U/I) | 13.5 ± 37 | 17.5 ± 9.1 |
| Serum creatinine (mg/dl) | 1.0 ± 0.2 | 12.4 ± 7.0* |
| BUN (mg/dl) | 14.6 ± 4.6 | 48.0 ± 18.9* |
| Serum albumin (g/l) | 4.2 ± 0.5 | 3.7 ± 0.5* |
| CLcr (ml/min/1.73 m2) | 86.0 ± 11.4a | Anuric* |
ESRD patient drugs: sevelamer (9 patients), vitamins (8), metoprolol (6), calcium acetate (4), insulin (4), clonidine (3), omeprazole (3), calcium bicarbonate (2), minoxidil (2), diltiazem (2), amlodipine (2), benazepril (2), glipizide (2), simvastatin (2); one patient each was taking cinacalcet, folic acid, nifedipine, ranitidine, warfarin, atorvastatin, ipratropium and albuterol, albuterol, amitriptyline, fluoxetine, hydroxyzine, trazodone, hydrocodone and acetaminophen, azathioprine, bisacodyl, furosemide, and prednisone.
AA, African American; ALT, alanine transaminase; AP, Asian/Pacific Islander; AST, aspartate aminotransferase; BUN, blood urea nitrogen; C, Caucasian; CLcr, creatinine clearance; ESRD, end-stage renal disease.
Estimated from the MDRD (modification of diet in renal disease) equation.
P < 0.05.
ER pharmacokinetics after i.v. infusion
The plasma concentration-vs.-time profiles for ER and N-demethyl-erythromycin are shown in Figure 1. The pharmacokinetic parameters calculated from the i.v. infusion data are presented in Table 2. After i.v. infusion of ER (125 mg), the area under the concentration–time curve (AUC) increased significantly in patients with ESRD (P = 0.01): ~53% higher than in controls. After adjusting the AUC by dose/kg, the difference between patients and controls increased to 68%. Consequently, total clearance of ER was significantly decreased in the patients (0.35 ± 0.14 l/h/kg vs. 0.53 ± 0.13 l/h/kg, P = 0.005) as compared to the healthy controls (Table 2).
Figure 1.


Mean plasma concentrations of (a) erythromycin and (b) N-demethyl-erythromycin after intravenous infusion of erythromycin (125 mg) in subjects with end-stage renal disease (ESRD) (open circles) and in those with normal renal function (closed circles). Each symbol represents the mean ± SEM (n = 12).
Table 2.
Erythromycin pharmacokinetic parameters (mean ± SD) in ESRD patients and controls after intravenous infusion of 125 mg erythromycin
| Healthy controls | ESRD patients | Percentage change (P value) | |
|---|---|---|---|
| AUC (μg·h/l) | 3,580 ± 1,020 | 5,860 ± 2,860 | 53%a ↑ (P = 0.01) |
| AUC adjustedb (kg·h/l) | 1.89 ± 0.54 | 3.39 ± 1.65 | 68%a ↑ (P = 0.005) |
| CL (l/h/kg) | 0.53 ± 0.13 | 0.35 ± 0.14 | 34% ↓ (P = 0.005) |
| CLr (l/h/kg) | 0.03 ± 0.01 | Anuric | |
| CLH (l/h/kg) | 0.51 ± 0.13 | 0.35 ± 0.14 | 31% ↓ (P = 0.01) |
| Vss (l/kg) | 0.74 ± 0.19 | 0.72 ± 0.22 | ↔ |
| t1/2 (h) | 2.30 ± 1.03 | 4.43 ± 2.39 | 93% ↑ (P = 0.01) |
| MRT (h) | 1.41 ± 0.30 | 2.29 ± 1.11 | 62% ↑ (P = 0.02) |
| fu (%) | 27 ± 5 | 30 ± 4 | ↔ |
AUC, area under the concentration–time curve; CL, total clearance; CLH, hepatic clearance; CLr, renal clearance; ESRD, end-stage renal disease; fu, unbound fraction; MRT, mean residence time; t1/2, elimination half-life; Vss, steady-state volume of distribution.
Geometric mean difference (after log transformation).
AUC was adjusted by dose/weight.
CLH was also significantly reduced—by 31%—in the patients as compared to the healthy controls (0.35 ± 0.14 l/h/kg vs. 0.51 ± 0.13 l/h/kg, P = 0.01). The steady-state volume of distribution was unchanged. The terminal half-life was longer by 93% (P = 0.01), and mean residence time was longer by 62% (P = 0.02) in patients with ESRD. Age and sex may directly affect drug clearance in certain cases.28,29 However, when analyzed using multiple linear regression, neither age (P = 0.59) nor sex (P = 0.22) was shown to be associated with CLH of ER in this study.
In line with the increase in plasma concentration profile of ER in the patients with ESRD, the concentration profile of its major metabolite, N-demethyl-erythromycin, also showed an increase in these patients (Figure 1b). The geometric mean ratio was derived for both groups (patients and controls) from the logtransformed AUC of N-demethyl-erythromycin. On average, the AUC of N-demethyl-erythromycin was 140% higher in the patients than in the healthy controls (P = 0.01). Prior studies in our laboratory30 have shown that N-demethyl-erythromycin undergoes transport and metabolism pathways similar to those of ER. Therefore, it is not surprising that both ER and N-demethyl-erythromycin exhibit similar plasma concentration profiles.
The unbound fraction of ER was not significantly different in the patients as compared to the healthy controls (30 ± 4% vs. 27 ± 5%).
ER pharmacokinetics after oral dosing
The plasma concentration-vs.-time profiles for ER and N-demethyl-erythromycin after oral dosing of 250 mg are shown in Figure 2. The pharmacokinetic parameters are presented in Table 3. From the linear regression model, we found that sex is a significant confounder (P = 0.025) of the differences in AUC and peak plasma concentration between the two groups. After oral dosing with ER, the dose/weight-adjusted AUC in healthy volunteers was significantly higher in female subjects (0.433 ± 0.157) than in male subjects (0.141 ± 0.057) (P = 0.007). However, no significant sex-related difference in AUC was observed following i.v. dosing in the healthy volunteers (2.00 ± 0.67 vs. 1.98 ± 0.25). With respect to the patients, there were too few women (three) and too much variability to yield useful comparisons based on sex. No sex-related differences in CMPF and Indox were observed. As depicted in Table 3, the dose/weight-adjusted AUC in the patients increased 158% (P = 0.009), and peak plasma concentration increased 137% (P = 0.01). Time to maximal concentration was similar between patients and controls.
Figure 2.


Mean plasma concentrations of (a) erythromycin and (b) N-demethyl-erythromycin after oral administration of erythromycin (250 mg) in subjects with end-stage renal disease (ESRD) (open circles) and in those with normal renal function (closed circles). Each symbol represents the mean ± SEM (n = 12).
Table 3.
Erythromycin pharmacokinetic parameters (mean ± SD) in ESRD patients and controls after oral administration of 250 mg erythromycin
| Healthy controls | ESRD patients | Percentage increase (P value) | |
|---|---|---|---|
| Tmax (h) | 0.92 ± 0.56 | 1.08 ± 1.04 | ↔ |
| Cmax (μg/l) | 446 ± 298 | 895 ± 714 | 137%a ↑ (P = 0.01) |
| AUC (μg·h/l) | 1,040 ± 702 | 2,400 ± 1,950 | 51%a ↑ (P = 0.007) |
| AUC adjustedb (kg·h/l) | 0.29 ± 0.19 | 0.74 ± 0.77 | 158%a ↑ (P = 0.009) |
| F (%) | 15 ± 6 | 21 ± 17 | 36% ↑ (P = 0.36) |
| FH (%) | 50 ± 10 | 64 ± 15 | 28% ↑ (P = 0.015) |
| Fabs·FG (%) | 33 ± 30 | 35 ± 28 | ↔ |
| t1/2 (h) | 2.86 ± 1.27 | 6.23 ± 3.17 | 118% ↑ (P = 0.003) |
| MAT (h) | 1.52 ± 0.56 | 2.83 ± 2.50 | 86% ↑ (P = 0.09) |
| fu (%) | 27 ± 5 | 30 ± 4 | ↔ |
AUC, area under the concentration–time curve; Cmax, peak plasma concentration; ESRD, end-stage renal disease; F, bioavailability; Fabs, fraction of the dose absorbed; FG, gut bioavailability; FH, hepatic bioavailability; fu, unbound fraction; MAT, mean absorption time; t1/2, elimination half-life; Tmax, time to maximal concentration.
Geometric mean difference (after log transformation).
AUC was adjusted by dose/weight.
In ESRD patients vs. controls, the increase in AUC adjusted after oral administration of ER was greater than that after i.v. infusion. This finding can be interpreted as resulting from reduced gut metabolism of ER and/or increased absorption of the orally administered drug in the patients. Bioavailability (F) and mean absorption time were both higher in the patients than in the controls, but this difference did not reach statistical significance (Table 3) because of large intersubject variability in both the groups. However, the calculated Fabs · FG product was unchanged (35 ± 28% in patients vs. 33 ± 30% in healthy controls), strongly suggesting that uremia had no affect on ER absorption and first-pass gut extraction. Consistent with the significant 31% decrease in CLH in ESRD, the hepatic bioavailability (FH) increased a significant 28% in these patients (Tables 2 and 3). The terminal half-life of ER was significantly higher in the patient group than in the controls (6.2 ± 3.2 h vs. 2.9 ± 1.3 h, P = 0.003).
The mean plasma concentration profile of N-demethylerythromycin is shown in Figure 2b. As in the case of ER, the plasma levels of N-demethyl-erythromycin showed a greater increase in the patients relative to the controls, but again the difference was not statistically significant, given the large intersubject variability (277 ± 226 μg/l·h vs. 109 ± 65 μg/l·h).
Analysis of M/P ratios
For each study subject, we calculated two metabolite-to-parent (M/P) ratios: one derived after oral administration and the other after i.v. infusion of ER. In healthy controls, the M/P ratio after oral administration was significantly higher than the M/P ratio after i.v., as assessed using the paired t-test (0.12 ± 0.03 vs. 0.04 ± 0.01, P < 0.001) (Table 4). This finding suggests that first-pass metabolism contributes significantly to the total metabolism of ER after oral dosing. One would expect to observe a similar difference in the patients as well, but the high variability of the M/P ratio after i.v. dosing interferes with the ability to observe any significant difference. The similarity in the M/P ratios after oral dosing (Table 4) suggests that the parent ER and its N-demethyl metabolite are both substrates for the same transporters and enzymes, as was previously demonstrated in a study in rats.30 That is, in ESRD, CLM changes in parallel with CLP; therefore, the ratio CLP/CLM remains constant.
Table 4.
Metabolite/parent (M/P) ratio of erythromycin in ESRD patients and healthy controls (mean ± SD)
| Healthy controls | ESRD patients | Difference | |
|---|---|---|---|
| i.v. M/P ratioa | 0.04 ± 0.01 | 0.09 ± 0.11 | NS |
| p.o.M/Pratiob | 0.12±0.03c | 0.12±0.06d | NS |
ESRD, end-stage renal disease; i.v., intravenous; p.o., peroral.
i.v. M/P ratio: AUCM/AUCP from intravenous infusion of erythromycin (125 mg).
p.o. M/P ratio: AUCM/AUCP from oral dosing of erythromycin (250 mg).
Statistically different from i.v. M/P ratio (P = 8.2 × 10⁻⁶).
Not statistically different from i.v. M/P ratio (P = 0.31).
Sensitivity analysis
Because seven of the patients with ESRD also had diabetes, and considering that diabetes-related delays in gastric emptying time could affect drug absorption (and consequently drug exposure levels), we also tested to determine whether diabetes was associated with lower AUC in the patients with ESRD. The average AUC of ER was similar between the patients with diabetes and those without diabetes (P = 0.43).
Two patients with ESRD were on diltiazem, a CYP3A4 inhibitor, for treatment of hypertension. In order to minimize the effects of diltiazem on ER metabolism, these two subjects were instructed to omit their diltiazem dose the day before the study. They were also not permitted to take the drug during the study; however, its potential inhibitory effects might not havebeen completely eliminated. To examine whether the exclusion of data related to these two patients would affect our conclusion, we carried out a sensitivity analysis. This analysis indicated no significant interaction. A similar sensitivity analysis showed no interaction with omeprazole.
Correlation of uremic toxins with pharmacokinetic parameters
Plasma levels of CMPF and Indox were measured by liquid chromatography–tandem mass spectrometry (LC/MS/MS) in both groups (patients with ESRD and controls). The levels of both CMPF (27.3 ± 35.9 μmol/l vs. 4.6 ± 4.2 μmol/l) and Indox (111 ± 50 μmol/l vs. 1.5 ± 1.1 μmol/l) were much higher in the patients than in the healthy controls. However, there was wide interindividual variation in the levels among the patient group. In order to determine whether the plasma levels of uremic toxins were correlated with CLH, we performed a Spearman rank correlation test. When the data from all 24 study subjects were included in the test, we found a significant correlation between CMPF values and CLH (correlation coefficient: 0.46, P = 0.03) (Figure 3). A similar correlation was observed for Indox (correlation coefficient: 0.44, P = 0.03) (Figure 3). However, when data from the patient group were analyzed separately, neither CMPF nor Indox showed any correlation with CLH (correlation coefficients: 0.03 and 0.26, respectively, P > 0.05). The apparent correlation between the levels of uremic toxins and CLH when data from all 24 subjects were analyzed can be attributed to their being clustered into two groups: patients with ESRD and healthy controls (Figure 3).
Figure 3.
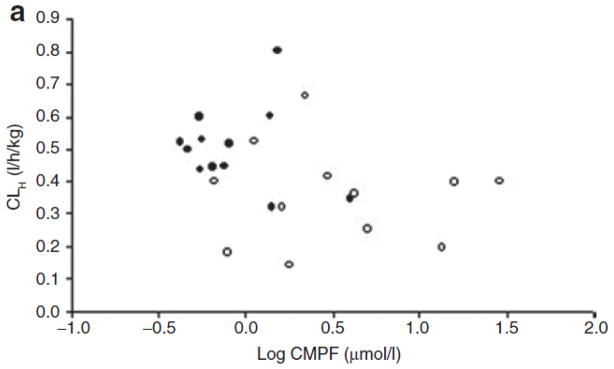

Scatter plot of individual levels (average of 0- and 14-h measurements) of (a) 3-carboxy-4-methyl-5-propyl-2-furan propanoic acid (CMPF) and (b) indoxyl sulfate (Indox) vs. hepatic clearance (CLH) in subjects with end-stage renal disease (open symbols) and in those with normal renal function (closed symbols). The plasma levels of CMPF and Indox are log transformed.
Discussion
This study demonstrates that the increased exposure (relative to healthy controls) of our model drug ER in patients with ESRD, both after oral and i.v. administration, is due solely to lower CLH of ER (relative to the controls) (Tables 2 and 3). The lower dose/weight-adjusted AUCs after oral administration (Table 3) than after i.v. administration (Table 2) reflect the incomplete absorption of this poorly permeable drug and first-pass metabolism. From a comparison of the AUC-adjusted increases after oral dosing (158% increase) vs. i.v. dosing (65% increase) (Tables 2 and 3) in patients with ESRD and healthy volunteers, one might suspect that ESRD may also have caused a decrease in gut metabolism. ER is a dual substrate of CYP3A4 and P-gp. Therefore, inhibition of either CYP3A4 or P-gp can lead to both reduced gut metabolism and increased drug exposure. It has been shown that CYP3A4 is downregulated and has decreased activity in rats with chronic renal failure.31 Decreased intestinal P-gp activity has also been found in rats with chronic renal failure,24 probably because of the presence of uremic toxins,25 although the exact mechanisms are unknown. However, calculated values of Fabs · FG show no significant change in patients with ESRD (Table 3), although marked interpatient variability was found. One cannot rule out the possibility that ESRD was responsible for a compensatory increase in FG and decrease in Fabs, but this seems unlikely given that ESRD caused a decrease in drug absorption rate as measured by mean absorption time; this would, if anything, be expected to increase Fabs for this poorly permeable drug.
CLH is the major route of ER disposition, and it was significantly reduced in patients with ESRD (Table 2), with no significant change in the unbound fraction of ER. ER is partially metabolized by CYP3A4 to N-demethyl-erythromycin, and CYP3A4 activity has been reported to be lower in renal failure6,7 either as a result of downregulation or through direct inhibition by uremic toxins.8,9 However, clearance by enzyme metabolism accounts for only a small proportion (<15%) of total CLH of ER, as demonstrated by the M/P ratio (Table 4). Therefore, other mechanisms, such as alteration in drug transport into or out of the liver, might also account for the reduced CLH of ER.
In vitro and in vivo studies in rats have shown that ER is a good substrate of the Oatp uptake transporter family and the efflux transporter P-gp;8,30 therefore, both the uptake and efflux transporters may play important roles in the hepatic disposition of our model drug. Recent studies in humans have indicated that ER undergoes hepatic OATP uptake and P-gp efflux, in addition to CYP3A4 metabolism.32,33 Our previous in vitro study8 showed that the uremic toxins CMPF and Indox directly inhibit hepatic uptake of ER by inhibiting Oatps and that this action may contribute to reduced CLH in subjects with advanced kidney disease. A previous study showed that CMPF and Indox, at concentrations normally present in the sera of uremic patients, could inhibit the uptake of thyroxine (T4) by hepatocytes,34 with mediation by OATPs.35
In order to carry out further investigation of the potential role of uremic toxins in drug disposition, we measured the plasma levels of CMPF and Indox in subjects with ESRD and in those with normal renal function. As predicted, the levels of CMPF and Indox were significantly higher in the patients with ESRD than in normal subjects. However, in the patients with ESRD, no correlation was found between CLH of our model substrate ER and the plasma levels of these two uremic toxins. This lack of correlation suggests that the underlying mechanisms of reduced CLH in renal failure are more complex than we had hypothesized. In our study, the CMPF levels in the healthy controls were three- to fivefold lower than the values reported in the literature.36,37 However, the relative differences between the levels in ESRD patients and those in healthy controls are similar to those reported from other studies. The reason for the discrepancy between our values and the reported values with regard to CMPF levels in controls is not clear. We developed a highly sensitive and specific LC/MS/MS method for measuring CMPF. The values reported previously were measured using gas chromatography–mass spectroscopy or high-performance liquid chromatography.36–38 We found no significant difference between the results from the use of two commonly employed protein-extraction methods, namely, boiling to denature protein and acid extraction.39 The discrepancy could be due to the difference in the sources of the standard compound used to develop the methods and the actual measurement methods.
An interesting sex-related effect was found in the data following oral administration of ER. Because our study had six female subjects in the healthy control group but only three in the patient group, we carried out a regression analysis with sex as one of the predictors. It demonstrated that sex was a significant confounder for the difference in AUC between the patients and the healthy controls. The average AUC of ER was higher in female subjects than in male subjects in both groups, but this difference was statistically significant (P = 0.007) only in the healthy control group. There have been reports of sex-related effects on CLH of CYP3A4 substrates,40–42 possibly because of higher levels of CYP3A4 in women.43 However, we did not see such an effect for the data associated with i.v. administration. Therefore, the sex-related effects, which were seen only after oral administration of ER, suggest that differences may exist between the two sexes with respect to intestinal P-gp/CYP3A4 content or activity. Paine et al.44 demonstrated that the expression levels of CYP3A4 and P-gp are similar in men and women; however, that study assessed only the proximal small intestine and did not study functional differences.
A limitation of our study is that we cannot rule out the possibility that medications taken by the ESRD patients also contributed to the reduced hepatic uptake and metabolism of ER. Although we tried to exclude patients who had been taking medications that could interfere with ER metabolism, we cannot be certain that we completely eliminated the potential effects of comedications. Sensitivity analyses of data excluding those from patients who took diltiazem and omeprazole (CYP3A4 inhibitors) did not change the results. One major limitation of this work in terms of accounting for the decreased CLH in patients with ESRD is due to the fact that the clinical study and plasma measurements were carried out in 2005, before we became aware of the effect of parathyroid hormone on the downregulation of liver CYP450 in chronic kidney disease. 45 This hormone was therefore not measured in our study. We were also unaware that hemodialysis can acutely improve hepatic CYP3A4 metabolism,46 but this should have had no effect on our results because the study was carried out only on interdialysis days.
In conclusion, our study suggests, using ER as a model substrate, that CLH, but not gut bioavailability, of drugs may be lower in patients with ESRD. This appears to be the first study in humans to differentiate between the effects of uremia on hepatic vs. intestinal clearance. Understanding the alterations and mechanisms of drug clearance in patients with renal failure is important for guiding dose adjustment in these patients.
Methods
Study subjects
Twelve patients with ESRD and 12 healthy controls were studied. All the patients had been on chronic high-flux hemodialysis (target Kt/V = 1.4) three times a week for .11 months (median 118 months, range 11–251 months). Normal renal function was defined as creatinine clearance .80 ml/min and was estimated using the MDRD (modification of diet in renal disease) formula.47 Patients who were taking medications that could interfere with ER metabolism were excluded if possible. All subjects with evidence of liver disease or of abuse of alcohol or illicit drugs within the 6 months prior to the study and those having a serum albumin level <3.0 g/dl, hematocrit level <30 mg/dl, or allergy to ER were also excluded. Given the time constraints of the study, we were unable to match the healthy volunteers and the ESRD patients in terms of sex and age, but a reasonable match in terms of ethnicity and weight was obtained.
Study procedures
The study protocol was approved by the University of California, San Francisco, institutional review board. Written informed consent was obtained from all study participants. The study was conducted at the university’s General Clinical Research Center in mid-2005.
The subjects were admitted to the research center in the morning of each of the study days. Each subject underwent two ER pharmacokinetic studies, randomized and separated by .7 days. Each subject received either oral (250 mg) administration or 30-min i.v. infusion (125 mg) of ER. The subjects were asked to fast from the midnight prior to each ER study day until 3 h after administration of the dose. The patients with ESRD were studied on nondialysis days, and all other medications were taken .3 h after ER dosing. Blood samples were obtained for pharmacokinetic analysis before the dose (0) and at 0.5, 1, 1.5, 2, 4, 6, 8, 10, 12, 14, and 24 h after the dose. Plasma samples were kept at .80 °C until analysis. In the healthy volunteers, a 24-h urine collection was done, and the samples were aliquoted into 20-ml bottles and stored at .80 °C until analysis.
Analytical procedures
Plasma samples were assayed in mid-2005 for ER and N-demethyl-erythromycin using LC/MS/MS, as previously described.8,30 Linearity was observed from 0.078 to 10 μmol/l with an r2 of 0.9977. The detection limit was 2 nmol/l. Inter- and intraday coefficients of variation were 7.6 and 5%, respectively.
Levels of the uremic toxins CMPF and Indox were measured using LC/MS/MS in 0- and 14-h plasma samples. The linear range of the previously described CMPF method48 was 1–100 μg/ml, with a detection limit of 30 ng/ml. Indox was extracted from plasma (100 μl) by precipitation with acetonitrile (200 μl). The mass detector was Micromass Quattro Ultima using electrospray/negative-ionization mode. The multiple reaction monitor was set at 212.0–132.0 m/z for Indox and 185.1–141.1 m/z for 1-naphthaleneacetic acid (internal standard). The cone voltages and collision energies were set as 25 V and 20 eV, respectively, for Indox and 15 V and 15 eV, respectively, for the internal standard. The capillary voltage was 3 kV. The source block temperature and desolvation temperature were set at 100 and 400 °C, respectively. The cone gas flow and desolvation gas flow were ~100 and ~669 l/h, respectively. The column was Keystone, BDS C18 (4.6 . 50 mm2, 5-μm particle size) with mobile phase consisting of 15% acetonitrile containing 5 mmol/l NH4Ac. The flow rate was 1.0 ml/min, one-fourth split into the mass system. The linear range was 1–200 μg/ml, with a detection limit of 20 ng/ml. Assay variations (coefficient of variation %) for spiked plasma samples were <15% for both CMPF and Indox.
Determination of ex vivo protein binding of ER
[14C]-Erythromycin (0.5 μmol/l, 5 nCi) was added to selected plasma samples (200 μl). The spiked samples were incubated at 37 °C for 15 min before being loaded into the ultrafiltration apparatus, Centrifree (Millipore, Bedford, MA) and centrifuged (1,500 g, 15 min) to obtain an ultrafiltrate containing unbound radioactivity. Aliquots of spiked plasma and ultrafiltrate were analyzed by liquid scintillation counting in order to assess the percentage of unbound fraction (fu) of ER, calculated as the ratio of ultrafiltrate radioactivity to unfiltered plasma radioactivity.
Pharmacokinetic analyses
Pharmacokinetic parameters were estimated from plasma concentration data by noncompartmental analysis using WinNonlin Professional software, version 2.1 (Pharsight, Mountain View, CA). The AUC was estimated using the linear trapezoidal method up to the last measured concentration and extrapolated to infinite time by dividing this last measured concentration by the terminal rate constant. Total clearance was calculated as dose/AUC from i.v. data. CLH was calculated by subtracting renal clearance from total clearance. Renal clearance of ER in healthy controls was calculated by dividing the amount excreted unchanged in urine by the plasma AUC of ER over 24 h. Dose- and weight-adjusted AUCs (AUC/(dose/weight)) were also calculated.
The elimination half-life was obtained by linear regression analysis of the last data points after semilog transformation of the data. The mean residence time was estimated by AUMC/AUC from i.v. infusion data, where AUMC is the area under the moment vs. time curve. The mean absorption time was calculated as the difference between AUMC/AUC from the oral administration data and mean residence time from the i.v. data. The bioavailability (F) of orally administered ER was calculated as follows: (AUCp.o. · dosei.v.)/(AUCi.v. · dosep.o.). The product Fabs · FG (fraction of the dose absorbed multiplied by the gut availability) was determined as F/FH where FH was estimated as (CLH · B/P)/QH, where the plasma CLH multiplied by the blood-to-plasma ratio (B/P; 1.3 in humans 30) is divided by the hepatic blood flow, (QH), assumed to be 90 l/h in a 70-kg human. M/P ratios of AUCs were determined from both i.v. and oral administration of ER.
Statistical analyses
The differences in pharmacokinetic parameters between patients with ESRD and healthy controls were analyzed using unpaired Student’s t-tests. On the basis of AUC (mean ± SD) data for ER from a previous study,49 a sample size of 12 subjects per group was calculated as providing .80% power to detect AUC differences of 40% between the groups. AUC and peak plasma concentration were log transformed for statistical analysis. The geometric mean ratios for the differences between these two groups were calculated and exponentially back-transformed to provide estimates of the corresponding ratios. All other pharmacokinetic parameters were directly compared without transformation. For each subject, the M/P ratios after oral and i.v. administration of ER were compared using the paired t-test. The effects of sex and age on pharmacokinetic parameters were assessed using a multiple linear regression model (Stata 8.2; StataCorp, College Station, TX). The correlations between CLH and the levels of uremic toxins (CMPF and Indox) in the plasma were estimated using the Spearman rank correlation method.
Acknowledgments
We thank the staff of the General Clinical Research Center at the University of California, San Francisco (UCSF), for assisting in the clinical study and Emil Lin’s lab for the LC/MS/MS analysis. We also thank Edward Lindup for the supplies of CMPF. During the course of this work, H.S. received stipend support initially through a National Institutes of Health (NIH) Clinical Pharmacology Training grant (T32 GM07456) and subsequently through a Pharmaceutical Research and Manufacturers of America postdoctoral fellowship in pharmacology. These studies were supported in part by NIH grant GM61390 and were carried out in part in the General Clinical Research Center at UCSF with support from the Division of Research Resources, NIH (5-M01-RR-00079). These studies were previously presented in part at the Annual Meeting of the American Association of Pharmaceutical Scientists in 2005 and at the Annual Meeting of the American Society of Nephrology in 2008 (J. Am. Soc. Nephrol. 19: 929A (abstract)).
Footnotes
CONFLICT OF INTEREST
The authors declared no conflict of interest.
References
- 1.Touchette MA, Slaughter RL. The effect of renal failure on hepatic drug clearance. DICP. 1991;25:1214–1224. doi: 10.1177/106002809102501111. [DOI] [PubMed] [Google Scholar]
- 2.Yuan R, Venitz J. Effect of chronic renal failure on the disposition of highly hepatically metabolized drugs. Int J Clin Pharmacol Ther. 2000;38:245–253. doi: 10.5414/cpp38245. [DOI] [PubMed] [Google Scholar]
- 3.Dreisbach AW, Lertora JJ. The effect of chronic renal failure on hepatic drug metabolism and drug disposition. Semin Dial. 2003;16:45–50. doi: 10.1046/j.1525-139x.2003.03011.x. [DOI] [PubMed] [Google Scholar]
- 4.Nolin TD, Frye RF, Matzke GR. Hepatic drug metabolism and transport in patients with kidney disease. Am J Kidney Dis. 2003;42:906–925. doi: 10.1016/j.ajkd.2003.07.019. [DOI] [PubMed] [Google Scholar]
- 5.Sun H, Frassetto L, Benet LZ. Effects of renal failure on drug transport and metabolism. Pharmacol Ther. 2006;109:1–11. doi: 10.1016/j.pharmthera.2005.05.010. [DOI] [PubMed] [Google Scholar]
- 6.Leblond FA, Giroux L, Villeneuve JP, Pichette V. Decreased in vivo metabolism of drugs in chronic renal failure. Drug Metab Dispos. 2000;28:1317–1320. [PubMed] [Google Scholar]
- 7.Guevin C, Michaud J, Naud J, Leblond FA, Pichette V. Down-regulation of hepatic cytochrome p450 in chronic renal failure: role of uremic mediators. Br J Pharmacol. 2002;137:1039–1046. doi: 10.1038/sj.bjp.0704951. [DOI] [PMC free article] [PubMed] [Google Scholar]
- 8.Sun H, Huang Y, Frassetto L, Benet LZ. Effects of uremic toxins on hepatic uptake and metabolism of erythromycin. Drug Metab Dispos. 2004;32:1239–1246. doi: 10.1124/dmd.104.000521. [DOI] [PubMed] [Google Scholar]
- 9.Nolin TD, Naud J, Leblond FA, Pichette V. Emerging evidence of the impact of kidney disease on drug metabolism and transport. Clin Pharmacol Ther. 2008;83:898–903. doi: 10.1038/clpt.2008.59. [DOI] [PubMed] [Google Scholar]
- 10.Nolin TD. Altered nonrenal drug clearance in ESRD. Curr Opin Nephrol Hypertens. 2008;17:555–559. doi: 10.1097/MNH.0b013e3283136732. [DOI] [PubMed] [Google Scholar]
- 11.Martin DE, et al. Pharmacokinetics and protein binding of eprosartan in healthy volunteers and in patients with varying degrees of renal impairment. J Clin Pharmacol. 1998;38:129–137. doi: 10.1002/j.1552-4604.1998.tb04401.x. [DOI] [PubMed] [Google Scholar]
- 12.Kovacs SJ, Tenero DM, Martin DE, Ilson BE, Jorkasky DK. Pharmacokinetics and protein binding of eprosartan in hemodialysisdependent patients with end-stage renal disease. Pharmacotherapy. 1999;19:612–619. doi: 10.1592/phco.19.8.612.31518. [DOI] [PubMed] [Google Scholar]
- 13.Nolin TD, et al. ESRD impairs nonrenal clearance of fexofenadine but not midazolam. J Am Soc Nephrol. 2009;20:2269–2276. doi: 10.1681/ASN.2009010082. [DOI] [PMC free article] [PubMed] [Google Scholar]
- 14.Niwa T, Ise M. Indoxyl sulfate, a circulating uremic toxin, stimulates the progression of glomerular sclerosis. J Lab Clin Med. 1994;124:96–104. [PubMed] [Google Scholar]
- 15.Takamura N, Maruyama T, Otagiri M. Effects of uremic toxins and fatty acids on serum protein binding of furosemide: possible mechanism of the binding defect in uremia. Clin Chem. 1997;43:2274–2280. [PubMed] [Google Scholar]
- 16.Sarnatskaya VV, et al. Effect of protein-bound uraemic toxins on the thermodynamic characteristics of human albumin. Biochem Pharmacol. 2002;63:1287–1296. doi: 10.1016/s0006-2952(02)00869-9. [DOI] [PubMed] [Google Scholar]
- 17.Tsutsumi Y, Deguchi T, Takano M, Takadate A, Lindup WE, Otagiri M. Renal disposition of a furan dicarboxylic acid and other uremic toxins in the rat. J Pharmacol Exp Ther. 2002;303:880–887. doi: 10.1124/jpet.303.2.880. [DOI] [PubMed] [Google Scholar]
- 18.Sun H, Huang Y, Okochi H, Frassetto L, Benet LZ. Uremic toxins inhibit hepatic uptake of eprosartan. Clin Pharmacol Ther. 2005;77:2. [Google Scholar]
- 19.Welling PG, Craig WA. Pharmacokinetics of intravenous erythromycin. J Pharm Sci. 1978;67:1057–1059. doi: 10.1002/jps.2600670809. [DOI] [PubMed] [Google Scholar]
- 20.Kanfer A, Stamatakis G, Torlotin JC, Fredj G, Kenouch S, Mery JP. Changes in erythromycin pharmacokinetics induced by renal failure. Clin Nephrol. 1987;27:147–150. [PubMed] [Google Scholar]
- 21.Yamazaki M, Akiyama S, Nishigaki R, Sugiyama Y. Uptake is the ratelimiting step in the overall hepatic elimination of pravastatin at steady-state in rats. Pharm Res. 1996;13:1559–1564. doi: 10.1023/a:1016044032571. [DOI] [PubMed] [Google Scholar]
- 22.Cummins CL, Salphati L, Reid MJ, Benet LZ. In vivo modulation of intestinal CYP3A metabolism by P-glycoprotein: studies using the rat single-pass intestinal perfusion model. J Pharmacol Exp Ther. 2003;305:306–314. doi: 10.1124/jpet.102.044719. [DOI] [PubMed] [Google Scholar]
- 23.Cummins CL, Jacobsen W, Christians U, Benet LZ. CYP3A4-transfected Caco-2 cells as a tool for understanding biochemical absorption barriers: studies with sirolimus and midazolam. J Pharmacol Exp Ther. 2004;308:143–155. doi: 10.1124/jpet.103.058065. [DOI] [PubMed] [Google Scholar]
- 24.Veau C, et al. Effect of chronic renal failure on the expression and function of rat intestinal P-glycoprotein in drug excretion. Nephrol Dial Transplant. 2001;16:1607–1614. doi: 10.1093/ndt/16.8.1607. [DOI] [PubMed] [Google Scholar]
- 25.Huang ZH, Murakami T, Okochi A, Yumoto R, Nagai J, Takano M. Expression and function of P-glycoprotein in rats with glycerol-induced acute renal failure. Eur J Pharmacol. 2000;406:453–460. doi: 10.1016/s0014-2999(00)00699-3. [DOI] [PubMed] [Google Scholar]
- 26.Naud J, et al. Down-regulation of intestinal drug transporters in chronic renal failure in rats. J Pharmacol Exp Ther. 2007;320:978–985. doi: 10.1124/jpet.106.112631. [DOI] [PubMed] [Google Scholar]
- 27.Naud J, Michaud J, Leblond FA, Lefrancois S, Bonnardeaux A, Pichette V. Effects of chronic renal failure on liver drug transporters. Drug Metab Dispos. 2008;36:124–128. doi: 10.1124/dmd.107.018192. [DOI] [PubMed] [Google Scholar]
- 28.Gupta SK, Atkinson L, Tu T, Longstreth JA. Age and gender related changes in stereoselective pharmacokinetics and pharmacodynamics of verapamil and norverapamil. Br J Clin Pharmacol. 1995;40:325–331. doi: 10.1111/j.1365-2125.1995.tb04554.x. [DOI] [PMC free article] [PubMed] [Google Scholar]
- 29.Krecic-Shepard ME, Barnas CR, Slimko J, Jones MP, Schwartz JB. Gender-specific effects on verapamil pharmacokinetics and pharmacodynamics in humans. J Clin Pharmacol. 2000;40:219–230. doi: 10.1177/00912700022008883. [DOI] [PubMed] [Google Scholar]
- 30.Lam JL, Okochi H, Huang Y, Benet LZ. In vitro and in vivo correlation of hepatic transporter effects on erythromycin metabolism: characterizing the importance of transporter-enzyme interplay. Drug Metab Dispos. 2006;34:1336–1344. doi: 10.1124/dmd.106.009258. [DOI] [PubMed] [Google Scholar]
- 31.Leblond FA, Petrucci M, Dube P, Bernier G, Bonnardeaux A, Pichette V. Downregulation of intestinal cytochrome p450 in chronic renal failure. J Am Soc Nephrol. 2002;13:1579–1585. doi: 10.1097/01.asn.0000017575.50319.77. [DOI] [PubMed] [Google Scholar]
- 32.Kurnik D, Wood AJ, Wilkinson GR. The erythromycin breath test reflects P-glycoprotein function independently of cytochrome P450 3A activity. Clin Pharmacol Ther. 2006;80:228–234. doi: 10.1016/j.clpt.2006.06.002. [DOI] [PubMed] [Google Scholar]
- 33.Frassetto LA, Poon S, Tsourounis C, Valera C, Benet LZ. Effects of uptake and efflux transporter inhibition on erythromycin breath test results. Clin Pharmacol Ther. 2007;81:828–832. doi: 10.1038/sj.clpt.6100148. [DOI] [PubMed] [Google Scholar]
- 34.Lim CF, Bernard BF, de Jong M, Docter R, Krenning EP, Hennemann G. A furan fatty acid and indoxyl sulfate are the putative inhibitors of thyroxine hepatocyte transport in uremia. J Clin Endocrinol Metab. 1993;76:318–324. doi: 10.1210/jcem.76.2.8432774. [DOI] [PubMed] [Google Scholar]
- 35.Fujiwara K, et al. Identification of thyroid hormone transporters in humans: different molecules are involved in a tissue-specific manner. Endocrinology. 2001;142:2005–2012. doi: 10.1210/endo.142.5.8115. [DOI] [PubMed] [Google Scholar]
- 36.Sato M, Koyama M, Miyazaki T, Niwa T. Reduced renal clearance of furancarboxylic acid, a major albumin-bound organic acid, in undialyzed uremic patients. Nephron. 1996;74:419–421. doi: 10.1159/000189346. [DOI] [PubMed] [Google Scholar]
- 37.Sassa T, et al. Measurement of furancarboxylic acid, a candidate for uremic toxin, in human serum, hair, and sweat, and analysis of pharmacological actions in vitro. Arch Toxicol. 2000;73:649–654. doi: 10.1007/s002040050020. [DOI] [PubMed] [Google Scholar]
- 38.Niwa T, Takeda N, Maeda K, Shibata M, Tatematsu A. Accumulation of furancarboxylic acids in uremic serum as inhibitors of drug binding. Clin Chim Acta. 1988;173:127–138. doi: 10.1016/0009-8981(88)90250-1. [DOI] [PubMed] [Google Scholar]
- 39.Vanholder R, Hoefliger N, De Smet R, Ringoir S. Extraction of protein bound ligands from azotemic sera: comparison of 12 deproteinization methods. Kidney Int. 1992;41:1707–1712. doi: 10.1038/ki.1992.244. [DOI] [PubMed] [Google Scholar]
- 40.Cummins CL, Wu CY, Benet LZ. Sex-related differences in the clearance of cytochrome P450 3A4 substrates may be caused by P-glycoprotein. Clin Pharmacol Ther. 2002;72:474–489. doi: 10.1067/mcp.2002.128388. [DOI] [PubMed] [Google Scholar]
- 41.Schwartz JB. The influence of sex on pharmacokinetics. Clin Pharmacokinet. 2003;42:107–121. doi: 10.2165/00003088-200342020-00001. [DOI] [PubMed] [Google Scholar]
- 42.Gandhi M, Aweeka F, Greenblatt RM, Blaschke TF. Sex differences in pharmacokinetics and pharmacodynamics. Annu Rev Pharmacol Toxicol. 2004;44:499–523. doi: 10.1146/annurev.pharmtox.44.101802.121453. [DOI] [PubMed] [Google Scholar]
- 43.Wolbold R, et al. Sex is a major determinant of CYP3A4 expression in human liver. Hepatology. 2003;38:978–988. doi: 10.1053/jhep.2003.50393. [DOI] [PubMed] [Google Scholar]
- 44.Paine MF, Ludington SS, Chen ML, Stewart PW, Huang SM, Watkins PB. Do men and women differ in proximal small intestinal CYP3A or P-glycoprotein expression? Drug Metab Dispos. 2005;33:426–433. doi: 10.1124/dmd.104.002469. [DOI] [PubMed] [Google Scholar]
- 45.Michaud J, et al. Role of parathyroid hormone in the downregulation of liver cytochrome P450 in chronic renal failure. J Am Soc Nephrol. 2006;17:3041–3048. doi: 10.1681/ASN.2006010035. [DOI] [PubMed] [Google Scholar]
- 46.Nolin TD, Appiah K, Kendrick SA, Le P, McMonagle E, Himmelfarb J. Hemodialysis acutely improves hepatic CYP3A4 metabolic activity. J Am Soc Nephrol. 2006;17:2363–2367. doi: 10.1681/ASN.2006060610. [DOI] [PubMed] [Google Scholar]
- 47.Levey AS, et al. National Kidney Foundation. National Kidney Foundation practice guidelines for chronic kidney disease: evaluation, classification, and stratification. Ann Intern Med. 2003;139:137–147. doi: 10.7326/0003-4819-139-2-200307150-00013. [DOI] [PubMed] [Google Scholar]
- 48.Huang Y, Sun H, Frassetto L, Benet LZ, Lin ET. Liquid chromatographic tandem mass spectrometric assay for the uremic toxin 3-carboxy-4-methyl-5-propyl-2-furanpropionic acid in human plasma. Rapid Commun Mass Spectrom. 2006;20:1611–1614. doi: 10.1002/rcm.2479. [DOI] [PubMed] [Google Scholar]
- 49.Mather LE, Austin KL, Philpot CR, McDonald PJ. Absorption and bioavailability of oral erythromycin. Br J Clin Pharmacol. 1981;12:131–140. doi: 10.1111/j.1365-2125.1981.tb01191.x. [DOI] [PMC free article] [PubMed] [Google Scholar]