Abstract
Hepatocyte nuclear factor 4 alpha (HNF4α), a member of the nuclear receptor superfamily, is essential for liver function and is linked to several diseases including diabetes, hemophilia, atherosclerosis, and hepatitis. Although many DNA response elements and target genes have been identified for HNF4α the complete repertoire of binding sites and target genes in the human genome is unknown. Here, we adapt protein binding microarrays (PBMs) to examine the DNA-binding characteristics of two HNF4α species (rat and human) and isoforms (HNF4α2 and HNF4α8) in a high-throughput fashion. We identified ~1400 new binding sequences and used this dataset to successfully train a Support Vector Machine (SVM)model that predicts an additional ~10,000 unique HNF4α-binding sequences; we also identify new rules for HNF4α DNA binding. We performed expression profiling of an HNF4α RNA interference knockdown in HepG2 cells and compared the results to a search of the promoters of all human genes with the PBM and SVM models, as well as published genome-wide location analysis. Using this integrated approach, we identified ~240 new direct HNF4α human target genes, including new functional categories of genes not typically associated with HNF4α, such as cell cycle, immune function, apoptosis, stress response, and other cancer-related genes.
Conclusion
We report the first use of PBMs with a full-length liver-enriched transcription factor and greatly expand the repertoire of HNF4α-binding sequences and target genes, thereby identifying new functions for HNF4α. We also establish a web-based tool, HNF4 Motif Finder, that can be used to identify potential HNF4α-binding sites in any sequence.
Hepatocyte nuclear factor 4α, HNF4α (HNF4A), is a member of the nuclear receptor superfamily of ligand-dependent transcription factors (NR2A1) and a liver-enriched transcription factor (TF) that is also expressed in the kidney, pancreas, intestine, colon, and stomach.1 Originally identified based on its ability to bind DNA response elements in the human apolipoprotein C3 (APOC3) and mouse transthyretin (Ttr) promoters,2 HNF4α has since been shown to play a critical role in both the development of the embryo and the adult liver.3,4 Mutations in the HNF4A coding sequence and promoter regions are linked to Maturity Onset Diabetes of the Young 1 (MODY1),5 and mutations in HNF4α response elements have been directly linked to disease, most notably in genes encoding blood coagulation factors in hemophilia and in HNF1α in MODY3.6–8 Through classical promoter analysis, functional HNF4α-binding sites have been identified in >140 genes, including those involved in the metabolism of glucose, lipids, and amino acids, as well as xenobiotics and drugs1,4,9 (see Supporting Table 1A for a listing of those genes). Recent genome-wide location analyses suggest that the number of HNF4α targets may be much greater (>1000) based on widespread binding of HNF4α to promoter regions,10–12 although it is not known how many of those are functional targets. A more comprehensive list of direct HNF4α targets was recently made even more critical with our finding that HNF4α binds an exchangeable ligand and hence may be a potential drug target.13
HNF4α binds DNA exclusively as a homodimer.14,15 The canonical HNF4α consensus sequence consists of the half site AGGTCA with one nucleotide spacer (referred to as a DR1, AGGTCA×AGGTCA).16 Whereas the number of experimentally verified HNF4α binding sequences is sizable (>217) (Supporting Tables 1A and 1B), they were derived in a biased fashion building on the first HNF4α-binding sites,2 and subsequently on the direct repeat rules for nuclear receptor DNA binding.16 Furthermore, the total number of 13-base oligomer (13-mer) permutations is much greater than 217 (413 ~ 67 million), and whereas HNF4α will certainly not bind all potential 13-mers, the total number of DNA sequences that will bind HNF4α is anticipated to be in the tens of thousands. Because the presence of one or more HNF4α response elements in the promoter region of a gene is a prerequisite for classification as a direct HNF4α target, it is desirable to accurately predict all the HNF4α-binding sites throughout the genome in an unbiased fashion.
Recent genome-wide technologies, most notably genome-wide location analysis (i.e., chromatin immunoprecipitation [ChIP] followed by tiling arrays, known as “ChIP-chip”) and expression profiling, have greatly accelerated the identification of target genes for many TFs, including HNF4α. However, as powerful as those technologies are, they provide information only about the state of the cells used in the assay, not about any other physiological or pathological state. Furthermore, expression profiling cannot indicate whether a gene is a direct or an indirect target and ChIP does not provide any information about whether the gene is expressed by the bound TF. And neither assay allows one to precisely identify the sequence to which the TF binds. The third tool in the genomic arsenal—computational prediction of target genes—is curiously less developed than the other two. Although many attempts have been made at predicting TF binding sites, including our own for HNF4α,17 this approach still suffers from a lack of sizable datasets of verified binding sites.
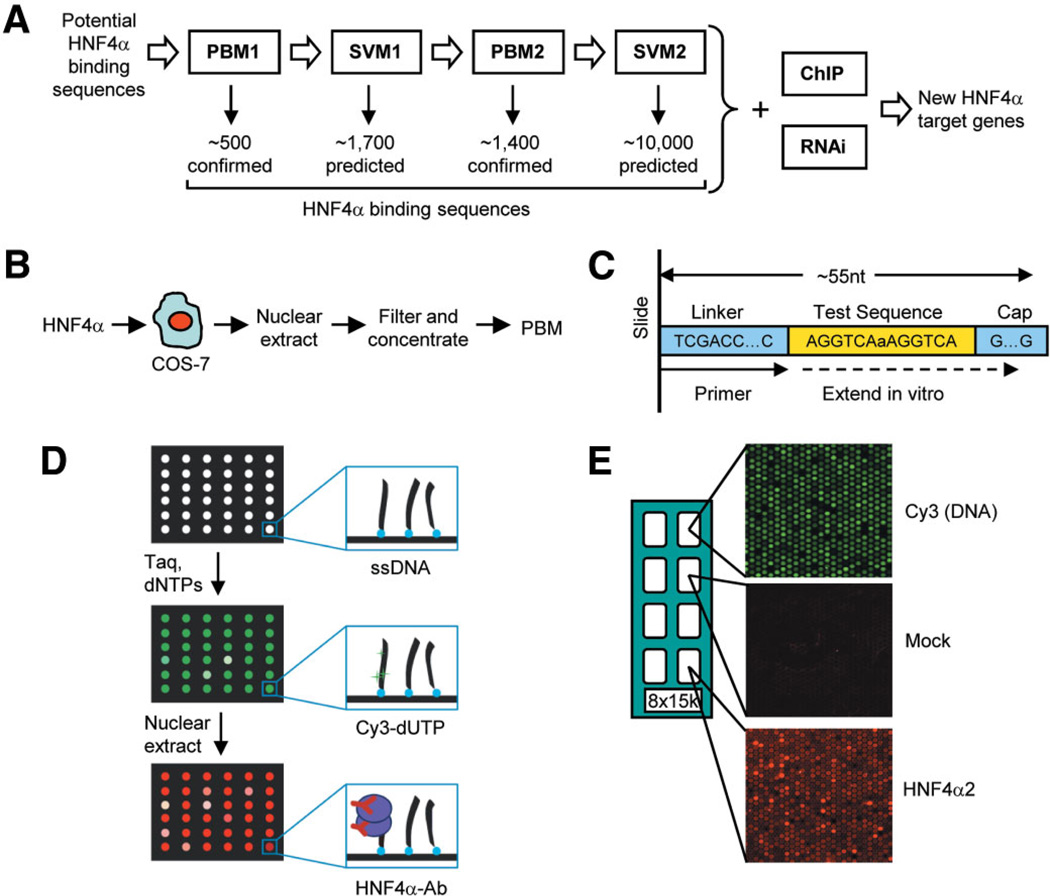
To improve the prediction of potential HNF4α target genes, we adapted the protein binding microarray (PBM) technology to rank thousands of HNF4α sequences based on their relative binding affinities using full-length protein expressed in mammalian cells. We compare two species of HNF4α (rat and human) and two tissue-specific isoforms (HNF4α2 and HNF4α8). Additionally, we use a Support Vector Machine (SVM), a powerful machine learning model to predict additional HNF4α-binding sequences with high accuracy. Finally, we combine the PBM and SVM binding site searches with expression profiling performed here and ChIP-chip performed by others to identify ~240 new direct target genes of HNF4α in cells of hepatic origin (see Fig. 1A for an overview).
Fig. 1.
Integrated approach for the identification of direct target genes and protein binding microarray (PBM) design. (A) Overview of workflow. Known and predicted HNF4α-binding sequences (217 sequences from the literature, sites predicted by the Markov model and ChIP-chip analysis, and random controls) were printed on the first-generation PBM (PBM1) and incubated with minimally processed crude nuclear extracts from COS-7 cells transfected with full-length HNF4α (B). Results from the initial screen were used to train the Support Vector Machine (SVM1), resulting in 1700 predicted HNF4α-binding sequences that were printed onto a second-generation PBM (PBM2). Searches of human promoters using PBM/SVM results were cross-referenced with results from RNAi expression profiling and ChIP-chip to identify new HNF4α targets. (C, D) Overview of PBM. Single-stranded oligonucleotides with a common linker, test sequence, and a G/C-rich cap region (C) printed on the PBM were extended in vitro in the presence of Cy3-dUTP (D). The PBMs were incubated with extracts containing HNF4α and visualized by immunofluorescence. (E) Typical PBM results are shown. Double-stranded DNA with Cy3 incorporated (top panel), mock-transfected cells lacking HNF4α (middle panel), and extracts containing HNF4α with fluorescent signal proportional to the binding affinity (bottom panel). An array of 8 × 15k, Agilent microarray slide with eight replicate subarrays with ~3000 unique sequences each spotted five times (~15,000 spots) per subarray. Supporting Fig. 1 shows that nontransfected COS-7 cells do not express HNF4α and that the antibody used to detect HNF4α in the PBM is completely specific. Supporting Fig. 2 shows a linear relationship between Cy3 incorporation and the number of A’s in the extended sequence.
Materials and Methods
See Supporting Materials and Methods for additional details.
Preparation of HNF4α Proteins in COS-7 Cells
Nuclear extracts were prepared from COS-7 cells transiently transfected with HNF4α expression vectors as previously described.15 Mock-transfected samples contained no DNA. Crude nuclear extracts were filtered and concentrated using Microcon Ultracel YM-30 filters (Millipore, Bedford, MA) and applied directly to the PBM (Fig. 1B), except for purified samples that were immunoprecipitated from the crude extracts with the α445 antibody2 (Fig. 2A) and then peptide-eluted.
Fig. 2.
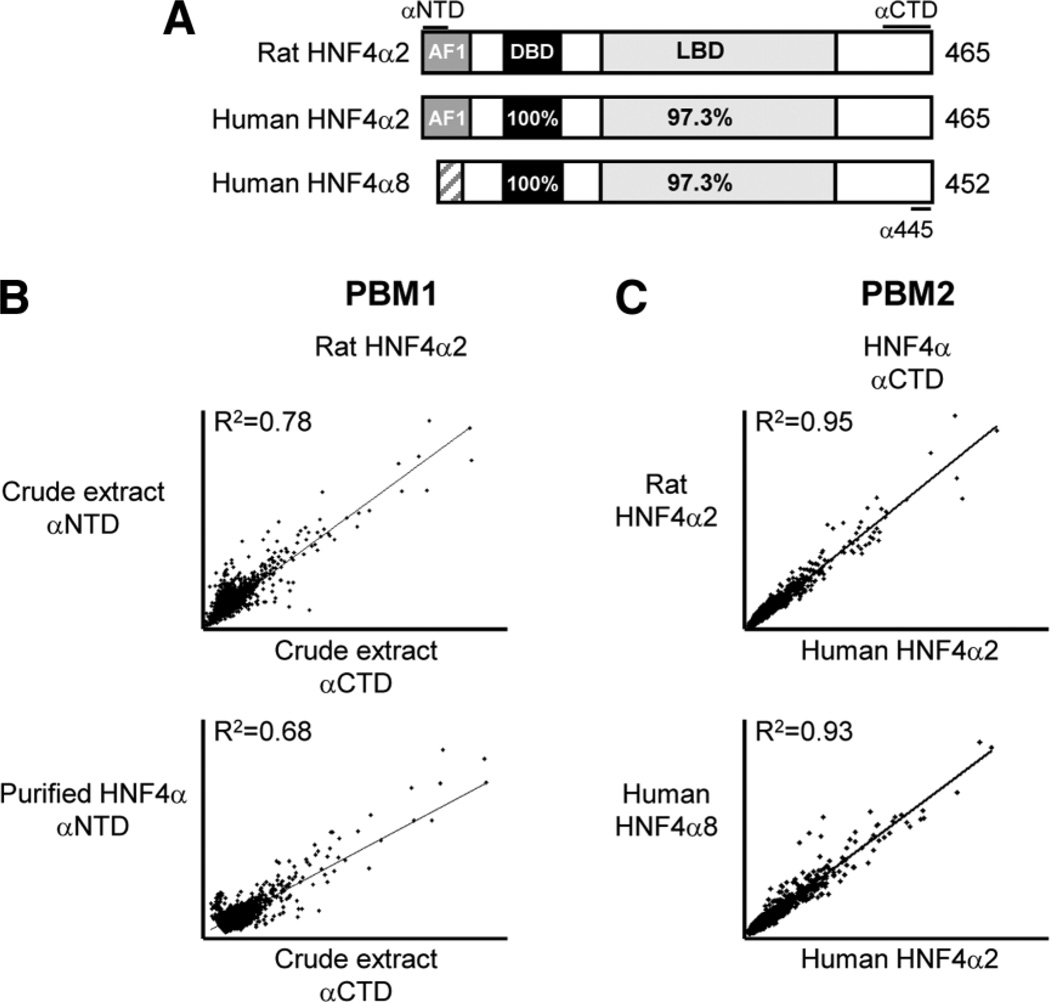
Reproducibility of the PBM. (A) Diagram of HNF4α splice variants used in PBM indicating percent amino acid identity in conserved regions. AF1, activation function 1; DBD, DNA-binding domain; LBD, ligand-binding domain. The regions of the protein detected by the monoclonal antibodies (αNTD, amino-terminal HNF4α antibody; αCTD, carboxy-terminal HNF4α antibody) and the affinity-purified polyclonal antibody α445 are indicated. (See Supporting Materials and Methods for additional details on plasmids and antibodies.) (B) Scatter plot of individual spot intensities showing correlation between PBM1 using rat HNF4α2 protein and the αNTD and αCTD antibodies (top panel) as well as purified HNF4α2 versus crude nuclear extracts (bottom panel). (C) Scatter plot of PBM2 results as in (B) comparing different HNF4α isoforms from different species. See Supporting Figs. 3 and 4 for scatter plot matrices of PBM1 and PBM2 from nine experiments.
Protein Binding Microarrays
Custom 8 × 15k arrays of single-stranded 42-mer to 51-mer oligonucleotides (Agilent Technologies, Santa Clara, CA) were extended on the slide in the presence of Cy3 deoxyuridine triphosphate (dUTP) using a universal primer (Fig. 1C–E) as described in Bulyk.18 Both PBM1 and PBM2 contained 3000 unique sequences replicated five times, including random controls, sequences collected from the literature, mined from ChIP-chip datasets,11,19 and derived from variations on the consensus 5′-AGGTCAaAGGTCA-3′. PBM2 contained sequences derived from PBM1 and sequences predicted by SVM1 on human promoter regions and the regions reported in ChIP-chip11 (for a complete list of sequences on PBM1 and PBM2, see Supporting Tables 2A and 2B, respectively). Briefly, PBMs were premoistened, incubated with HNF4α protein for 1 hour, washed, and then incubated with the indicated antibodies. All washes and incubations were performed at room temperature (27°C). PBMs were scanned using a GenePix Axon 4000B scanner (Molecular Devices, Sunnyvale, CA) at 543 nm (Cy3) dUTP and 633 nm (Cy5-conjugated secondary antibody). Signals were gradient-corrected using Micro-Array NORmalization of array–Comparative Genomic Hybridization data (MANOR) implemented in R.20 Cross-array and intra-array normalization was performed using quantile normalization,21 enabling comparison between independent experiments. Replicates for each probe were averaged, and only probes with a coefficient of variation less than 0.3 were used to train the SVM.
SVM Training and Binding Sequence Analysis
The Kernel-based SVM (KSVM) function from Kernlab package in R with Laplace dot kernel was used to train the model (SVM1) in the classification mode22 using results averaged from independent PBM1 experiments. SVM1 was then used to generate sequences for PBM2. Another SVM model in the regression mode was trained on the results of the PBM2 experiments (SVM2). For a complete list of sequences in the SVM1 and SVM2 training data, see Supporting Tables 4A and 4B, respectively. The human genome (University of California Santa Cruz [UCSC] Human Genome Browser, UCSC hg18) was searched with the binding sequences from PBM2 and the predicted binding sequences from SVM2 using the sliding window approach.
RNA Interference and Expression Profiling Analysis
RNA interference (RNAi) against HNF4α2 was performed in HepG2 cells using small, interfering RNAs (siRNAs) corresponding to nucleotides +179 to +197 of human HNF4A (NM_178849, sense siRNA: 5′-UGUGCAGGUGUUGACGAUGdTdT-3′, antisense siRNA 5′-CAUCGUCAACACCUGCACAdTdT-3′) (Dharmacon, Lafayette, CO). Total RNA was extracted with Trizol (Life Technologies, Carlsbad, CA) and reverse transcribed with the Reverse Transcription System (Promega, Madison, WI). Polymerase chain reaction (PCR) amplification was performed in the linear range (see Supporting Table 3B for a list of PCR primers). Expression profiling analysis was performed with Affymetrix oligonucleotide arrays (HGU133 Plus 2.0) using RNA from control (PGL3 siRNA) or treated (HNF4α siRNA) HepG2 cells, and analyzed as previously described.13
Chromatin Immunoprecipitation and ChIP-Chip Analysis
ChIP for HNF4α from HepG2 cells on the Ninjurin 1 (NINJ1) promoter was carried out as previously described.23 HNF4α ChIP-chip data from primary human hepatocytes11 were extracted from ArrayExpress database, reanalyzed with the Bioconductor package LIMMA and ACME,24,25 and subsequently visualized using Integrated Genome Browser (IGB; Affymetrix, Santa Clara, CA).
Results
Protein-Binding Microarrays Using Full-Length HNF4α in Crude Nuclear Extracts
PBMs are a high-throughput in vitro DNA binding assay that allow for the examination of TF binding to thousands of unique sequences in a single experiment.26 Recently, PBMs have been used to define the DNA-binding specificity of large classes of TFs27,28 and have been shown to correlate well with gel shift results.29 Whereas as others have pioneered the technology using the DNA-binding domain (DBD) of TFs purified from bacteria, here we adapt the PBM technology to more closely approximate physiological conditions. Because HNF4α has a very strong dimerization domain outside of the DBD and a very low affinity for DNA when expressed in bacteria,14,30,31 we ectopically expressed full-length, native HNF4α in COS-7 cells and prepared minimally processed nuclear extracts (Fig. 1B) that we then applied directly to a PBM specifically designed for HNF4α (Fig. 1C,D). The PBM was developed with a highly specific antibody to the C-terminus of HNF4α (Supporting Fig. 1), allowing us to examine a completely native TF. The full-length HNF4α protein in the crude extracts yielded an excellent signal with a range of intensities, whereas extracts from mock-transfected cells yielded no reproducible signals (Fig. 1E).
Reproducibility and Utility of Adapted Protein-Binding Microarrays
We compared two species (rat and human) and two isoforms of HNF4α (HNF4α2 and HNF4α8), as well as antibodies that recognized different regions of HNF4α (Fig. 2A). There was an excellent correlation between replicate arrays in the first-generation PBM (PBM1) using crude nuclear extracts, regardless of antibody used (R2 = 0.78), and results with affinity-purified protein were very similar to those with crude extracts (R2 = 0.68) (Fig. 2B). In a second generation of the PBM (PBM2), different HNF4α isoforms (HNF4α2 versus HNF4α8) and species (human versus rat) also produced excellent correlations (R2 > 0.9), indicating that these isoform and species differences do not influence the binding of HNF4α to DNA. This is not surprising considering that the DBD is identical in these constructs (Fig. 2A).
Accuracy of PBM and SVM
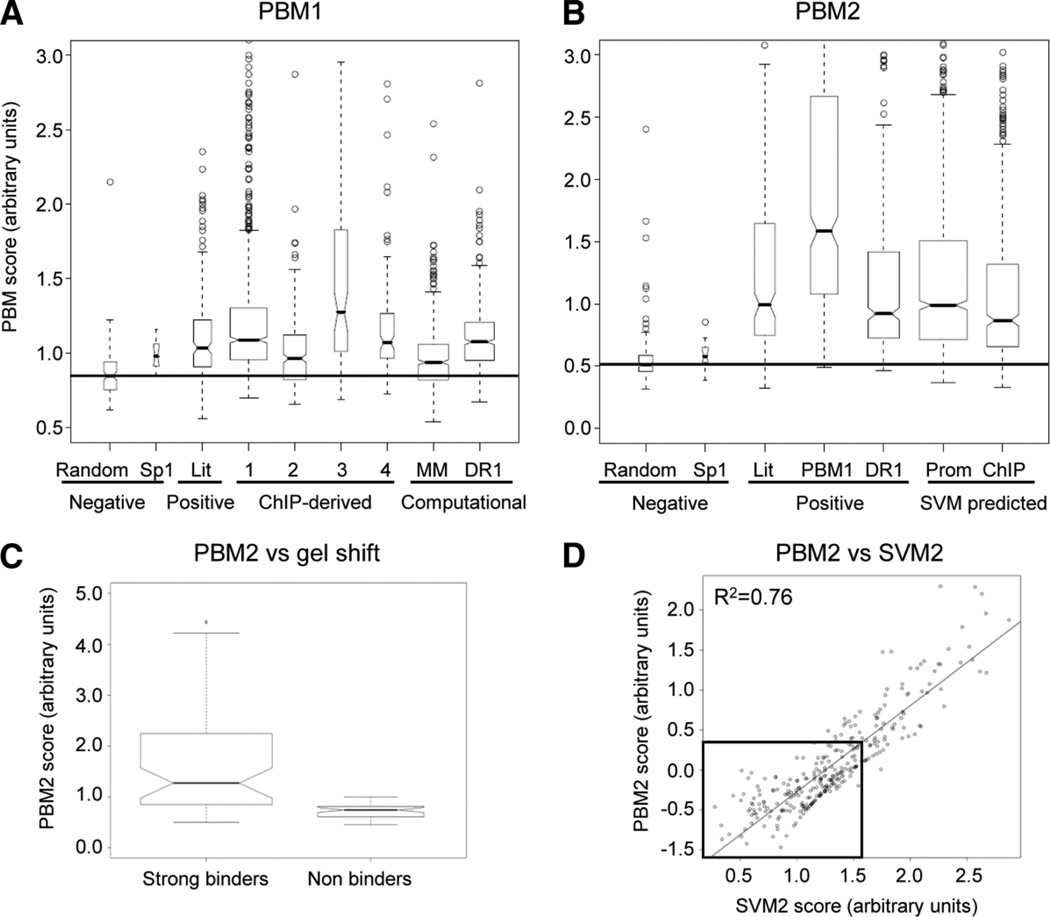
PBM1 identified ~500 new HNF4α binding sequences with the DR1-derived sequences exhibiting the best binding affinities relative to negative controls (P < 8.274 × 10⁻¹²) (Fig. 3A). Sequences derived from ChIP-chip analysis bound roughly as well as the DR1 variants. In PBM2, an additional ~1000 novel sequences that strongly bind HNF4α were identified, including sequences identified by SVM1. The signal-to-noise ratio (literature-derived versus random sites) was also significantly improved in PBM2 due to optimization of the binding conditions (P < 2.6 × 10⁻¹¹ versus P < 2.6 × 10⁻¹⁶, respectively, using the Student t test) (Fig. 3B). The PBM2 results also correlated very well with gel shift results (Fig. 3C). Additionally, SVM2 derived from PBM2 predicted binding sequences with a high degree of accuracy (R2 = 0.76) (Fig. 3D)
Fig. 3.
Relative binding affinities of HNF4α-binding sites. (A) Box plot of sequence categories represented on PBM1 and corresponding PBM score averaged from six independent arrays with each sequence spotted five times. Box width indicates the relative number of sequences per category. Nonoverlapping box plot notches strongly indicate that the medians significantly differ (P < 0.05). Boxes and whiskers (dashed line) represent quartiles of binding scores for each sequence category. Line, median of random sequences. Negative controls = randomly generated 13-mers; known Sp1 sites derived from the literature. Positive controls = 217 known HNF4α-binding sites from the literature (Lit) (Supporting Tables 1A and 1B). ChIP-derived, binding sites derived from published HNF4α ChIP-chip data: 1, from Odom et al.11; 2, from Rada-Iglesias et al.12; 3, our analysis of Odom et al. data using Bioprospector software; 4, our analysis of Odom et al. data using AlignACE software. Computational, binding sequences derived from our permutated Markov model (MM)17 and permutations of the DR1 consensus sequence (DR1). (B) Box plot of sequence categories represented in PBM2 (three independent arrays) as in (A). PBM1, best 500 sequences from PBM1; SVM predicted, sequences from SVM1 search of promoter regions of all annotated human genes (Prom) and ChIP-chip data (ChIP).11 For a complete list of all the sequences on PBM1 and PBM2 and binding scores, see Supporting Tables 2A and 2B. (C) Box plot of PBM2 results versus results from ~100 gel shift experiments showing a statistically significant difference (Student t test, P < 0.00622) between strong binders and nonbinders or very weak binders (see Supporting Materials and Methods and Supporting Fig. 6 for results). (D) Scatter plot of log(PBM2) intensity compared to SVM2 score of one of the 10-fold cross validation results used to evaluate the predictive power of SVM2. A cutoff of an SVM2 score >1.51, corresponding to three standard deviations from the mean of random controls, was used to identify binding sequences in subsequent analyses.
Identification of New “Rules” for HNF4α DNA Binding by PBM
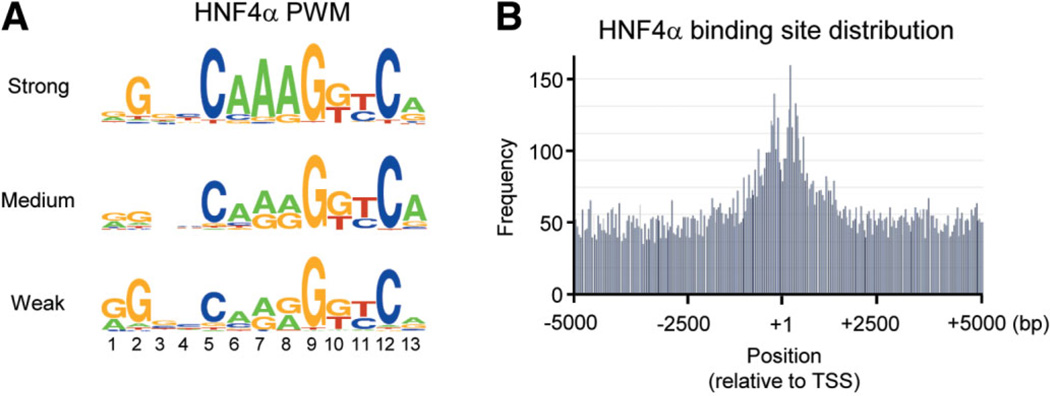
Even though position weight matrices (PWMs) do not capture the interdependence between the positions in a motif as do PBMs and SVMs, they are useful for describing motifs. Interestingly, the PWM of the ~450 sequences that yielded the greatest binding intensity in PBM2 (“strong binders”) did not strictly follow the DR1 rule of AGGTCA×AGGTCA. Rather, a core sequence of CAAAG is the most prominent feature, with the classical AGGTCA half-site evident only on the 3′ side (Fig. 4A), a finding supported by the recent crystallographic structure of the HNF4α DBD on DNA in which fewer hydrogen bonds were observed between the HNF4α protein and the 5′ half site.32 In the PWMs for the medium and weak binding motifs, the three A’s in the core appeared less frequently.
Fig. 4.
Position weight matrix (PWM) for HNF4α-binding sequence motif and HNF4α-binding site distribution. (A) PWM of HNF4α-binding sequences derived from PBM2. All sequences with relative binding affinity at least 2 standard deviations above the mean of the random controls were divided into three groups of ~450 each—strong, medium and weak—and used to generate the PWMs.43 (B) Distribution of potential HNF4α-binding sites around the transcription start site (TSS, +1) of all human promoters (UCSC hg18) as determined by an exact match search with PBM2 results. Sites are overrepresented in the −1 kb to +1 kb region. (See Supporting Fig. 7 for PWM and gel shifts of noncanonical binding sites detected in the PBM.)
Using ~1400 strong HNF4α-binding sequences obtained from PBM2, we determined the distribution of potential HNF4α-binding sites in the human genome and found a broad distribution of sites with an enrichment within ~1 kilobase (kb) of the transcription start site (+1) (Fig. 4B). This is in contrast to profiles of sites for some other TFs, such as Sp1 and ELK1, that are found more exclusively near +1,33 but is consistent with the fact that there are many well-characterized HNF4α sites far from +1. We also found a small percentage (<1%) of sites that bound HNF4α well in PBM2 but did not contain the CAAAG core (see Supporting Fig. 7 for the PWM and gel shift assay), but the biological relevance of these sequences remains to be verified.
Expression Profiling of an HNF4α RNAi Knockdown in Hepatic Cells
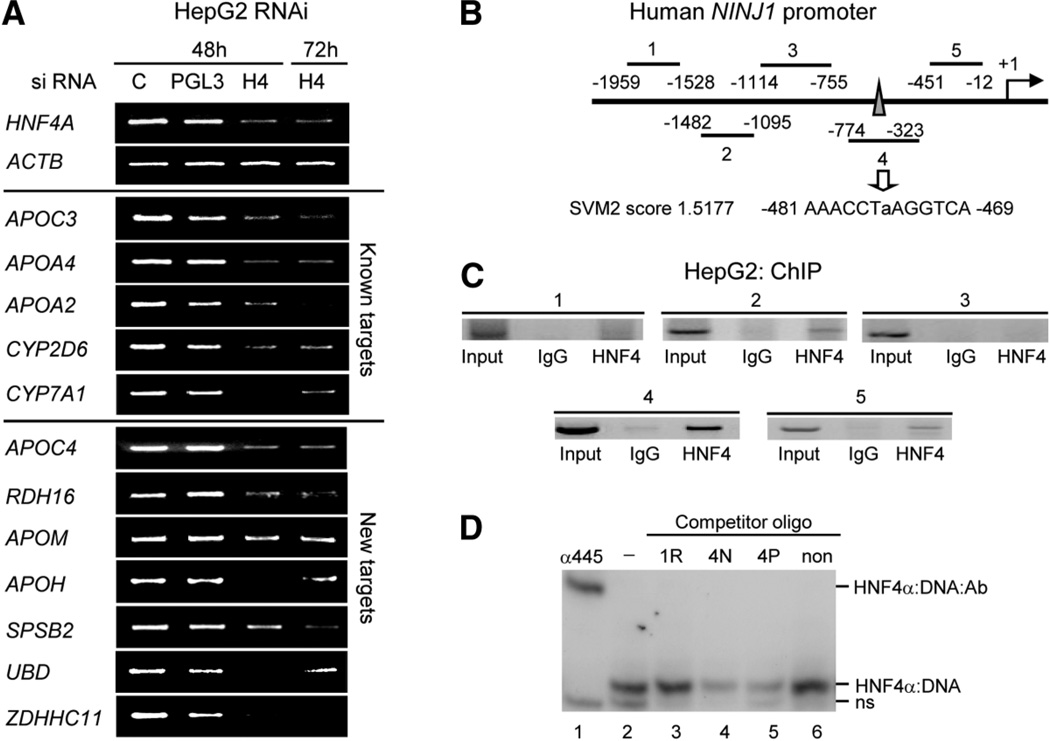
To identify functional HNF4α target genes, we used RNAi to knock down HNF4α2 expression in HepG2 cells, a human hepatocellular carcinoma cell line that expresses endogenous HNF4α and many liver-specific genes (Fig. 5A, top panels and Supporting Fig. 5). Using the SVM2 model, we predicted several other potential HNF4α target genes and determined that they were also down-regulated by reverse transcription PCR (APOC4, RDH16, APOM, APOH, SPSB2, UBD, ZDHHC11) (Fig. 5A, bottom panel). Whole-genome expression profiling identified ~1500 additional genes that were down-regulated (see Supporting Table 3A for a complete list). Interestingly, the gene that was down-regulated the most—Ninjurin 1 (NINJ1) (12.5-fold)—is not a gene typically associated with HNF4α function (i.e., intermediary metabolism); rather, it is involved in regulating the cell cycle. In order to determine whether NINJ1 is a direct target of HNF4α, we used SVM2 to identify a potential HNF4α binding site within the NINJ1 promoter region (Fig. 5B) and subsequently verified that it was bound by HNF4α in vivo using a ChIP assay (Fig. 5C) and in vitro using a gel shift assay (Fig. 5D); these results suggest that NINJ1 is indeed a direct target of HNF4α.
Fig. 5.
HNF4α knockdown in HepG2 cells using RNAi and identification of Ninjurin 1 as a direct target of HNF4α. (A) Verification of HNF4α1/2 knockdown. HepG2 cells treated with siRNA for the hours indicated. Reverse transcription PCR was performed on the indicated HNF4α targets. C, no siRNA. PGL3, control siRNA. H4, HNF4α siRNA (all splice variants from the P1 promoter are targeted). (B) Human NINJ1 promoter showing regions amplified by PCR in ChIP in (C). Region 4 contains a predicted HNF4α-binding site with an SVM2 score of ~1.5177 (moderate binding affinity). (C) ChIP result of HNF4α in HepG2 cells on the human NINJ1 promoter using PCR primers that amplify regions 1–4 noted in (B). IgG, normal rabbit immunoglobulin G; HNF4, α445 antibody. (D) Gel shift assay using nuclear extracts from COS-7 cells transfected with rat HNF4α2, radiolabeled probe from the ApoA1 promoter and unlabeled competitors in 250-fold molar excess corresponding to the SVM site identified in region 4 with native flanking sequences (4N) or PBM flanking sequences (4P) as well as a known nonbinder (non, 175 TTR) and a randomly chosen sequence from region 1 (1R). Shown are the HNF4α:DNA shift complex, a supershift complex with the α445 antibody (HNF4α:DNA:antibody) and nonspecific band from the COS-7 extracts (ns); free probe is not shown. See Supporting Materials and Methods for details on gel shift conditions, Supporting Fig. 5 for immunoblot of HNF4α protein in the RNAi, Supporting Table 3A for a complete list of genes that are down-regulated, Supporting Table 3B for primer sequences, and Supporting Table 8 for gel shift sequences.
Gene Ontology Analysis Reveals Complementary Nature of PBM, Expression Profiling, and ChIP Analysis
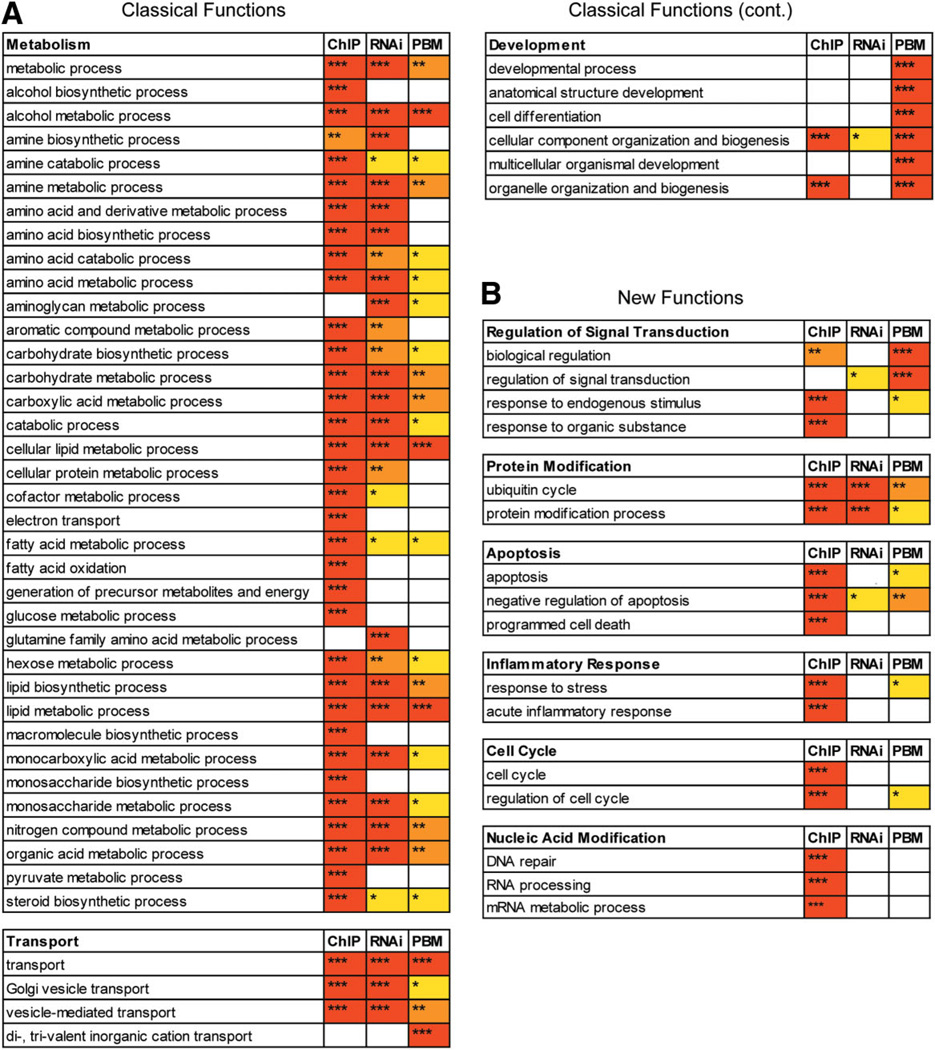
To compare the different methods of predicting target genes, we performed Gene Ontology (GO) on the HNF4α targets predicted by RNAi expression profiling and the PBM2 search (−2 kb to +1 kb), as well as on published HNF4α ChIP-chip results from primary human hepatocytes11 (Fig. 6). In general, six broad biological processes contained significant GO terms for all three assays—metabolism, transport, development, regulation of signal transduction, protein modification, and apoptosis—showing the overlapping nature of the three assays. There were three additional categories—inflammatory response, cell cycle, and nucleic acid metabolism—in which genes from at least one but not all three assays were over-represented. The most notable difference between the PBM2 search from the other assays was an enrichment of genes involved in developmental processes. This is consistent with the known role of HNF4α in early development,34 and could be explained by the fact that the cells used in the ChIP-chip and RNAi assays are from adult stages, not embryonic stages. In general, the ChIP assay yielded more significant GO terms in all categories, which is most likely a reflection of the more specific nature of this assay and the stringent cutoff values used.
Fig. 6.
Comparative Gene Ontology for genes bound in vivo by HNF4α (ChIP-chip), down-regulated in HNF4α RNAi, and containing PBM or SVM HNF4α binding sites. Overrepresented categories from Gene Ontology analysis using DAVID44 of HNF4α ChIP-chip from primary human hepatocytes11 (ChIP), expression profiling of HNF4α knocked down in HepG2 cells using RNAi (RNAi) and PBM2 search of −2 kb to +1 kb of all annotated human genes (UCSC hg18) (PBM). Shown are the biological processes for which at least one of the three methods had a P value (EASE-score) of < 0.001 (***), < 0.01 (**), or < 0.05 (*). Redundant categories were removed. (A) Biological processes related to classical HNF4α target genes well-established in the literature (e.g., Supporting Table 1A). (B) Biological processes not typically associated with HNF4α. See Supporting Table 5 for a complete list of GO terms and P values for the ChIP, PBM, and RNAi as well as the SVM search (≥4 sites in −2 kb to +1 kb).
Identification of New HNF4α Target Genes and New Functions
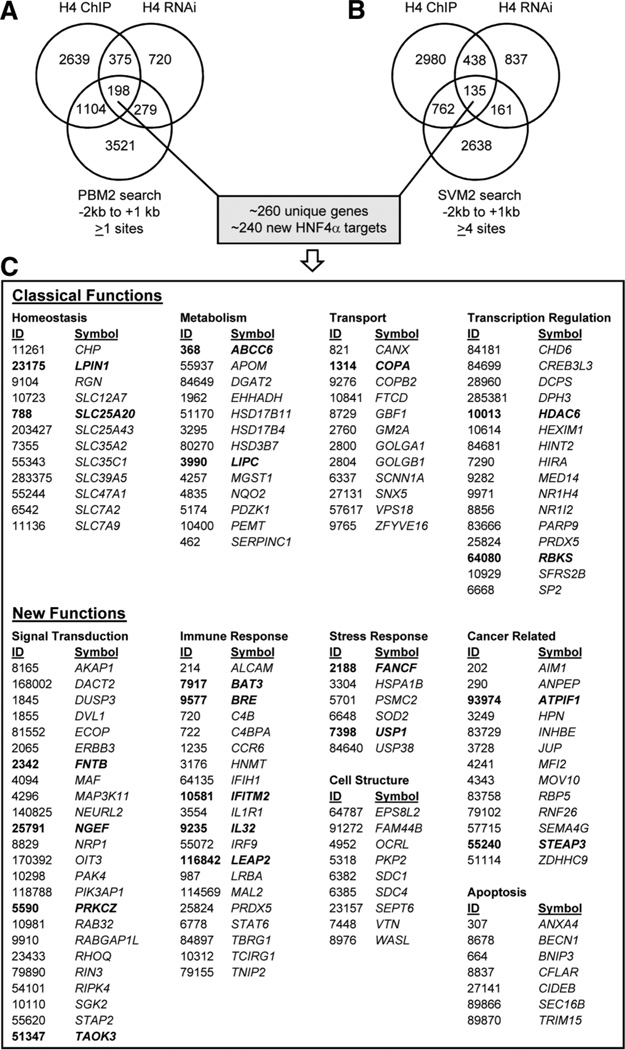
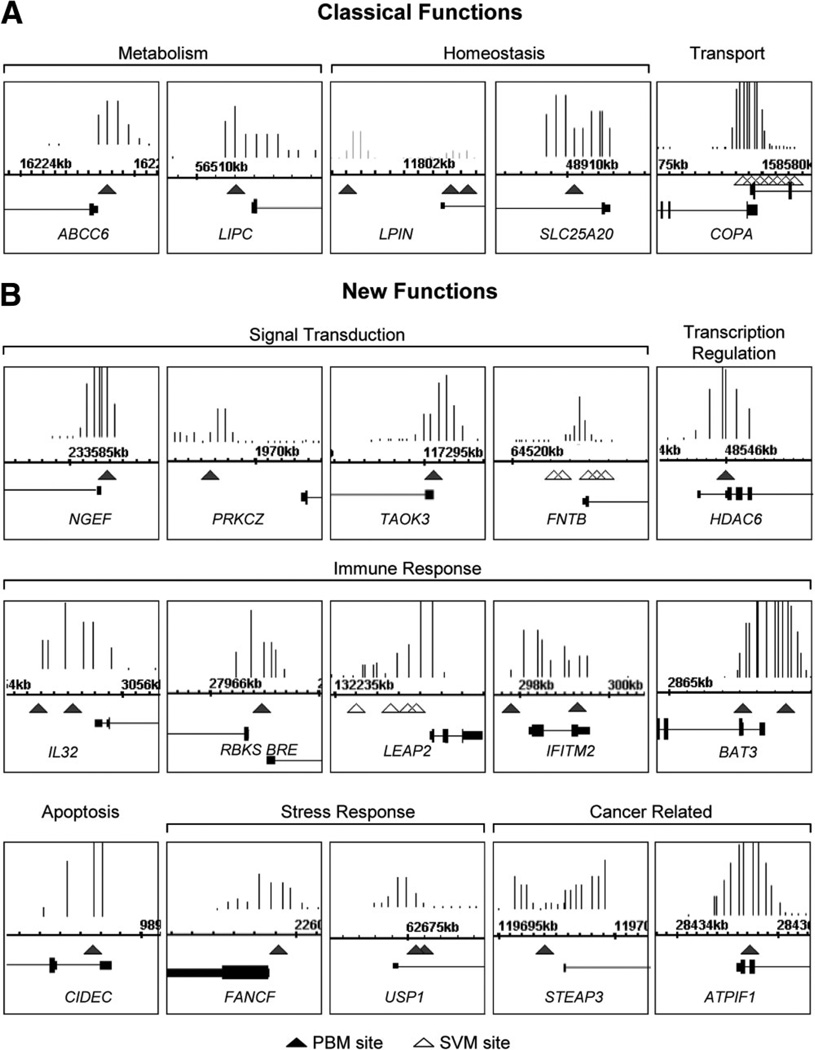
In order to more closely compare the three methods of identifying potential target genes, we cross-referenced the PBM2 search results with the HNF4α RNAi and ChIP-chip results. We identified 198 genes that were positive in all three categories, i.e., bound by HNF4α in ChIP-chip, down-regulated by HNF4α in HepG2 RNAi, and containing one or more verified HNF4α-binding sites in the −2 kb to +1 kb region of the promoter (Fig. 7A). A similar analysis with the SVM2 search yielded 135 genes (Fig. 7B). Among these two categories, there were ~260 nonredundant genes, of which ~240 were not in the original list of HNF4α target genes from the literature (Supporting Table 1A). Several of these genes are new targets within known categories of HNF4α targets (e.g., homeostasis = solute carrier proteins, SLC genes; lipid metabolism = e.g., ABCC6, DGAT2, hydroxysteroid dehydrogenase [HSDs] genes), or more recently identified targets of HNF4α (e.g., CREB3L3, NR1I2, NR1H4, DO1).35–38 There were also many genes that, like NINJ1, are in completely new categories of genes not typically associated with HNF4α (e.g., signal transduction, immune response, stress response, apoptosis, cancer related, and cell structure) (Fig. 7C), several of which are reminiscent of the new functional categories identified by GO (Fig. 6). In order to determine whether the ChIP signal overlapped with the PBM or SVM sites in these new targets, all three datasets were visualized using Integrated Genome Browser. Although not all ChIP signals aligned exactly with the PBM or SVM sites, a very large number did; a sampling of these are shown in Fig. 8.
Fig. 7.
Cross-reference of three methods used to identify potential human HNF4α target genes: ChIP-chip, RNAi expression profiling, and PBM/SVM binding site search. (A) Venn analysis of genes: bound by HNF4α in primary human hepatocytes (H4 ChIP)11; down-regulated in expression profiling by HNF4α siRNA in HepG2 cells (H4 RNAi) (Fig. 5); and containing a potential HNF4α-binding site as determined by an exact match search using PBM2 results of annotated human genes (UCSC hg18) −2 kb to +1 kb relative to the TSS (PBM2 search). Shown are the number of genes; genes in the intersection are likely to be direct targets of HNF4α. (B) As in (A) except with SVM2 search of annotated human genes with four or more sites. (See Supporting Tables 6A and 6B for a complete list of the 198 and 135 genes in the intersection of the Venn diagrams in (A) and (B), respectively.) (C) Sampling of new HNF4α target genes that are bound in vivo, down-regulated in HNF4α knockdown, and containing ≥1 PBM or ≥4 SVM sites. Functions classically associated with HNF4α are shown as well as new functional categories. ID, Entrez Gene ID; Symbol, Official Gene Symbol. (See Supporting Tables 7A and 7B for a complete listing of all human genes with one or more PBM sites and four or more SVM sites, respectively.)
Fig. 8.
Illustration of select new HNF4α target genes down-regulated in RNAi, bound in vivo, and with PBM or SVM HNF4α-binding sites. Screenshots from Integrated Genome Browser of HNF4α ChIP-chip signals from primary human hepatocytes in promoter regions11 with PBM (closed triangle) sites indicated. SVM sites (open triangle) are indicated only for those genes lacking a PBM site in the region shown. ChIP signals are all statistically significant. Numbers are chromosome coordinates from UCSC hg18. Not all shots are on the same scale. Classical (A) and new functions (B) as defined in Fig. 7c are indicated.
Discussion
Identification of TF binding sites and target genes can be a laborious process. Recent genome-scale technologies such as expression profiling and genome-wide location analysis can greatly expand the repertoire of potential targets with relative ease, although the question remains as to which are direct targets that contain bona fide binding sites. PBMs allow for a high-throughput identification of DNA binding sequences that can then be integrated with the other techniques, and can also be used to predict potential new targets in additional tissues or developmental stages.
Here, we successfully adapt the PBM technology to assess HNF4α DNA binding under conditions that more closely approximate physiological conditions (i.e., native full-length receptor in a crude nuclear extract) (Fig. 1). We show that the PBM results are highly reproducible across different species (human and rat) and isoforms (α2 and α8) of HNF4α under a variety of conditions (Figs. 2 and 3). We identify new rules for DNA binding and develop an SVM model to predict additional sites (Figs. 3 and 4). We compare the PBM and SVM results to RNAi expression profiling (Fig. 5) as well as to published ChIP-chip results in order to develop an integrated approach for the identification of human HNF4α target genes. We show that all three systems yield similar overrepresented categories of target genes (Fig. 6), supporting the notion that specific TF binding sites in promoter regions are a major factor in driving gene expression. Using this integrated approach, we identified ~240 new, direct targets of HNF4α, many of which are in new functional categories (Figs. 7 and 8). To our knowledge, this is the first such integration of extensive PBM, ChIP-chip, and expression profiling data for any TF. Finally, to facilitate future HNF4α target gene research, we have developed a publicly available web-based tool (HNF4 Motif Finder) based on our PBM results that can be used to search any DNA sequence for potential HNF4α-binding sites (http://nrmotif.ucr.edu).
We define direct targets as genes that meet three criteria: contain a functional binding site in a regulatory region (PBM/SVM search), bind in vivo to the promoter (ChIP), and are down-regulated when HNF4α expression is knocked down (RNAi). Applying these criteria, we expand upon the classical roles of HNF4α by identifying additional target genes involved in metabolism (e.g., APOM, LIPC, LPIN1), solute carrier transport (e.g., SLC7A2, SLC12A7, SLC25A20), protein transport and secretion (e.g., COPA, GOLGB1, GOLGA1), as well as transcription regulation (e.g., HDAC6, MED14, etc.).
The integrated approach also identified new HNF4α targets in pathways not previously associated with HNF4α, such as regulation of signal transduction (e.g., TAOK3, NGEF, PRKCZ, FNTB), and inflammation and immune response (e.g., IL32, BRE, LEAP2, IFITM2, BAT3). Perhaps the most intriguing new categories of HNF4α target genes are those involved in apoptosis, DNA repair, and cancer. HNF4α has long been considered a key factor in hepatocyte differentiation3,4 but there are an increasing number of reports indicating that HNF4α may act as a tumor suppressor.39,40 This view is supported by the new target genes identified here, such as NINJ1 (Fig. 5), which may play a role in regulating cellular senescence by inducing the expression of p21, a cell cycle inhibitor gene,41 and is consistent with our previous findings that the p21 gene (CDKN1A) itself is a direct target of HNF4α.23 Other new HNF4α target genes related to anti-growth effects are: CIDEC, which induces fragmentation of DNA upon apoptosis; ATPIF1, which inhibits an adenosine triphosphatase involved in angiogenesis; and STEAP3, which is induced by tumor suppressor p53 and whose down-regulation is associated with a transition from cirrhosis to hepatocellular carcinoma.42 There were also genes involved in stress responses such as the DNA repair gene FANCF, a Fanconi’s anemia complementation group F, and USP1, a ubiquitin-specific protease.
In addition to the genes that meet the three criteria mentioned above, our analysis also revealed thousands of additional genes that met only one or two of the three criteria. While technical considerations (e.g., missing tiles in the ChIP-chip, malfunctioning probes in the expression arrays, false positives in the ChIP assay, etc.) are sure to account for some of those genes, other explanations are also possible. For example, the genes present only in the expression profiling could be indirect targets of HNF4α and hence yield no PBM/SVM or ChIP signal. Genes present in ChIP-chip alone could contain as-yet unidentified HNF4α-binding sites or recruit HNF4α in a non-direct fashion; it should also be noted that in Fig. 7B, we imposed a fairly stringent requirement of four or more SVM sites for a gene to be included in that analysis. Genes identified only in the PBM/SVM searches could contain bona fide HNF4α-binding sites but are simply not expressed in the hepatocellular carcinoma cell line (HepG2) used in the expression profiling nor in the particular set of primary human hepatocytes used in the ChIP-chip. It could also be that in adult hepatocytes the promoter regions of those genes are not available for binding (and hence activation) due to the structure of the chromatin. Genes found only in the PBM/SVM searches could also represent nonhepatic targets that are expressed in other HNF4α-expressing tissues such as kidney, pancreas, intestine, and colon. Finally, it is also possible that there may be potential HNF4α-binding sites in the human genome that are never used by HNF4α.
Whatever the reasons for the incomplete overlap between the three assays, the use of the PBM/SVM results presented here, as well as the web-based HNF4 Motif Finder, should greatly facilitate any future investigation of potential HNF4α target genes. Additionally, our approach of integrating data from multiple genome-wide assays, including PBMs, provides a powerful new framework for identifying direct targets of TFs.
Supplementary Material
Acknowledgment
This work was funded by grants to F.M.S. (National Institutes of Health [NIH] DK053892), T.J. (National Science Foundation IIS-0711129), F.M.S. and T.J. (University of California Riverside Institute for Integrative Genome Biology, NIH R21MH087397), E.B. (PhRMA Foundation predoctoral fellowship), and W.H.-V. (University of California Toxic Substance Training Grant). We would also like to thank the following for help: A. Karatzoglou (ksvm), S. Davis (ACME), and J. Schnabl (Supporting Table 1A).
Abbreviations
- ChIP
chromatin immunoprecipitation
- DBD
DNA-binding domain
- GO
gene ontology
- HNF4α
hepatocyte nuclear factor 4 alpha
- PBM
protein-binding microarray
- PCR
polymerase chain reaction
- PWM
position weight matrix
- RNAi
RNA intereference
- siRNA
small interfering RNA
- SVM
Support Vector Machine
- TF
transcription factor
Footnotes
Potential conflict of interest: Nothing to report.
Additional Supporting Information may be found in the online version of this article.
References
- 1.Bolotin E, Schnabl J, Sladek F. HNF4A (Homo sapiens) Transcription Factor Encyclopedia. 2009 http://www.cisreg.ca/tfe. [Google Scholar]
- 2.Sladek FM, Zhong WM, Lai E, Darnell JE., Jr Liver-enriched transcription factor HNF-4 is a novel member of the steroid hormone receptor superfamily. Genes Dev. 1990;4:2353–2365. doi: 10.1101/gad.4.12b.2353. [DOI] [PubMed] [Google Scholar]
- 3.Hayhurst GP, Lee YH, Lambert G, Ward JM, Gonzalez FJ. Hepatocyte nuclear factor 4alpha (nuclear receptor 2A1) is essential for maintenance of hepatic gene expression and lipid homeostasis. Mol Cell Biol. 2001;21:1393–1403. doi: 10.1128/MCB.21.4.1393-1403.2001. [DOI] [PMC free article] [PubMed] [Google Scholar]
- 4.Watt AJ, Garrison WD, Duncan SA. HNF4: a central regulator of hepatocyte differentiation and function. Hepatology. 2003;37:1249–1253. doi: 10.1053/jhep.2003.50273. [DOI] [PubMed] [Google Scholar]
- 5.Gupta RK, Kaestner KH. HNF-4alpha: from MODY to late-onset type 2 diabetes. Trends Mol Med. 2004;10:521–524. doi: 10.1016/j.molmed.2004.09.004. [DOI] [PubMed] [Google Scholar]
- 6.Reijnen MJ, Sladek FM, Bertina RM, Reitsma PH. Disruption of a binding site for hepatocyte nuclear factor 4 results in hemophilia B Leyden. Proc Natl Acad Sci U S A. 1992;89:6300–6303. doi: 10.1073/pnas.89.14.6300. [DOI] [PMC free article] [PubMed] [Google Scholar]
- 7.Sladek F, Seidel S. Hepatocyte nuclear factor 4α. In: Burris T, McCabe E, editors. Nuclear Receptors and Genetic Diseases. London: Academic Press; 2001. pp. 309–361. [Google Scholar]
- 8.Ellard S, Colclough K. Mutations in the genes encoding the transcription factors hepatocyte nuclear factor 1 alpha (HNF1A) and 4 alpha (HNF4A) in maturity-onset diabetes of the young. Hum Mutat. 2006;27:854–869. doi: 10.1002/humu.20357. [DOI] [PubMed] [Google Scholar]
- 9.Gonzalez FJ. Regulation of hepatocyte nuclear factor 4 alpha-mediated transcription. Drug Metab Pharmacokinet. 2008;23:2–7. doi: 10.2133/dmpk.23.2. [DOI] [PubMed] [Google Scholar]
- 10.Odom DT, Zizlsperger N, Gordon DB, Bell GW, Rinaldi NJ, Murray HL, et al. Control of pancreas and liver gene expression by HNF transcription factors. Science. 2004;303:1378–1381. doi: 10.1126/science.1089769. [DOI] [PMC free article] [PubMed] [Google Scholar]
- 11.Odom DT, Dowell RD, Jacobsen ES, Nekludova L, Rolfe PA, Danford TW, et al. Core transcriptional regulatory circuitry in human hepatocytes. Mol Syst Biol. 2006;2 doi: 10.1038/msb4100059. 2006.0017. [DOI] [PMC free article] [PubMed] [Google Scholar]
- 12.Rada-Iglesias A, Wallerman O, Koch C, Ameur A, Enroth S, Clelland G, et al. Binding sites for metabolic disease related transcription factors inferred at base pair resolution by chromatin immunoprecipitation and genomic microarrays. Hum Mol Genet. 2005;14:3435–3447. doi: 10.1093/hmg/ddi378. [DOI] [PubMed] [Google Scholar]
- 13.Yuan X, Ta TC, Lin M, Evans JR, Dong Y, Bolotin E, et al. Identification of an endogenous ligand bound to a native orphan nuclear receptor. PLoS ONE. 2009;4:e5609. doi: 10.1371/journal.pone.0005609. [DOI] [PMC free article] [PubMed] [Google Scholar]
- 14.Bogan AA, Dallas-Yang Q, Ruse MD, Jr, Maeda Y, Jiang G, Nepomuceno L, et al. Analysis of protein dimerization and ligand binding of orphan receptor HNF4alpha. J Mol Biol. 2000;302:831–851. doi: 10.1006/jmbi.2000.4099. [DOI] [PubMed] [Google Scholar]
- 15.Jiang G, Nepomuceno L, Hopkins K, Sladek FM. Exclusive homodimerization of the orphan receptor hepatocyte nuclear factor 4 defines a new subclass of nuclear receptors. Mol Cell Biol. 1995;15:5131–5143. doi: 10.1128/mcb.15.9.5131. [DOI] [PMC free article] [PubMed] [Google Scholar]
- 16.Jiang G, Sladek FM. The DNA binding domain of hepatocyte nuclear factor 4 mediates cooperative, specific binding to DNA and heterodimerization with the retinoid X receptor alpha. J Biol Chem. 1997;272:1218–1225. doi: 10.1074/jbc.272.2.1218. [DOI] [PubMed] [Google Scholar]
- 17.Ellrott K, Yang C, Sladek FM, Jiang T. Identifying transcription factor binding sites through Markov chain optimization. Bioinformatics. 2002;18(Suppl. 2):S100–S109. doi: 10.1093/bioinformatics/18.suppl_2.s100. [DOI] [PubMed] [Google Scholar]
- 18.Bulyk ML. Analysis of sequence specificities of DNA-binding proteins with protein binding microarrays. Methods Enzymol. 2006;410:279–299. doi: 10.1016/S0076-6879(06)10013-0. [DOI] [PMC free article] [PubMed] [Google Scholar]
- 19.Rada-Iglesias A, Wallerman O, Koch C, Ameur A, Enroth S, Clelland G, et al. Binding sites for metabolic disease related transcription factors inferred at base pair resolution by chromatin immunoprecipitation and genomic microarrays. Hum Mol Genet. 2005;14:3435–3447. doi: 10.1093/hmg/ddi378. [DOI] [PubMed] [Google Scholar]
- 20.Neuvial P, Hupe P, Brito I, Liva S, Manie E, Brennetot C, et al. Spatial normalization of array-CGH data. BMC Bioinformatics. 2006;7:264. doi: 10.1186/1471-2105-7-264. [DOI] [PMC free article] [PubMed] [Google Scholar]
- 21.Bolstad BM, Irizarry RA, Astrand M, Speed TP. A comparison of normalization methods for high density oligonucleotide array data based on variance and bias. Bioinformatics. 2003;19:185–193. doi: 10.1093/bioinformatics/19.2.185. [DOI] [PubMed] [Google Scholar]
- 22.Karatzoglou A, Smola A, Hornik K, Zeileis A. Kernlab–An S4 Package for Kernel Methods in R. J Stat Softw. 2004;11(9) www.jstatsoft.org. [Google Scholar]
- 23.Hwang-Verslues WW, Sladek FM. Nuclear receptor hepatocyte nuclear factor 4alpha1 competes with oncoprotein c-Myc for control of the p21/WAF1 promoter. Mol Endocrinol. 2008;22:78–90. doi: 10.1210/me.2007-0298. [DOI] [PMC free article] [PubMed] [Google Scholar]
- 24.Smyth GK, Speed T. Normalization of cDNA microarray data. Methods. 2003;31:265–273. doi: 10.1016/s1046-2023(03)00155-5. [DOI] [PubMed] [Google Scholar]
- 25.Scacheri PC, Crawford GE, Davis S. Statistics for ChIP-chip and DNase hypersensitivity experiments on NimbleGen arrays. Methods Enzymol. 2006;411:270–282. doi: 10.1016/S0076-6879(06)11014-9. [DOI] [PubMed] [Google Scholar]
- 26.Berger MF, Bulyk ML. Universal protein-binding microarrays for the comprehensive characterization of the DNA-binding specificities of transcription factors. Nat Protoc. 2009;4:393–411. doi: 10.1038/nprot.2008.195. [DOI] [PMC free article] [PubMed] [Google Scholar]
- 27.Berger MF, Badis G, Gehrke AR, Talukder S, Philippakis AA, Pena-Castillo L, et al. Variation in homeodomain DNA binding revealed by high-resolution analysis of sequence preferences. Cell. 2008;133:1266–1276. doi: 10.1016/j.cell.2008.05.024. [DOI] [PMC free article] [PubMed] [Google Scholar]
- 28.Badis G, Berger MF, Philippakis AA, Talukder S, Gehrke AR, Jaeger SA, et al. Diversity and complexity in DNA recognition by transcription factors. Science. 2009;324:1720–1723. doi: 10.1126/science.1162327. [DOI] [PMC free article] [PubMed] [Google Scholar]
- 29.Linnell J, Mott R, Field S, Kwiatkowski DP, Ragoussis J, Udalova IA. Quantitative high-throughput analysis of transcription factor binding specificities. Nucleic Acids Res. 2004;32:e44. doi: 10.1093/nar/gnh042. [DOI] [PMC free article] [PubMed] [Google Scholar]
- 30.Jiang G, Lee U, Sladek FM. Proposed mechanism for the stabilization of nuclear receptor DNA binding via protein dimerization. Mol Cell Biol. 1997;17:6546–6554. doi: 10.1128/mcb.17.11.6546. [DOI] [PMC free article] [PubMed] [Google Scholar]
- 31.Jiang G, Nepomuceno L, Yang Q, Sladek FM. Serine/threonine phosphorylation of orphan receptor hepatocyte nuclear factor 4. Arch Biochem Biophys. 1997;340:1–9. doi: 10.1006/abbi.1997.9914. [DOI] [PubMed] [Google Scholar]
- 32.Lu P, Rha GB, Melikishvili M, Wu G, Adkins BC, Fried MG, et al. Structural basis of natural promoter recognition by a unique nuclear receptor, HNF4alpha. Diabetes gene product. J Biol Chem. 2008;283:33685–33697. doi: 10.1074/jbc.M806213200. [DOI] [PMC free article] [PubMed] [Google Scholar]
- 33.Yang C, Bolotin E, Jiang T, Sladek FM, Martinez E. Prevalence of the initiator over the TATA box in human and yeast genes and identification of DNA motifs enriched in human TATA-less core promoters. Gene. 2007;389:52–65. doi: 10.1016/j.gene.2006.09.029. [DOI] [PMC free article] [PubMed] [Google Scholar]
- 34.Lemaigre F, Zaret KS. Liver development update: new embryo models, cell lineage control, and morphogenesis. Curr Opin Genet Dev. 2004;14:582–590. doi: 10.1016/j.gde.2004.08.004. [DOI] [PubMed] [Google Scholar]
- 35.Luebke-Wheeler J, Zhang K, Battle M, Si-Tayeb K, Garrison W, Chhinder S, et al. Hepatocyte nuclear factor 4alpha is implicated in endoplasmic reticulum stress-induced acute phase response by regulating expression of cyclic adenosine monophosphate responsive element binding protein H. Hepatology. 2008;48:1242–1250. doi: 10.1002/hep.22439. [DOI] [PMC free article] [PubMed] [Google Scholar]
- 36.Kamiya A, Inoue Y, Gonzalez FJ. Role of the hepatocyte nuclear factor 4alpha in control of the pregnane X receptor during fetal liver development. Hepatology. 2003;37:1375–1384. doi: 10.1053/jhep.2003.50212. [DOI] [PubMed] [Google Scholar]
- 37.Ohguchi H, Tanaka T, Uchida A, Magoori K, Kudo H, Kim I, et al. Hepatocyte nuclear factor 4alpha contributes to thyroid hormone homeostasis by cooperatively regulating the type 1 iodothyronine deiodinase gene with GATA4 and Kruppel-like transcription factor 9. Mol Cell Biol. 2008;28:3917–3931. doi: 10.1128/MCB.02154-07. [DOI] [PMC free article] [PubMed] [Google Scholar]
- 38.Zhang Y, Castellani LW, Sinal CJ, Gonzalez FJ, Edwards PA. Peroxisome proliferator-activated receptor-gamma coactivator 1alpha (PGC-1alpha) regulates triglyceride metabolism by activation of the nuclear receptor FXR. Genes Dev. 2004;18:157–169. doi: 10.1101/gad.1138104. [DOI] [PMC free article] [PubMed] [Google Scholar]
- 39.Tanaka T, Jiang S, Hotta H, Takano K, Iwanari H, Sumi K, et al. Dys-regulated expression of P1 and P2 promoter-driven hepatocyte nuclear factor-4alpha in the pathogenesis of human cancer. J Pathol. 2006;208:662–672. doi: 10.1002/path.1928. [DOI] [PubMed] [Google Scholar]
- 40.Yin C, Lin Y, Zhang X, Chen YX, Zeng X, Yue HY, et al. Differentiation therapy of hepatocellular carcinoma in mice with recombinant adenovirus carrying hepatocyte nuclear factor-4alpha gene. Hepatology. 2008;48:1528–1539. doi: 10.1002/hep.22510. [DOI] [PubMed] [Google Scholar]
- 41.Toyama T, Sasaki Y, Horimoto M, Iyoda K, Yakushijin T, Ohkawa K, et al. Ninjurin1 increases p21 expression and induces cellular senescence in human hepatoma cells. J Hepatol. 2004;41:637–643. doi: 10.1016/j.jhep.2004.06.027. [DOI] [PubMed] [Google Scholar]
- 42.Caillot F, Daveau R, Daveau M, Lubrano J, Saint-Auret G, Hiron M, et al. Down-regulated expression of the TSAP6 protein in liver is associated with a transition from cirrhosis to hepatocellular carcinoma. Histopathology. 2009;54:319–327. doi: 10.1111/j.1365-2559.2009.03224.x. [DOI] [PubMed] [Google Scholar]
- 43.Crooks GE, Hon G, Chandonia JM, Brenner SE. WebLogo: a sequence logo generator. Genome Res. 2004;14:1188–1190. doi: 10.1101/gr.849004. [DOI] [PMC free article] [PubMed] [Google Scholar]
- 44.Dennis G, Jr, Sherman BT, Hosack DA, Yang J, Gao W, Lane HC, et al. DAVID: Database for Annotation, Visualization, and Integrated Discovery. Genome Biol. 2003;4:P3. [PubMed] [Google Scholar]
Associated Data
This section collects any data citations, data availability statements, or supplementary materials included in this article.


