

Abstract
We provide here a detailed and comprehensive analysis of skeletal muscle metabolomic profiles in response to adiponectin in adiponectin knockout (AdKO) mice after high-fat–diet (HFD) feeding. Hyperinsulinemic-euglycemic clamp studies showed that adiponectin administration corrected HFD-induced defects in post/basal insulin stimulated Rd and insulin signaling in skeletal muscle. Lipidomic profiling of skeletal muscle from HFD-fed mice indicated elevated triacylglycerol and diacylglycerol species (16:0–18:1, 18:1, and 18:0–18:2) as well as acetyl coA, all of which were mitigated by adiponectin. HFD induced elevated levels of various ceramides, but these were not significantly altered by adiponectin. Adiponectin corrected the altered branched-chain amino acid metabolism caused by HFD and corrected increases across a range of glycerolipids, fatty acids, and various lysolipids. Adiponectin also reversed induction of the pentose phosphate pathway by HFD. Analysis of muscle mitochondrial structure indicated that adiponectin treatment corrected HFD-induced pathological changes. In summary, we show an unbiased comprehensive metabolomic profile of skeletal muscle from AdKO mice subjected to HFD with or without adiponectin and relate these to changes in whole-body glucose handling, insulin signaling, and mitochondrial structure and function. Our data revealed a key signature of relatively normalized muscle metabolism across multiple metabolic pathways with adiponectin supplementation under the HFD condition.
Adiponectin circulates abundantly in the concentration range of 3–30 µg/mL in healthy subjects (1). Decreased plasma adiponectin, in particular the high–molecular weight (HMW) oligomeric form, has been found in patients with obesity and type 2 diabetes despite increasing adipose tissue mass (2). Numerous studies in humans or animal models have consistently shown that adiponectin can mediate antidiabetes effects via insulin-sensitizing or insulin-mimetic effects in various tissues (3). However, the precise influence of adiponectin on a wide range of metabolic variables has not been fully characterized.
Skeletal muscle serves as a major site for glucose and fatty acid metabolism (4). The development of insulin resistance owing to obesity is a multifactorial vicious cycle whereby various mechanisms interact with each other to worsen the condition over time (5). In lean/healthy individuals, skeletal muscle has the capacity to switch between carbohydrate and lipid as the preferred energy substrate, and this phenomenon is called metabolic flexibility (6). This flexibility is lost in individuals with insulin resistance and mitochondrial dysfunction. Mitochondrial dysfunction in skeletal muscle is considered central to the pathogenesis of insulin resistance and metabolic complications in obesity and type 2 diabetes (7,8). In obesity, mitochondrial function must be maximized to efficiently handle the prolonged overload of energy substrates—mainly lipids. However, decreased oxidative capacity or incomplete oxidation (6) in dysfunctional mitochondria contributes to the accumulation of lipid intermediates such as ceramide and diacylglycerol (DAG) inside the myocyte, which leads to insulin resistance (9–11). Evidence points to an important contribution of adiponectin availability or action in such metabolic adaptations. For example, studies using adiponectin knockout (AdKO) mice have been particularly informative, as these mice displayed more severe insulin resistance than their wild-type (wt) counterparts when challenged with a high-fat high-sucrose diet (12). Consistent with these findings, a recent publication from Kadowaki and colleagues (13) showed that adiponectin can increase muscle mitochondrial mass and its oxidative capacity by the activation of AMP kinase (14). Furthermore, transgenic mice overexpressing adiponectin show improved mitochondrial function and insulin sensitivity (15–17).
Although it is well established that adiponectin exerts beneficial metabolic effects by enhancing insulin sensitivity, further investigations need to be conducted to better understand the underlying molecular mechanisms. Metabolomics is now emerging as a powerful tool for providing a precise functional profile of cellular biochemistry (18). In this way, novel discoveries connecting metabolic profiles and biological responses have been made and have expedited advances in our understanding of cell biology and physiology in all areas of medicine, including diabetes (19–21).
We performed this study using AdKO mice to explore the impacts of dietary high-fat content and adiponectin supplementation on global metabolic profiles in skeletal muscle and correlate these with biochemical and histological data as well as measures of insulin sensitivity and whole-body glucose homeostasis. The study was designed to further test the hypothesis that restoring adiponectin action alleviates the metabolic deterioration in muscle metabolism and whole-body glucose handling elicited by long-term high-fat feeding. To this end, AdKO mice were fed a high-fat diet (HFD) and treated daily with adiponectin to restore levels seen in wt, chow-fed mice. The study focused on identification of novel modulators of muscle metabolism through metabolomic analysis.
RESEARCH DESIGN AND METHODS
Male AdKO mice (12) on a C57bl6 background and littermates were routinely bred and genotyped in-house prior to being allocated to experimental groups. Animal facilities met the guidelines of the Canadian Council on Animal Care, and all protocols used were approved by the Animal Care Committee, York University. At 6 weeks of age, animals were fed either a regular chow diet or 60% HFD diet for a period of 6 weeks. At the end of the 6 weeks, chow- and HFD-fed AdKO animals received either saline or full-length adiponectin (3 µg/g body wt i.p.) twice daily (at 9:00 a.m. and 6:00 p.m.) for an additional 2 weeks. Adiponectin was prepared in saline as previously described (22). At the time of experimental analysis, animals were simultaneously injected with adiponectin or saline, deprived of food for 5–6 h, and then subjected to hyperinsulinemic-euglycemic clamp. Acute insulin stimulation was via a bolus insulin (4 units/kg body wt) injection via tail vein, and tissues were harvested 5 min later. Skeletal muscle tissue samples collected were snap-frozen in liquid nitrogen (N2) and together with serum samples from the same animals kept at −80°C until analysis.
Hyperinsulinemic-euglycemic clamp, glucose tolerance test, and fasting circulating free fatty acid.
Four days prior to the clamp procedure, catheters were inserted into the right jugular vein and left carotid artery, and then the hyperinsulinemic-euglycemic clamp was performed essentially as previously described (23). Serum samples collected at experimental time = −90, −30, −20, −10, 0, 75, 80, 85, 90, 95, 100, 105, 110, 115, and 120 min were used to determine the Rd, Ra, and glycolytic rate. For the glucose tolerance test, the animals were starved 5–6 h before receiving a bolus injection of glucose (2 g/kg body wt i.p.). Tail-vein blood samples were collected after 15, 30, 60, and 90 min, and blood glucose level (millimoles per liter) was determined with a glucometer (Conture; Bayer). Free fatty acid level was assessed using the NEFA-HR(2) kit (Wako, Richmond, VA).
Skeletal muscle homogenization and analysis.
Skeletal muscle strips were snap-frozen in liquid nitrogen and prepared for analysis essentially as described by us previously (24). Tissue-specific triglyceride and ATP content was analyzed by a colorimetric Triglyceride Quantification kit (cat. no. K622) and ATP Assay kit (cat. no. K355) purchased from Biovision (Mountain View, CA). For transmission, electron microscopy soleus muscles were carefully isolated and cut into small pieces. The tissues were fixed in 2.5% glutaraldehyde in Sorenson phosphate buffer for 1 h at room temperature and postfixed with 1% osmium tetroxide prior to dehydration and embedding in Spurr resin in a longitudinal orientation. Ultrathin sections (60–80 nm) were cut and mounted on copper grids, contrasted with 1% uranyl acetate and lead citrate, and observed with a Philips EM210 transmission electron microscope. For ultrastructural analysis, 10–15 random fields of view were obtained from each of three to four mice from each group.
Metabolomic analysis.
Global biochemical profiles were determined in gastrocnemius muscle as fee for service by Metabolon with additional lipidomic analysis by us as previously described (25–28). Briefly, for global metabolomic analyses the extracted samples were split into equal parts for analysis on the gas chromatography–mass spectrometry and liquid chromatography–tandem mass spectrometry platforms. Also included were several technical replicate samples created from a homogeneous pool containing a small amount of all study samples (Client Matrix). Instrument variability was determined by calculating the median relative SD for the internal standards that were added to each sample prior to injection into the mass spectrometers. Overall process variability was determined by calculating the median relative SD for all endogenous metabolites (i.e., noninstrument standards) present in 100% of the Client Matrix samples, which are technical replicates of pooled client samples. Compounds were identified by comparison with library entries of purified standards or recurrent unknown entities. Identification of known chemical entities was based on comparison with metabolomic library entries of purified standards. The data extraction of the raw mass spectrometry data files yielded information that was examined using bioinformatic approaches, and appropriate quality-control limits were imposed. The contents of DAGs in extracted lipids were quantified by liquid chromatography–tandem mass spectrometry. Five species of DAGs (di-16:0, di-18:1, 16:0–18:1, 18:0–18:2, and 18:0–20:4) were separated by high-performance liquid chromatography with C6-phenyl column, ionized in positive atmospheric pressure chemical ionization mode, and quantified by a multiple reaction–monitoring method. Sphingolipids—ceramides (C14:0, C16:0, C18:0, C18:1, C20:0, C24:0, and C24:1), sphinganine, sphingosine, sphingosine-1-phosphate, and sphingomyelins (C16:0, C18:0, and C18:1)—were separated by high-performance liquid chromatography with C18 columns (3.5 μm, 2.1 × 50 mm, XTerra C18) and ionized in positive electrospray ionization mode. Metabolites of sphingolipids were monitored for multiple reaction–monitoring quantification.
Statistical analysis.
All data were calculated as means ± SEM and further analyzed using nonparametric one-way ANOVA with Tukey posttest or Welch’s two-sample t tests as appropriate without Bonferroni correction. Differences were considered statistically significant at P < 0.05 and further stratified to P < 0.01 and P < 0.001, respectively.
RESULTS
Changes in whole-body glucose metabolism induced by HFD with or without adiponectin.
wt or AdKO mice were fed either commercial chow or the 60% HFD at the age of 6 weeks for a further 6 weeks, resulting in four subgroups: wt-chow, wt–60% HFD, AdKO-chow, and AdKO–60% HFD. There was an exaggerated development of whole-body insulin resistance in AdKO mice in response to an HFD, indicated by glucose tolerance tests (Fig. 1A). We then sought to determine whether restoration of adiponectin in AdKO mice would significantly revert HFD-induced metabolic deterioration. HFD-fed AdKO mice were given recombinant full-length adiponectin (fAd) (containing high–, medium–, and low–molecular weight forms) at 3 µg/g body wt i.p. twice a day for an additional 2 weeks after the initial 6-week HFD feeding period and compared with untreated HFD-fed AdKO mice, with chow-fed AdKO mice as the genotype-diet control. Importantly, the fAd treatment protocol used here could successfully bring the circulating level of adiponectin back to a normal range seen in wt mice, and this level was maintained for at least 6 h postinjection (data not shown). During the experimental period, mice continued to gain weight normally with slightly, but not significantly, less weight gain in adiponectin-treated animals (data not shown). We also performed more detailed analyses of whole-body insulin sensitivity and glucose homeostasis using the hyperinsulinemic-euglycemic clamp to determine whether adiponectin could correct HFD-induced insulin resistance. Figure 1B shows that HFD caused a significant decrease in glucose infusion rate and that fAd treatment partially and significantly reversed this defect, indicating that adiponectin treatment can indeed correct HFD-induced whole-body insulin resistance. Upon insulin infusion during the clamp procedure, Ra from liver is suppressed while Rd into skeletal muscle and other peripheral tissues is enhanced. Figure 1C shows that the defect in both Ra and Rd (post–insulin infusion over basal) that develops in response to HFD in AdKO mice was significantly reversed by adiponectin administration. Although adiponectin treatment significantly improved HFD-induced changes in whole-body glucose homeostasis, the changes were not complete reversal, as the negative impact of HFD is so severe as to be dominant (Fig. 1B, C, E, and F). Glycolytic rate represents the ability of the body to use glucose as an oxidative substrate, and the decrease in basal glycolytic rate in mice treated with adiponectin (Fig. 1D) suggests that adiponectin can switch energy substrate preference to using more fatty acids rather than glucose. This decreased basal level of glycolytic rate upon adiponectin treatment corresponded with decreased basal Ra and Rd level (Fig. 1E and F). Interestingly, HFD induced no difference in glycolytic rate in response to insulin stimulation (Fig. 1D). When insulin-stimulated phosphorylation of insulin receptor substrate (IRS) (Y612), Akt (T308), and Akt (S473) was examined in skeletal muscle, we found decreased phosphorylation after HFD, and all of these were significantly recovered in mice treated with adiponectin (Fig. 1G, H, and L). The enhanced levels of circulating nonesterified fatty acid (NEFA) induced by HFD were corrected by adiponectin (Fig. 1J). This correlated with a similar profile of changes in total levels of intramuscular triglyceride (Fig. 1K) and DAG (Fig. 1L), although HFD-induced changes in total ceramide were not corrected by adiponectin (Fig. 1M).
FIG. 1.
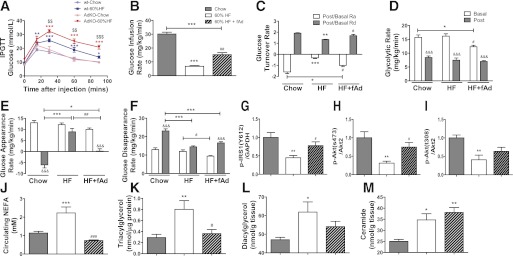
Glucose homeostasis, insulin sensitivity, and related lipid analysis. wt and AdKO mice were fed either commercial chow or 60% HFD diet at the age of 6 weeks for a period of 6 weeks. Intraperitoneal glucose tolerance test (IPGTT) was performed after 5–6 h fasting to assess the effect of 60% HFD on whole-body glucose tolerance. After a 6-week HFD, AdKO mice were injected with either saline or fAd at a dosage of 3 µg/g body wt i.p. twice a day for an additional 2 weeks. Jugular vein and carotid artery catheters were embedded into animals 4 days before the hyperinsulinemic-euglycemic clamp procedure, and clamps were performed on animals after 5–6 h starvation. Blood samples were collected during the clamp procedure, and calculations were made based on the radioactivity readings from serum to represent whole-body glucose metabolism. Skeletal muscle insulin signaling was assessed 5 min after a bolus injection of insulin (4 units/kg body wt) via tail vein. A: IPGTT curves (millimoles per liter). B: Glucose infusion rate (GIR) (milligrams per kilogram per minute). C: Glucose turnover rate (post, after insulin clamp; basal, before insulin clamp). D: Glycolytic rate (milligrams per kilogram per minute). E: Glucose Ra (milligrams per kilogram per minute). F: Glucose Rd (milligrams per kilogram per minute). Quantitative analysis of Western blot detecting. G: Phosphorylated (p)-IRS1(Y612)/ glyceraldehyde-3-phosphate dehydrogenase (GAPDH). H: p-Akt(S473)/Akt2. I: p-Akt(T308)/Akt2. Various indices of lipid metabolism were also assessed and are shown. J: Circulating NEFA (millimoles per liter). K: Muscle triacylglycerol (nanomoles per microgram of protein). L: Muscle DAG (nanomoles per gram of tissue). M: Muscle ceramide (nanomoles per gram of tissue). Data represent means ± SEM. *Significant difference between HFD group and chow diet group. #Significant difference between fAd and saline treatment within the HFD group. $Significant difference between wt and AdKO mice within the HFD group. &Significant difference between before (basal) and after (post) insulin clamp. *#P < 0.05. **##$$P < 0.01. ***###$$$&&&P < 0.001. n = 4–7. HF, high fat. (A high-quality color representation of this figure is available in the online issue.)
Metabolomic analyses in AdKO mice subjected to HFD and effect of adiponectin.
To gain further insight into changes in individual molecular species, we conducted unbiased metabolomic and lipidomic profiling of skeletal muscle samples from the above three groups of mice. Metabolomic analysis included all detectable metabolites (biochemicals) of known identity, and the dataset in this study comprised a total of 267 named biochemicals. In summary, when we compared HFD with chow animals we found statistically significant (P < 0.05) changes for 87 metabolites (70 increased and 17 decreased). Treatment of HFD mice with adiponectin was found to significantly change levels of 61 metabolites (4 increased and 57 decreased). Importantly, a key feature of this dataset was a signature of relatively normalized metabolism across multiple metabolic pathways with adiponectin supplementation in the HFD condition. When we focused on individual DAG species, we observed the most prominent increases in 16:0–18:1, 18:1, and 18:0–18:2 DAGs (Fig. 2). There was a clear trend for adiponectin treatment to reduce intramuscular DAG, in particular 16:0–18:1 DAG (Fig. 2). Significant increases were observed in 18:0, 16:0, and 18:1 ceramides after HFD; however, no significant correction or trend was observed in adiponectin-treated mice (Fig. 2). Other changes of note in response to HFD were elevated 18:1 sphingomyelin, 1-oleoylglycerol, glycerophosphorylcholine, glycerol-3-phosphate, and numerous lysolipids, all of which were attenuated after adiponectin treatment (Fig. 2). We also examined metabolic profiles of biochemicals related to fatty acid metabolism and found clear increases in the majority of long-chain fatty acids and essential fatty acids—trends that were clearly opposed by adiponectin supplementation in these HFD-fed mice (Fig. 3A). We also observed a striking increase in muscle acetyl coA levels, which was significantly reduced by adiponectin (Fig. 3B). In terms of carbohydrate metabolism, increased levels of glucose-6-phosphate and glycerate after HFD were not influenced by adiponectin (Fig. 3B). We observed an unexpected increase in glucose metabolism via the pentose phosphate pathway after HFD, and this was generally opposed by adiponectin, with significant correction of changes in ribulose and xylulose observed (Fig. 3B).
FIG. 2.
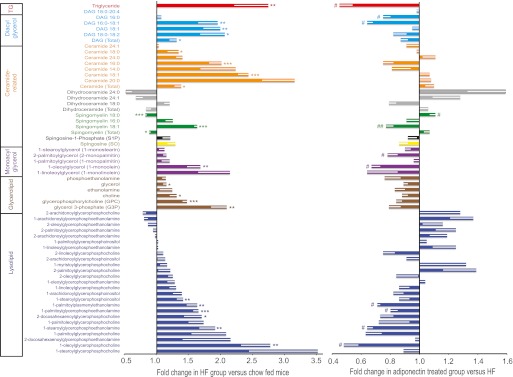
Lipidomic analysis in skeletal muscle. Analyses were performed on skeletal muscle from AdKO mice treated as described in clamp studies (Fig. 1) to establish lipidomic profiles. Individual metabolites as well as classification groups to which they belong are shown. First, the influence of HFD versus chow is shown as fold change observed in the HFD group versus chow-fed mice. In parallel, the right side of the graph shows fold change in adiponectin-treated versus saline-injected groups within the HFD group; thus, changes indicate a corrective effect of adiponectin. Data represent means ± SEM. *Significant difference between HFD group and chow diet group. #Significant difference between fAd and saline treatment within the HFD group. *#P < 0.05. **##P < 0.01. ***P < 0.001. n = 5–6. HF, high fat. (A high-quality color representation of this figure is available in the online issue.)
FIG. 3.

Metabolomic analysis of changes in fatty acid and carbohydrate profiles in skeletal muscle. Metabolomic analyses were performed on skeletal muscle from AdKO mice treated as described in clamp studies (Fig. 1), and here data are shown for long-chain, medium-chain, and essential fatty acids (A) and carbohydrate metabolism (B). Individual metabolites as well as classification groups to which they belong are shown. First, the influence of HFD versus chow is shown as fold change observed in the HFD group versus chow-fed mice. In parallel, the right side of the graph shows fold change in adiponectin-treated versus saline-treated mice within the HFD group; thus, changes indicate a corrective effect of adiponectin. Data represent means ± SEM. *Significant difference between HFD group and chow diet group. #Significant difference between fAd and saline treatment within the HFD group. *#P < 0.05. **##P < 0.01. ***###P < 0.001. n = 5–6. HF, high fat. (A high-quality color representation of this figure is available in the online issue.)
Additional analysis of skeletal muscle and adipose tissue.
We next used transmission electron miscrocopy (TEM) and showed that in the chow-fed group intermyofibrillar mitochondria showed characteristic distribution and numbers (Fig. 4A). The HFD with or without adiponectin treatment did not alter the intermyofibrillar mitochondrial alignment or number. In contrast, the HFD led to strong pathological changes in subsarcolemmal mitochondrial morphology characterized by mitochondrial swelling, vacuolization, and profound matrix loss. However, no alterations in subsarcolemmal mitochondrial density were observed in response to the HFD challenge. Interestingly, adiponectin treatment alleviated the pathological changes in the mitochondrial morphology caused by the HFD. With HFD feeding, we did not observe strong changes in markers of muscle mitochondrial biogenesis, such as expression of peroxisome proliferator–activated receptor γ coactivator (PGC)1α and various complexes of the mitochondrial electron transport chain, as shown in Fig. 4B–G. Although HFD did not change the ATP production, a dramatic increase of ATP production was observed upon adiponectin treatment (Fig. 4J). To examine whether adiponectin promoted lipid storage in nonmuscle tissues, we examined adipocyte size from these animals. Epididymal fat pad analysis showed that HFD increased adipocyte size, together with profound inflammatory cell infiltration. Adiponectin treatment resulted in significantly smaller adipocyte size and less apparent inflammatory cell infiltration compared with the HFD group (Fig. 4H and I).
FIG. 4.
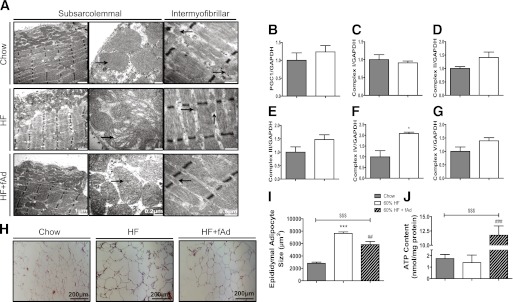
Analysis of mitochondrial phenotype and function and adipocyte size. AdKO mice were fed either regular chow or 60% HFD at the age of 6 weeks. Mice were then injected with either saline or fAd at a dosage of 3 µg/g body wt i.p. twice a day for an additional 2 weeks. Animals were fasted for 5–6 h before tissue sample collection. A: Representative transmission electron microscopy (TEM) micrographs of longitudinal sections depicting intramyofibrillar and subsarcolarmal mitochondria in soleus muscle (black arrows: mitochondria). Also shown is quantitation of Western blots detecting PGC1α (B), complex I (C), complex II (D), complex III (E), complex IV (F), and complex V (G). H: Representative cross-sectional image of epididymal adipose tissues stained with hematoxylin-eosin (H&E). I: Quantification of adipocyte size in epididymal adipose tissue. J: ATP content in skeletal muscle. Data represent means ± SEM. *Significant difference between HFD group and chow diet group. #Significant difference between fAd and saline injection within the HFD group. $Significant difference between fAd-treated HFD animal and chow diet animal. *P < 0.05. ##P < 0.01. ***###$$$P < 0.001. n = 4–6. HF, high fat. (A high-quality color representation of this figure is available in the online issue.)
Further metabolomic analyses in AdKO mice subjected to HFD and effect of adiponectin.
Study of amino acid metabolism by metabolomic profiling revealed a trend of significantly increased levels of branched-chain amino acids (BCAAs) after HFD, which were reduced by adiponectin treatment (Fig. 5A). In particular, this was apparent for the valine, leucine, and isoleucine group as well as for serine and threonine. HFD-induced decrease in betaine levels was not corrected by adiponectin. Finally, metabolites of purine and pyrimidine were measured and a decrease in allantoin and increase in cytidine were detected in muscle of mice fed an HFD, and these were corrected by adiponectin (Supplementary Fig. 1B). Other highlights from metabolomic analysis indicating metabolites increased by HFD and corrected by adiponectin include the eicosanoid 15-hydroxy-5Z,8Z,11Z,13E-eicosatetraenoic acid (15-HETE) and the acylcarnitines stearoylcarnitine, oleoylcarnitine, and palmitoylcarnitine (Supplementary Fig. 1A). Bioinformatic analysis of metabolite profiles allowed us to extrapolate changes in biochemical enzymatic activities that were altered by HFD with or without adiponectin. From this, it was apparent that HFD-induced changes in major groups of enzymes such as oxidoreductases, transferases, hydrolases, lyases, and ligases were reversed after adiponectin treatment (data not shown).
FIG. 5.
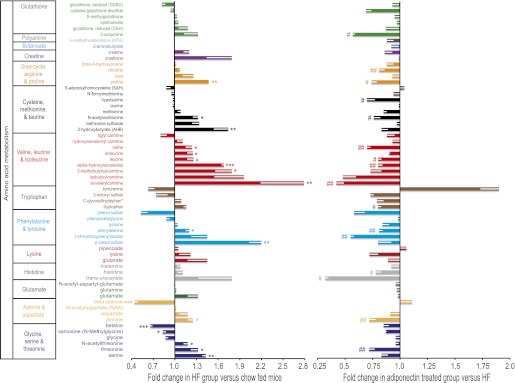
Metabolomic analysis of metabolites involved in amino acid metabolism in skeletal muscle. Metabolomic analyses were performed on skeletal muscle from AdKO mice treated as described in clamp studies (Fig. 1), and here data are shown for individual metabolites related to amino acid metabolism (A), together with the major classification groups. First, the influence of HFD versus chow is shown as fold change observed in the HFD group versus chow-fed mice. In parallel, the right side of the graph shows fold change in adiponectin-treated versus saline-injected mice within the HFD group; thus, changes indicate a corrective effect of adiponectin. Data represent means ± SEM. *Significant difference between HFD group and chow diet group. #Significant difference between fAd and saline treatment within the HFD group. *#P < 0.05. **##P < 0.01. ***P < 0.001. n = 5–6. HF, high fat. (A high-quality color representation of this figure is available in the online issue.)
DISCUSSION
This study used metabolomic profiling to identify precise changes in metabolic parameters in skeletal muscle of AdKO mice fed an HFD. AdKO mice have been very informative, shedding light on the beneficial metabolic effects of adiponectin, and here we first validated the changes in metabolism and insulin sensitivity in this model by performing hyperinsulinemic-euglycemic clamp studies to assess whole-body insulin sensitivity and glucose metabolism. This showed that HFD-induced changes in Ra and Rd were significantly, but not fully, improved by adiponectin. This is in agreement with several previous studies showing exaggerated insulin resistance in these mice after HFD feeding (12,29,30). The influence of adiponectin on skeletal muscle metabolism correlated with improved insulin-stimulated tyrosine phosphorylation of IRS and also activation of Akt. Adiponectin also enhanced removal of NEFA from the circulation (12,31). In addition, our powerful unbiased approach uncovered many novel insights into the principal in vivo targets underlying adiponectin’s antidiabetes effect, as discussed in more detail below.
Unbiased metabolic profiling has now been used in several studies related to diabetes (32–39). For example, in a study of mice after 12 weeks on an HFD, changes in numerous metabolic pathways were reported to contribute to insulin resistance (38). A comprehensive metabolomic analysis in liver of mice fed an HFD for 10 weeks showed that lipid metabolites including fatty acids, phosphatidylcholines, and lysophosphatidylcholines; lipid metabolism intermediates (betaine, carnitine, and acylcarnitines); amino acids; acidic compounds; monosaccharides; and serotonin underwent major changes (35). To gain insight into precisely where metabolic changes occurred in the mice used in our study, we used an untargeted metabolomic profiling platform to analyze intermediate metabolites involved in glucose, fatty acid, and amino acid metabolism (27). From all available metabolomic data, our conclusions were based primarily on focusing on the most statistically significant changes, together with additional factors such as biochemical functional similarity, inclusion in a common pathway, and significance with respect to other aspects of the study.
We focused on changes in lipid species that are well established to cause insulin resistance after an HFD, including ceramides and DAGs. Until recently, the functional differences of lipid metabolites with different chain lengths were not distinguished; however, there is now a clear appreciation of the distinct roles of various forms of DAGs and ceramides (40), and these can be studied by metabolomic analysis. In our study, an HFD was associated with multiple impacts on lipid metabolism in muscle tissue in the AdKO mouse. As expected, an HFD caused an increase in circulating NEFA and total lipid accumulation in muscle, both of which were significantly reduced in mice treated with adiponectin. A similar trend was observed when DAG levels were determined. In particular, the major HFD-induced increases were in 18:0–18:2, 16:0–18:1, and 18:1 DAG, while the most pronounced effects of adiponectin occurred in 16:0–18:1 and 16:0 DAG. Our analyses also showed that HFD induced increases in 18:1, 18:0, and 16:0 ceramides, although adiponectin did not correct these changes. We did not find major changes in very long–chain ceramides. Adiponectin has been shown to activate ceramidase and reduce hepatic ceramide levels with formation of sphingosine-1-phosphate (31). However, we found that under the conditions used in our study, adiponectin did not significantly alter ceramide levels in skeletal muscle. Rather, other effects such as decreased plasma NEFA and improved fatty acid oxidation by adiponectin contribute to sensitization of insulin action in muscle.
Data from our unbiased profiling approach is in support of the incomplete fatty acid oxidation concept (6). Complete oxidation of fatty acids to CO2 involves β-oxidation, tricarboxylic acid cycle (TCA), and oxidative phosphorylation, and defects in any one of these steps will lead to an incomplete oxidation of fatty acids. Our study indicated that HFD disrupted mitochondrial function, including the coupling between β-oxidation and TCA, rather than altering mitochondrial number. Adiponectin supplementation reduced intramuscular content of various free fatty acids, as well as several TCA intermediate metabolites. Several studies have indicated that adiponectin can improve mitochondrial function and oxidative capacity via enhanced biogenesis indicated by elevated expression level of PGC1α (13,14), although this was not observed in our study. Previous studies using transmission electronic microscopy showed that reduced number and damage of subsarcolemmal mitochondria were closely associated with insulin resistance and type 2 diabetes (41). In our chow-fed mice, transmission electron microscopy demonstrated intact sarcomere assembly and mitochondrial structure with clear mitochondrial membrane and an electron-dense matrix. In contrast, a 6-week HFD feeding resulted in mitochondrial swelling, decreased electron density of matrix, and cristae loss, which were particularly evident in the subsarcolemmal region. However, mitochondrial number appeared unchanged upon HFD feeding. Interestingly, adiponectin treatment alleviated the pathological changes in subsarcolemmal mitochondria structure associated with HFD feeding. We detected a significantly elevated level of acetyl-CoA in muscle with HFD feeding, supporting the notion that elevated free fatty acids were processed by β-oxidation in this tissue but not efficiently coupled to the TCA. In agreement with findings of recent studies, we detected increased acylcarnitines in skeletal muscle of mice fed an HFD, and these were prevented by adiponectin. Importantly, we also observed that a robust increase in muscle ATP levels was brought about by adiponectin after HFD. The decreased acetyl-CoA accumulation in presence of adiponectin may indicate more efficient coupling between β-oxidation and TCA in mitochondria, and this correlated with improved ATP production in response to adiponectin. In agreement with recent studies from Kahn and colleagues, who used an HFD for 8 weeks (39), we observed increases in muscle glucose and glucose-6-phosphate content after an HFD at the basal level. Interestingly, we observed activation of the pentose phosphate pathway by HFD, although this pathway is typically not active in muscle cells and only observed in cases such as tissue damage or disease (42). Together, these data suggest that improved mitochondrial function may be another underlying mechanism via which adiponectin exerts its insulin-sensitizing effect. In the absence of altered PGC1α levels in response to adiponectin, the improved mitochondrial function may be due to direct effects on major metabolic enzymes regulating substrate oxidation.
Our metabolomic profiling highlighted an interesting change in amino acid metabolism. The essential BCAAs leucine, isoleucine, and valine are of particular interest based upon our results. BCAA, when combined with overnutrition, have been shown to induce insulin resistance (43). Indeed, a metabolomic analysis performed by Newgard et al. (19) indicated that changes in BCAA profiles in obese subjects contribute to development of obesity-associated insulin resistance. Elevated BCAA metabolism has also been suggested to increase transamination of pyruvate to alanine, with increases in this highly gluconeogenic amino acid subsequently contributing to glucose intolerance. Circulating pyruvate and alanine levels are altered in obese subjects (44,45), and here we observed significantly increased muscle alanine content, which was prevented by adiponectin. BCAA have been show to attenuate insulin signaling via stimulation of mammalian target of rapamycin and S6K1 with phosphorylation of IRS on serine residues (46), which is in keeping with our observation of reduced IRS tyrosine phosphorylation and downstream signaling in HFD-fed animals. It has also been suggested that in HFD-fed mice, BCAA may saturate capacity for mitochondrial fuel oxidation in muscle leading to incomplete oxidation due to lipid-induced mitochondrial stress. Our work thus identifies for the first time reversal of changes in BCAA metabolism as a direct consequence of adiponectin treatment in mice.
Our metabolomic studies also highlight a thus far unappreciated connection between adiponectin and glycerolipid metabolism. The latter is enhanced by nutrient excess, and in recent years the roles of glycerolipids in health and disease have become established (47). Glucose and lipid metabolism converge via the glycerolipid free fatty acid cycle, which involves the substrates glycerol-3-phosphate and fatty acetyl-CoA from glucose and fatty acids, respectively. Numerous studies have demonstrated that increased flux through glycerolipid synthesis impairs insulin action (48,49). Mechanistically, it has recenty been shown that phosphatidic acid synthesized via the glycerol-3-phosphate pathway inhibits mTORC2 activity by decreasing the association of rictor and mTOR, thus impairing insulin signaling (48). We observed a metabolomic profile indicating increases in numerous glycerolipid metabolites in mice fed the HFD, in particular glycerol-3-phosphate. There was a general trend toward correction of changes in glycerolipids mediated by adiponectin. This is in keeping with the fact that enzymes such as glycerol-3-phosphate acyltransferase-1 are downregulated acutely by AMP kinase (50). Thus, our studies identified HFD-induced changes in glycerolipid profiles in skeletal muscle of AdKO mice. They also suggest that adiponectin mediates important corrective effects on these changes in glycerolipid metabolism.
We also observed changes in lysolipid profiles (51). Many lysolipids showed elevated levels with HFD alone and amelioration with adiponectin supplementation. Head group biochemical precursors to major classes of membrane phospholipids, including choline, ethanolamine, and myo-inositol, were observed at higher levels in muscle with HFD than with chow, and adiponectin supplementation was associated with levels for these biochemicals that were similar to those observed in chow-fed animals. A similar pattern was observed for potential markers of phospholipid breakdown, glycerol-3-phosphate (which is also a precursor in the pathways leading to DAG) and, to a lesser degree, glycerophosphorylcholine. Together, these changes in biochemicals associated with phospholipid metabolism suggest increased membrane breakdown in muscle under the HFD condition, with significant amelioration by adiponectin. Additional changes that we observed that are worthy of note include an HFD-induced increase in pyroglutamic acid (5-oxoproline)—a cause of metabolic acidosis via excess consumption of bicarbonate (52). Another unexpected observation was a large increase in kynurenine, a product of tryptophan-degrading enzymes that can be induced by proinflammatory stimuli (53,54). Prior metabolomic analysis of early insulin resistance in mice found lower levels of serum kynurenine (55), and it has been suggested that this defect is a common indication of fatty liver disease and insulin resistance (54). We show here for the first time that adiponectin regulates kynurenine production, although the significance of altered muscle kynurenine levels is unclear.
In summary, in the AdKO mouse model, we found that HFD and adiponectin supplementation were associated with broad-ranging impacts on lipid, carbohydrate, and amino acid metabolism in skeletal muscle. Many of the metabolic changes were anticipated, but we also discovered new insights into the principal in vivo targets underlying the antidiabetes effect of adiponectin. A key signature of adiponectin supplementation in the context of HFD was to normalize metabolism, generally ameliorating to some degree the HFD-induced alterations compared with global metabolism under the chow dietary condition with genetic adiponectin deficiency. Overall, the results support the idea that detrimental health effects associated with metabolic syndrome and type 2 diabetes may be improved by therapeutic strategies targeting adiponectin action. Understandably, there is great interest in therapeutic exploitation of adiponectin’s metabolic effects, and determining changes in metabolomic profiles induced by adiponectin, or lack of adiponectin, will likely have multiple impacts across diagnostics, prognostics, and target identification.
Supplementary Material
ACKNOWLEDGMENTS
This work was supported by an operating grant from the Canadian Institutes of Health Research to G.S. The authors also acknowledge the Collaborative Research Fund of Hong Kong Research Grant Council (HKU4/CRF/10) to A.X.
No potential conflicts of interest relevant to this article were reported.
Y.L. performed all experimental work (except as indicated below), analyzed data, and wrote the first draft of the manuscript. S.T. contributed to data of Fig. 4. T.P. performed lipidomic analysis, analyzed data, and reviewed the manuscript. N.J.M. provided bioinformatic analysis of the metabolomic dataset and reviewed the manuscript. Y.D. reviewed and edited the manuscript. A.X. discussed and advised regarding the study design and reviewed and edited the manuscript. G.S. initiated and designed the study, secured funding, and edited and finalized the writing of the manuscript. G.S. is the guarantor of this work and, as such, had full access to all the data in the study and takes responsibility for the integrity of the data and the accuracy of the data analysis.
The authors thank Dr. Saber Saleuddin (Department of Biology, York University, Toronto, Ontario) for advice on transmission electronic microscopy studies.
Footnotes
This article contains Supplementary Data online at http://diabetes.diabetesjournals.org/lookup/suppl/doi:10.2337/db12-0687/-/DC1.
See accompanying commentary, p. 701.
REFERENCES
- 1.Wang Y, Lam KS, Yau MH, Xu A. Post-translational modifications of adiponectin: mechanisms and functional implications. Biochem J 2008;409:623–633 [DOI] [PubMed] [Google Scholar]
- 2.Liu Y, Retnakaran R, Hanley A, Tungtrongchitr R, Shaw C, Sweeney G. Total and high molecular weight but not trimeric or hexameric forms of adiponectin correlate with markers of the metabolic syndrome and liver injury in Thai subjects. J Clin Endocrinol Metab 2007;92:4313–4318 [DOI] [PubMed] [Google Scholar]
- 3.Kadowaki T, Yamauchi T, Kubota N. The physiological and pathophysiological role of adiponectin and adiponectin receptors in the peripheral tissues and CNS. FEBS Lett 2008;582:74–80 [DOI] [PubMed] [Google Scholar]
- 4.Bouzakri K, Koistinen HA, Zierath JR. Molecular mechanisms of skeletal muscle insulin resistance in type 2 diabetes. Curr Diabetes Rev 2005;1:167–174 [DOI] [PubMed] [Google Scholar]
- 5.Eckel RH, Kahn SE, Ferrannini E, et al. Endocrine Society. American Diabetes Association. European Association for the Study of Diabetes Obesity and type 2 diabetes: what can be unified and what needs to be individualized? Diabetes Care 2011;34:1424–1430 [DOI] [PMC free article] [PubMed] [Google Scholar]
- 6.Muoio DM, Newgard CB. Obesity-related derangements in metabolic regulation. Annu Rev Biochem 2006;75:367–401 [DOI] [PubMed] [Google Scholar]
- 7.Yokota T, Kinugawa S, Hirabayashi K, et al. Oxidative stress in skeletal muscle impairs mitochondrial respiration and limits exercise capacity in type 2 diabetic mice. Am J Physiol Heart Circ Physiol 2009;297:H1069–H1077 [DOI] [PubMed] [Google Scholar]
- 8.Orrenius S, Gogvadze V, Zhivotovsky B. Mitochondrial oxidative stress: implications for cell death. Annu Rev Pharmacol Toxicol 2007;47:143–183 [DOI] [PubMed] [Google Scholar]
- 9.Kim JA, Wei Y, Sowers JR. Role of mitochondrial dysfunction in insulin resistance. Circ Res 2008;102:401–414 [DOI] [PMC free article] [PubMed] [Google Scholar]
- 10.Summers SA. Ceramides in insulin resistance and lipotoxicity. Prog Lipid Res 2006;45:42–72 [DOI] [PubMed] [Google Scholar]
- 11.Holland WL, Summers SA. Sphingolipids, insulin resistance, and metabolic disease: new insights from in vivo manipulation of sphingolipid metabolism. Endocr Rev 2008;29:381–402 [DOI] [PMC free article] [PubMed] [Google Scholar]
- 12.Maeda N, Shimomura I, Kishida K, et al. Diet-induced insulin resistance in mice lacking adiponectin/ACRP30. Nat Med 2002;8:731–737 [DOI] [PubMed] [Google Scholar]
- 13.Iwabu M, Yamauchi T, Okada-Iwabu M, et al. Adiponectin and AdipoR1 regulate PGC-1alpha and mitochondria by Ca(2+) and AMPK/SIRT1. Nature 2010;464:1313–1319 [DOI] [PubMed] [Google Scholar]
- 14.Civitarese AE, Ukropcova B, Carling S, et al. Role of adiponectin in human skeletal muscle bioenergetics. Cell Metab 2006;4:75–87 [DOI] [PMC free article] [PubMed] [Google Scholar]
- 15.Ge Q, Ryken L, Noel L, Maury E, Brichard SM. Adipokines identified as new downstream targets for adiponectin: lessons from adiponectin-overexpressing or -deficient mice. Am J Physiol Endocrinol Metab 2011;301:E326–E335 [DOI] [PubMed] [Google Scholar]
- 16.Asterholm IW, Scherer PE. Enhanced metabolic flexibility associated with elevated adiponectin levels. Am J Pathol 2010;176:1364–1376 [DOI] [PMC free article] [PubMed] [Google Scholar]
- 17.Shetty S, Ramos-Roman MA, Cho YR, et al. Enhanced fatty acid flux triggered by adiponectin overexpression. Endocrinology 2012;153:113–122 [DOI] [PMC free article] [PubMed] [Google Scholar]
- 18.Patti GJ, Yanes O, Siuzdak G. Innovation: metabolomics: the apogee of the omics trilogy. Nat Rev Mol Cell Biol 2012;13:263–269 [DOI] [PMC free article] [PubMed] [Google Scholar]
- 19.Newgard CB, An J, Bain JR, et al. A branched-chain amino acid-related metabolic signature that differentiates obese and lean humans and contributes to insulin resistance. Cell Metab 2009;9:311–326 [DOI] [PMC free article] [PubMed] [Google Scholar]
- 20.Mihalik SJ, Michaliszyn SF, de las Heras J, et al. Metabolomic profiling of fatty acid and amino acid metabolism in youth with obesity and type 2 diabetes: evidence for enhanced mitochondrial oxidation. Diabetes Care 2012;35:605–611 [DOI] [PMC free article] [PubMed] [Google Scholar]
- 21.Suhre K, Meisinger C, Döring A, et al. Metabolic footprint of diabetes: a multiplatform metabolomics study in an epidemiological setting. PLoS ONE 2010;5:e13953. [DOI] [PMC free article] [PubMed] [Google Scholar]
- 22.Fang X, Palanivel R, Cresser J, et al. An APPL1-AMPK signaling axis mediates beneficial metabolic effects of adiponectin in the heart. Am J Physiol Endocrinol Metab 2010;299:E721–E729 [DOI] [PMC free article] [PubMed] [Google Scholar]
- 23.Charbonneau A, Marette A. Inducible nitric oxide synthase induction underlies lipid-induced hepatic insulin resistance in mice: potential role of tyrosine nitration of insulin signaling proteins. Diabetes 2010;59:861–871 [DOI] [PMC free article] [PubMed] [Google Scholar]
- 24.Fang X, Palanivel R, Zhou X, et al. Hyperglycemia- and hyperinsulinemia-induced alteration of adiponectin receptor expression and adiponectin effects in L6 myoblasts. J Mol Endocrinol 2005;35:465–476 [DOI] [PubMed] [Google Scholar]
- 25.Yu C, Chen Y, Cline GW, et al. Mechanism by which fatty acids inhibit insulin activation of insulin receptor substrate-1 (IRS-1)-associated phosphatidylinositol 3-kinase activity in muscle. J Biol Chem 2002;277:50230–50236 [DOI] [PubMed] [Google Scholar]
- 26.Yoo HH, Son J, Kim DH. Liquid chromatography-tandem mass spectrometric determination of ceramides and related lipid species in cellular extracts. J Chromatogr B Analyt Technol Biomed Life Sci 2006;843:327–333 [DOI] [PubMed] [Google Scholar]
- 27.Evans AM, DeHaven CD, Barrett T, Mitchell M, Milgram E. Integrated, nontargeted ultrahigh performance liquid chromatography/electrospray ionization tandem mass spectrometry platform for the identification and relative quantification of the small-molecule complement of biological systems. Anal Chem 2009;81:6656–6667 [DOI] [PubMed] [Google Scholar]
- 28.Ohta T, Masutomi N, Tsutsui N, et al. Untargeted metabolomic profiling as an evaluative tool of fenofibrate-induced toxicology in Fischer 344 male rats. Toxicol Pathol 2009;37:521–535 [DOI] [PubMed] [Google Scholar]
- 29.Kubota N, Terauchi Y, Yamauchi T, et al. Disruption of adiponectin causes insulin resistance and neointimal formation. J Biol Chem 2002;277:25863–25866 [DOI] [PubMed] [Google Scholar]
- 30.Nawrocki AR, Rajala MW, Tomas E, et al. Mice lacking adiponectin show decreased hepatic insulin sensitivity and reduced responsiveness to peroxisome proliferator-activated receptor gamma agonists. J Biol Chem 2006;281:2654–2660 [DOI] [PubMed] [Google Scholar]
- 31.Holland WL, Miller RA, Wang ZV, et al. Receptor-mediated activation of ceramidase activity initiates the pleiotropic actions of adiponectin. Nat Med 2011;17:55–63 [DOI] [PMC free article] [PubMed] [Google Scholar]
- 32.Duggan GE, Hittel DS, Sensen CW, Weljie AM, Vogel HJ, Shearer J. Metabolomic response to exercise training in lean and diet-induced obese mice. J Appl Physiol 2011;110:1311–1318 [DOI] [PubMed] [Google Scholar]
- 33.Duggan GE, Hittel DS, Hughey CC, Weljie A, Vogel HJ, Shearer J. Differentiating short- and long-term effects of diet in the obese mouse using (1) H-nuclear magnetic resonance metabolomics. Diabetes Obes Metab 2011;13:859–862 [DOI] [PubMed] [Google Scholar]
- 34.Spagou K, Theodoridis G, Wilson I, et al. A GC-MS metabolic profiling study of plasma samples from mice on low- and high-fat diets. J Chromatogr B Analyt Technol Biomed Life Sci 2011;879:1467–1475 [DOI] [PubMed] [Google Scholar]
- 35.Kim HJ, Kim JH, Noh S, et al. Metabolomic analysis of livers and serum from high-fat diet induced obese mice. J Proteome Res 2011;10:722–731 [DOI] [PubMed] [Google Scholar]
- 36.Kleemann R, van Erk M, Verschuren L, et al. Time-resolved and tissue-specific systems analysis of the pathogenesis of insulin resistance. PLoS ONE 2010;5:e8817. [DOI] [PMC free article] [PubMed] [Google Scholar]
- 37.Bertram HC, Larsen LB, Chen X, Jeppesen PB. Impact of high-fat and high-carbohydrate diets on liver metabolism studied in a rat model with a systems biology approach. J Agric Food Chem 2012;60:676–684 [DOI] [PubMed] [Google Scholar]
- 38.Rubio-Aliaga I, Roos Bd, Sailer M, et al. Alterations in hepatic one-carbon metabolism and related pathways following a high-fat dietary intervention. Physiol Genomics 2011;43:408–416 [DOI] [PubMed] [Google Scholar]
- 39.Macotela Y, Emanuelli B, Bång AM, et al. Dietary leucine—an environmental modifier of insulin resistance acting on multiple levels of metabolism. PLoS ONE 2011;6:e21187. [DOI] [PMC free article] [PubMed] [Google Scholar]
- 40.Grösch S, Schiffmann S, Geisslinger G. Chain length-specific properties of ceramides. Prog Lipid Res 2012;51:50–62 [DOI] [PubMed] [Google Scholar]
- 41.Ritov VB, Menshikova EV, He J, Ferrell RE, Goodpaster BH, Kelley DE. Deficiency of subsarcolemmal mitochondria in obesity and type 2 diabetes. Diabetes 2005;54:8–14 [DOI] [PubMed] [Google Scholar]
- 42.Meijer AE. The pentose phosphate pathway in skeletal muscle under patho-physiological conditions. A combined histochemical and biochemical study. Prog Histochem Cytochem 1991;22:1–118 [DOI] [PubMed] [Google Scholar]
- 43.Adams SH. Emerging perspectives on essential amino acid metabolism in obesity and the insulin-resistant state. Adv Nutr 2011;2:445–456 [DOI] [PMC free article] [PubMed] [Google Scholar]
- 44.Robertson DA, Singh BM, Nattrass M. Effect of obesity on circulating intermediary metabolite concentrations in the absence of impaired glucose tolerance. Int J Obes 1991;15:635–645 [PubMed] [Google Scholar]
- 45.Würtz P, Tiainen M, Mäkinen VP, et al. Circulating metabolite predictors of glycemia in middle-aged men and women. Diabetes Care 2012;35:1749–1756 [DOI] [PMC free article] [PubMed] [Google Scholar]
- 46.Melnik BC. Leucine signaling in the pathogenesis of type 2 diabetes and obesity. World J Diabetes 2012;3:38–53 [DOI] [PMC free article] [PubMed] [Google Scholar]
- 47.Prentki M, Madiraju SR. Glycerolipid metabolism and signaling in health and disease. Endocr Rev 2008;29:647–676 [DOI] [PubMed] [Google Scholar]
- 48.Zhang C, Wendel AA, Keogh MR, Harris TE, Chen J, Coleman RA. Glycerolipid signals alter mTOR complex 2 (mTORC2) to diminish insulin signaling. Proc Natl Acad Sci USA 2012;109:1667–1672 [DOI] [PMC free article] [PubMed] [Google Scholar]
- 49.Gonzalez-Baró MR, Lewin TM, Coleman RA. Regulation of triglyceride metabolism. II. Function of mitochondrial GPAT1 in the regulation of triacylglycerol biosynthesis and insulin action. Am J Physiol Gastrointest Liver Physiol 2007;292:G1195–G1199 [DOI] [PMC free article] [PubMed] [Google Scholar]
- 50.Muoio DM, Seefeld K, Witters LA, Coleman RA. AMP-activated kinase reciprocally regulates triacylglycerol synthesis and fatty acid oxidation in liver and muscle: evidence that sn-glycerol-3-phosphate acyltransferase is a novel target. Biochem J 1999;338:783–791 [PMC free article] [PubMed] [Google Scholar]
- 51.Tokumura A. Metabolic pathways and physiological and pathological significances of lysolipid phosphate mediators. J Cell Biochem 2004;92:869–881 [DOI] [PubMed] [Google Scholar]
- 52.Brooker G, Jeffery J, Nataraj T, Sair M, Ayling R. High anion gap metabolic acidosis secondary to pyroglutamic aciduria (5-oxoprolinuria): association with prescription drugs and malnutrition. Ann Clin Biochem 2007;44:406–409 [DOI] [PubMed] [Google Scholar]
- 53.Koenig P, Nagl C, Neurauter G, Schennach H, Brandacher G, Fuchs D. Enhanced degradation of tryptophan in patients on hemodialysis. Clin Nephrol 2010;74:465–470 [DOI] [PubMed] [Google Scholar]
- 54.Oxenkrug GF. Metabolic syndrome, age-associated neuroendocrine disorders, and dysregulation of tryptophan-kynurenine metabolism. Ann N Y Acad Sci 2010;1199:1–14 [DOI] [PubMed] [Google Scholar]
- 55.Li LO, Hu YF, Wang L, Mitchell M, Berger A, Coleman RA. Early hepatic insulin resistance in mice: a metabolomics analysis. Mol Endocrinol 2010;24:657–666 [DOI] [PMC free article] [PubMed] [Google Scholar]
Associated Data
This section collects any data citations, data availability statements, or supplementary materials included in this article.