

Abstract
Type 2 diabetes (T2D) disproportionally affects African Americans (AfA) but, to date, genetic variants identified from genome-wide association studies (GWAS) are primarily from European and Asian populations. We examined the single nucleotide polymorphism (SNP) and locus transferability of 40 reported T2D loci in six AfA GWAS consisting of 2,806 T2D case subjects with or without end-stage renal disease and 4,265 control subjects from the Candidate Gene Association Resource Plus Study. Our results revealed that seven index SNPs at the TCF7L2, KLF14, KCNQ1, ADCY5, CDKAL1, JAZF1, and GCKR loci were significantly associated with T2D (P < 0.05). The strongest association was observed at TCF7L2 rs7903146 (odds ratio [OR] 1.30; P = 6.86 × 10⁻⁸). Locus-wide analysis demonstrated significant associations (Pemp < 0.05) at regional best SNPs in the TCF7L2, KLF14, and HMGA2 loci as well as suggestive signals in KCNQ1 after correction for the effective number of SNPs at each locus. Of these loci, the regional best SNPs were in differential linkage disequilibrium (LD) with the index and adjacent SNPs. Our findings suggest that some loci discovered in prior reports affect T2D susceptibility in AfA with similar effect sizes. The reduced and differential LD pattern in AfA compared with European and Asian populations may facilitate fine mapping of causal variants at loci shared across populations.
Type 2 diabetes (T2D) is a major public health problem affecting 25.8 million people in the U.S. (1). Marked racial differences in its prevalence have been observed, with African American (AfA) adults >40 years of age having nearly twofold higher prevalence than European Americans (27.1 and 15.5%, respectively) (2). In addition to socioeconomic and behavioral risk factors, genetic factors are likely contributors to T2D risk in AfA (3).
Genome-wide association studies (GWAS) for T2D and related traits have successfully identified >50 loci with common genetic variants associated with T2D risk in primarily European-descent populations (4–14) and more recently in East and South Asians (15–21). The reported index single nucleotide polymorphisms (SNPs) at these loci have been replicated in multiple populations (22–24) but less successfully in AfA (25–27). Although differences in environment and lack of study power may partly account for the lack of transferability across ethnicities, differences in linkage disequilibrium (LD) patterns, effect sizes, and risk allele frequency also likely impact the replication of index SNPs. Although the long-range LD in European populations allows for the identification of T2D loci using less dense markers, causal variants are not distinguishable from other nearby SNPs in high LD. This issue prompts the need to examine T2D loci in other populations with different allelic and LD architecture, which may help fine mapping of the underlying functional variants (28).
We performed a comprehensive evaluation of the LD region of T2D loci reported in European and Asian GWAS in a meta-analysis of six AfA GWAS. By testing the index and nearby SNPs, we evaluated the transferability of the previously reported loci for T2D association in AfA. We demonstrated that the reduced and differential LD structure in AfA facilitated fine mapping of regions potentially harboring causal variants at some T2D loci.
RESEARCH DESIGN AND METHODS
Subjects.
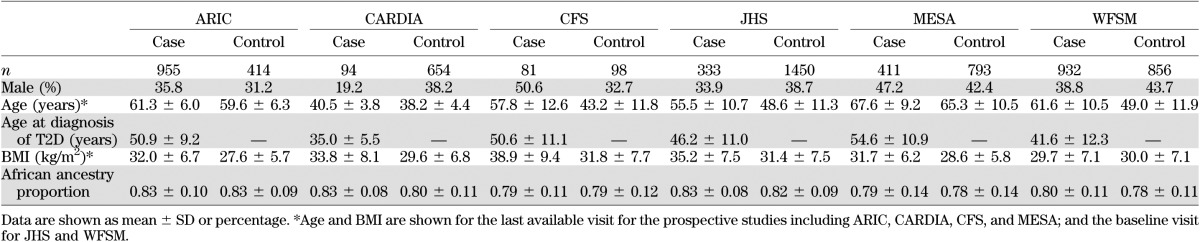
The study samples include AfA from the National Heart, Lung, and Blood Institute’s (NHLBI’s) Candidate Gene Association Resource (CARe) and the Wake Forest School of Medicine (WFSM) study. CARe is an NHLBI shared resource comprised of five cohorts with multiple phenotypes for GWAS in AfA. The study design of CARe has been described in detail elsewhere (26). The five CARe cohorts are as follows: Atherosclerosis Risk in Communities (ARIC), Coronary Artery Risk Development in Young Adults (CARDIA), Cleveland Family Study (CFS), Jackson Heart Study (JHS), and Multi-Ethnic Study of Atherosclerosis (MESA). Details of the study cohorts are described in the Supplementary Data. Written informed consent was obtained from all study participants. Recruitment and sample collection procedures were approved by the institutional review board from the respective institutions. The clinical characteristics of all cohorts are summarized in Table 1.
TABLE 1.
Characteristics of study subjects
Clinical definitions.
T2D was diagnosed according to the American Diabetes Association criteria (29) with at least one of the following: fasting glucose ≥126 mg/dL, 2-h oral glucose tolerance test glucose ≥200 mg/dL, random glucose ≥200 mg/dL, use of oral hypoglycemic agents and/or insulin, or physician-diagnosed diabetes. Subjects diagnosed before 25 years of age were excluded. Normal glucose tolerance was defined as fasting glucose <100 mg/dL and 2-h oral glucose tolerance test glucose <140 mg/dL (if available) without reported use of diabetes medications. Control subjects <25 years of age were excluded.
Genotyping, imputation, and quality control.
Genotyping was performed using the Affymetrix Genome-Wide Human SNP Array 6.0 in all samples. For the CARe study, genotyping, quality control, and data analyses were performed centrally by the CARe analytical group at the Broad Institute, and details are described elsewhere (26). For the WFSM study, genotyping was performed at the Center for Inherited Disease Research (CIDR), and analyses were performed at WFSM and described elsewhere (30,31). For all studies, imputation was performed using MACH with the function –mle (version 1.0.16, http://www.sph.umich.edu/csg/abecasis/MaCH/) to obtain missing genotypes and replace genotypes inconsistent with reference haplotypes. In general, SNPs with call rate ≥95% and minor allele frequency (MAF) ≥1% that passed study-specific quality control were used for imputation (26,32). A 1:1 HapMap II (NCBI Build 36) CEU:YRI (European:African) consensus haplotype was used as reference. Imputation was performed in two steps. The first step selected a random subset of unrelated samples to calculate recombination and error rate estimates. The second step used these rates to impute all samples across the SNPs in the entire reference panel. A total of 2,333,531–2,907,112 SNPs from each study with call rate ≥95%, MAF ≥1%, minor allele count (MAC) ≥10, and Hardy-Weinberg P value ≥0.0001 for genotyped SNPs and MAF ≥1%, MAC ≥10, and RSQ ≥0.5 for imputed SNPs were included in subsequent data analyses.
Principal component analysis.
Principal component (PC) was computed on each study by using high-quality SNPs (26,32,33). The first PC was highly correlated (r2 >0.87) with global African-European ancestry, as measured by ANCESTRYMAP (34), STRUCTURE (35), or FRAPPE (36). The AfA samples had an average of 80% African ancestry. By analyzing unrelated samples from all studies using SMARTPCA (33), only the first PC appeared to account for substantial genetic variation in the screen plot (data not shown), whereas the subsequent PCs may reflect sampling noise and/or relatedness in samples (34). The first PC was used as a covariate in the association analyses to adjust for population substructure.
Statistical analyses
Single SNP association and meta-analysis.
In each study, the association of genotyped and imputed (in dosage) SNPs with T2D was assessed under an additive model with adjustment for age, sex, study center (if applicable), and the first PC. Age at the last visit with other clinical parameters available for prospective studies (ARIC, CARDIA, CFS, and MESA), or at baseline for JHS and WFSM studies, was analyzed. Association tests were performed using logistic regression in PLINK (http://pngu.mgh.harvard.edu/purcell/plink) in unrelated samples and generalized estimating equation in GWAF in R (v2.9.0) (37) in related (CFS) samples. Association results with extreme values (absolute β coefficient or SE >10), primarily due to low cell counts from small sample size and low MAF, were excluded. After genomic control correction within each study, association results were combined by fixed-effect inverse variance weighting implemented in METAL (http://www.sph.umich.edu/csg/abecasis/metal/). Results from SNPs with <50% samples analyzed and those with allele frequency difference >0.3 among studies were excluded. A total of 2,739,003 SNPs were analyzed in the meta-analysis. The mean SNP call rate was 99% in the locus-specific meta-analysis.
Locus-specific analysis.
We used two approaches to test for the transferability of 40 T2D loci in AfA. First, the most significant independent index SNPs (P < 5 × 10⁻⁸) from T2D loci identified through GWAS of T2D and related glucose homeostasis traits were selected from the catalog of published GWAS at the National Human Genome Research Institute until December 2010 (http://www.genome.gov/gwastudies) (38) (Supplementary Table 1). At the CDC123-CAMK1D and KCNQ1 loci, independent T2D index SNPs had been identified in European and East Asian populations, respectively (10,12,16,19). At the C2CD4A-C2CD4B locus, rs7172432 was associated with T2D in East Asians (17). A nearby independent index SNP rs11071657 showing strong association with fasting glucose but modest association with T2D in Europeans (13) was also examined. Additionally, two index SNPs from PPARG and HNF1B that did not reach genome-wide significance were selected due to candidacy and consistent replication. Second, the region of interest for each locus was defined as the boundary of the farthest SNPs that show LD at r2 ≥0.3 with the index SNP in CEU or JPT+CHB (Asian [ASN]) populations and further extended by 100 kb. These regions will likely harbor causal variants that are in LD with the index SNPs reported by the original GWAS. This approach takes into account varying LD block size across the genome and absence of correlated SNPs for some index SNPs in HapMap. Regional pairwise LD was calculated in SNAP (http://www.broadinstitute.org/mpg/snap/) using the HapMap II release 22 CEU and ASN data for loci reported in Europeans and Asians, respectively. The regions of interest range from 200 to 807 kb (Supplementary Table 1), and the effective number of SNPs range from 45 to 156.
In the first approach, SNPs were examined for transferability by directly testing the reported index SNP for T2D association. SNP-specific significance was considered as P < 0.05 in the same direction of association in prior reports. In the second approach, locus transferability was assessed by testing all SNPs in the region of interest. In each locus, the most significant SNP was defined as the best SNP. The effective number of SNPs (independent SNPs) was estimated from the eigenvalues of the covariance matrix of the SNPs in each locus using the Li and Ji method implemented in SOLAR (39). Empirical locus-specific P values, Pemp, were adjusted for multiple comparisons by Bonferroni correction for the effective number of SNPs.
Conditional and haplotype analyses.
For loci showing significant regional associations, logistic regression was performed conditioned on both the index and best SNPs to reveal the presence of independent or residual associations. Haplotype analysis of the index and best SNPs was also performed by a haplotype-specific test using --chap in PLINK to compare differences of frequencies of each haplotype with a reference haplotype between cases and controls. Best-guess genotypes were analyzed for imputed SNPs. All analyses were performed separately in each study, adjusted for age, sex, study center, and the first PC. The conditional analyses also adjusted for inflation factor from GWAS in each study. Effect sizes were then combined by meta-analysis.
Population differentiation and natural selection.
Four methods were applied to evaluate whether the differences in genetic architecture between the ancestries of AfA or between the discovery populations and AfA account for the differential association signals for AfA in this study. For the index SNPs, the absolute difference of risk allele frequency was assessed between AfA and CEU (or ASN) populations for loci identified in Europeans and East Asians, respectively. We also assessed two matrices using Haplotter, FST for measurement of population differentiation, and integrated haplotype score for the detection of recent positive selection in the CEU (or ASN) and YRI populations (40). To assess for interpopulation differences in LD patterns, the varLD method was used to assess genome-wide distribution of varLD scores between CEU (or ASN) and YRI (41). The varLD scores were standardized, and the 100-kb regions flanking the index T2D SNPs were examined. A standardized varLD score exceeding the 95th percentile of the distribution was considered a significant LD difference between the studied populations.
Power analysis.
Posterior study power was calculated using the genetic power calculator (42) under an additive model, using the SNP-specific effective sample size (43) of this study and reported effect sizes from the replication phases (wherever available) or all phases in prior T2D reports to minimize winner’s curse effect.
All statistical tests were performed by PLINK, GWAF, or SAS v.9.1 (SAS Institute, Cary, NC), unless otherwise specified. A nominal P value <0.05 for index SNPs was considered significant. A Bonferroni P value (Pemp) <0.05 corrected for the effective number of SNPs was considered significant for regional SNPs.
RESULTS
Clinical characteristics of the study samples.
Clinical characteristics of the six GWAS cohorts are shown in Table 1. A total of 2,806 T2D case subjects and 4,265 control subjects (6,701 effective sample size) were included. The mean age at diagnosis of T2D in case subjects varied from 35.0 to 54.6 years among studies.
GWAS and meta-analysis.
A total of 2.3–2.9 million SNPs that passed quality control were tested for association with T2D in each cohort separately. Inflation factors for the associations were 1.022 for ARIC, 1.020 for CARDIA, 1.084 for CFS, 1.079 for JHS, 1.009 for MESA, and 1.054 for WFSM cohorts before genomic control. The inflation factor for the meta-analysis result was 1.027 after genomic control in 2,739,003 SNPs. Results from T2D candidate loci were selected for subsequent analyses. No correlation was observed between association results and FST with first PC adjustment. In addition, the inflation factor and association results with adjustment for the first 10 PCs are similar (data not shown), suggesting that adjustment for the first PC is sufficient to control for population substructure.
Association analyses of index SNPs.
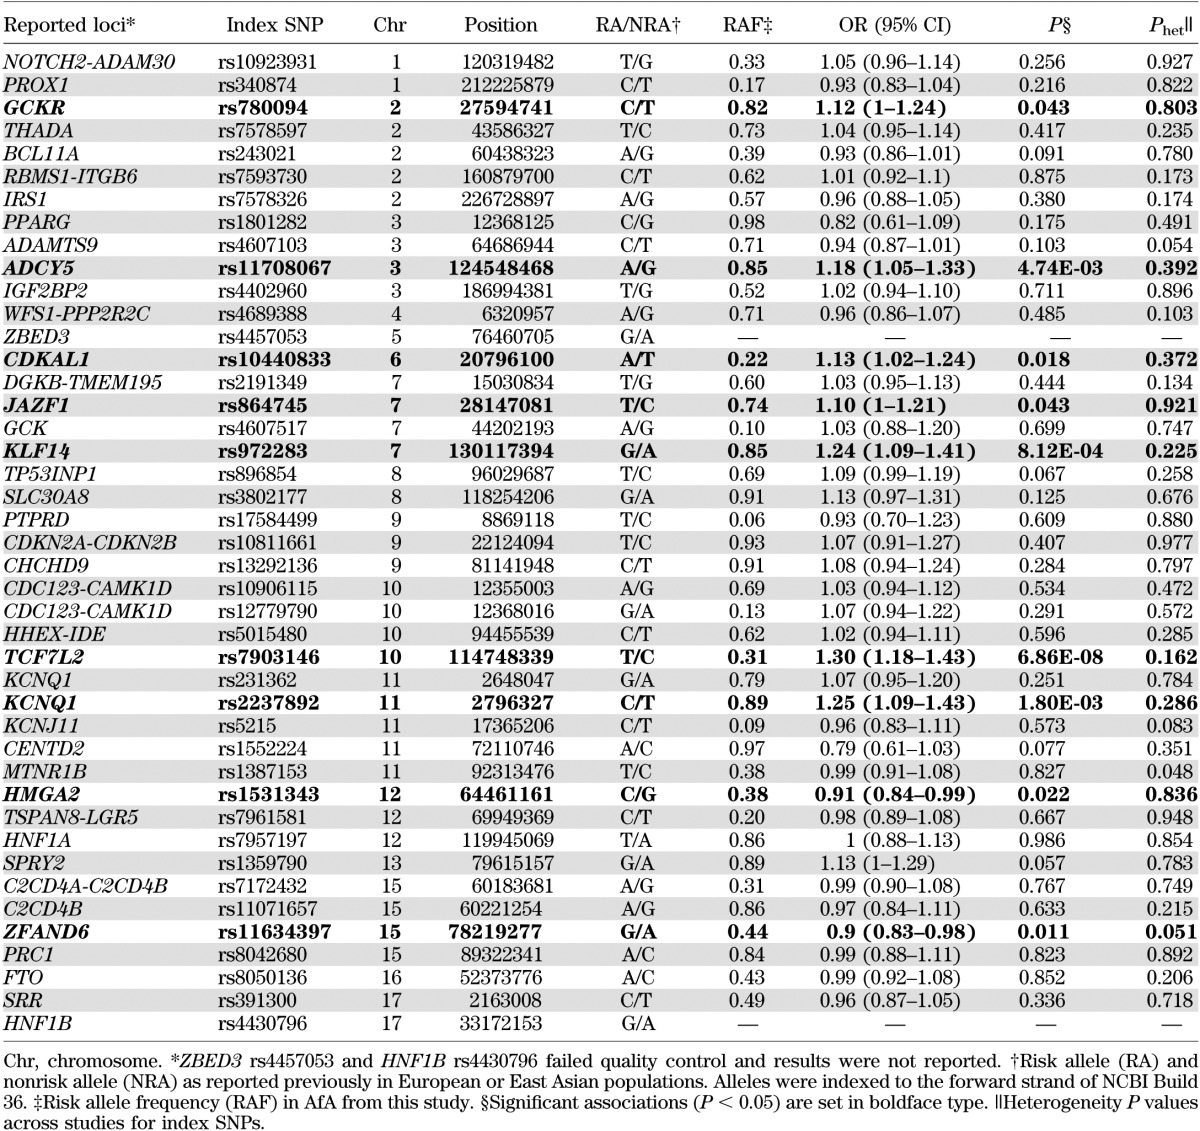
The association of 43 independent index SNPs from 40 T2D loci identified from GWAS of European and East Asian ancestries is shown in Table 2. No significant heterogeneity of associations was observed after Bonferroni correction of multiple comparisons despite heterogeneous study designs. Among 41 good-quality SNPs, 23 showed directionally consistent association, as in previous reports (binomial test, P = 0.27), and seven were significantly associated with T2D (Supplementary Fig. 1). The strongest association was observed at TCF7L2 rs7903146 (odds ratio [OR] 1.30 [95% CI 1.18–1.43]; P = 6.86 × 10⁻⁸), followed by KLF14, KCNQ1, ADCY5, CDKAL1, JAZF1, and GCKR (OR 1.10–1.25; 8.12 × 10⁻⁴ < P < 0.05). At KCNQ1, the association at the index SNP rs2237892 identified in East Asians (16) was significant and had stronger effect size (OR 1.25 [95% CI 1.09–1.43]; P = 0.0018) than the index SNP rs231362 identified in European populations (12) (1.07 [0.95–1.20]; P = 0.25). Nominal associations were also observed at the index SNPs in HMGA2 and ZFAND6 (0.011 < P < 0.05), but the reported risk alleles in European populations (12) were protective for T2D in AfA. The BMI-associated index SNP rs8050136 was not associated with T2D with (P = 0.839) or without (P = 0.852) BMI adjustment.
TABLE 2.
Association of reported T2D index SNPs in AfA
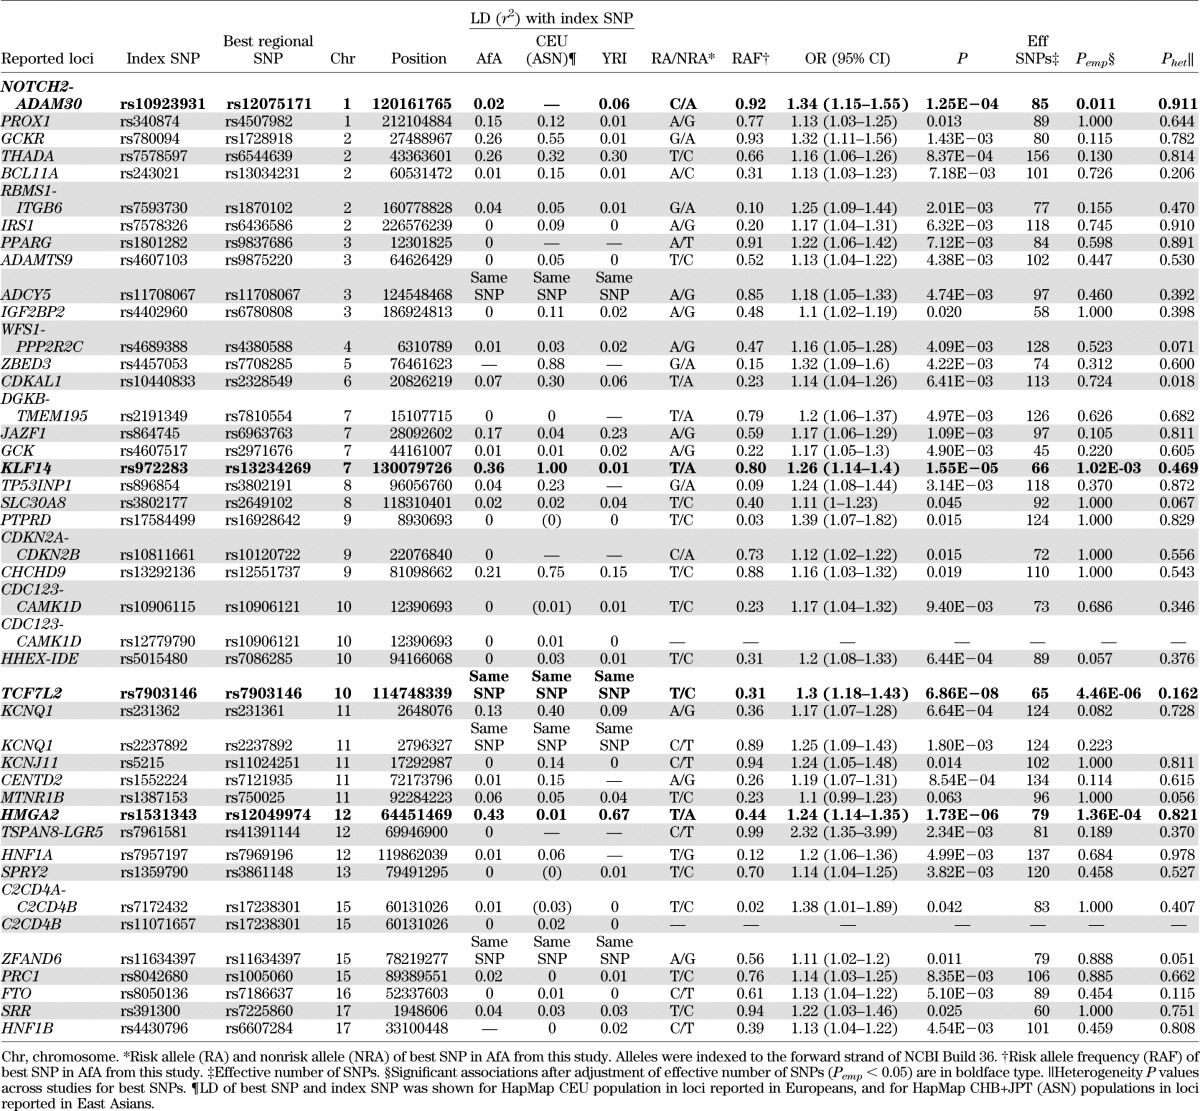
Best SNPs in regional association analyses.
The regions defined by boundary SNPs in moderate LD (r2 ≥0.3) to the index SNPs were evaluated further. By defining the best SNP as the most significant SNP in each region, four of the significant index SNPs (rs7903146 at TCF7L2, rs11708067 at ADCY5, rs2237892 at KCNQ1, and rs11634397 at ZFAND6) were also the best SNPs in the respective regions (Tables 2 and 3). After correction for multiple comparisons among the effective number of SNPs in each region, the association signal among the best SNPs at four loci, TCF7L2, KLF14, HMGA2, and NOTCH2-ADAM30, remained significant (4.46 × 10⁻⁶ < Pemp < 0.05) (Table 3).
TABLE 3.
Transferability of reported T2D loci in AfA
TCF7L2.
The most significant best SNP was rs7903146 located at intron 3 of TCF7L2 (OR 1.30; P = 6.86 × 10⁻⁸; Pemp = 4.46 × 10⁻⁶), which was also the index SNP reported in European and East Asian populations (12,44). Although rs7903146 was in strong LD (r2 >0.8) with several nearby SNPs in a 64-kb LD region in CEU (Fig. 1A), it was located in a 9-kb LD block in AfA (Fig. 1B). No SNPs were in strong LD with rs7903146 in AfA (r2 ≤0.6) or YRI (r2 <0.4). The second strongest SNP was rs7069007 (OR 1.40 [95% CI 1.23–1.58]; P = 1.63 × 10⁻⁷; Pemp = 1.1 × 10⁻⁵). This SNP was no longer significant after adjustment for rs7903146 (P = 0.21), suggesting that rs7903146 represented the sole association signal in this region.
FIG. 1.


Association plots and LD patterns at the regions flanking the index SNPs at TCF7L2 (A and B), KLF14 (C and D), HMGA2 (E and F), NOTCH2-ADAM30 (G and H), and KCNQ1 (I–L). At the top panel of each plot, the x-axis denotes genomic position and the y-axis denotes the −log(P value) for the association of each SNP in AfA. Each locus contains two plots. The plots on the left denote the location of the index SNPs (blue arrows) and the color of each data point represents its LD value (r2) with the index SNPs in the HapMap II CEU or JPT+CHB (ASN) populations, for loci identified in Europeans and East Asians, respectively. The blue line represents the recombination rate in the respective HapMap populations. The LD plots (D′ and r2) in the respective HapMap populations are shown in the bottom panel. The plots on the right denote the location of the best SNPs (red arrows), and the color of each data point represents its LD value (r2) with the best SNPs in our AfA samples. The blue line represents the recombination rate in the HapMap YRI population. The LD plot (D′ and r2) for our AfA samples is shown at the bottom panel.
KLF14.
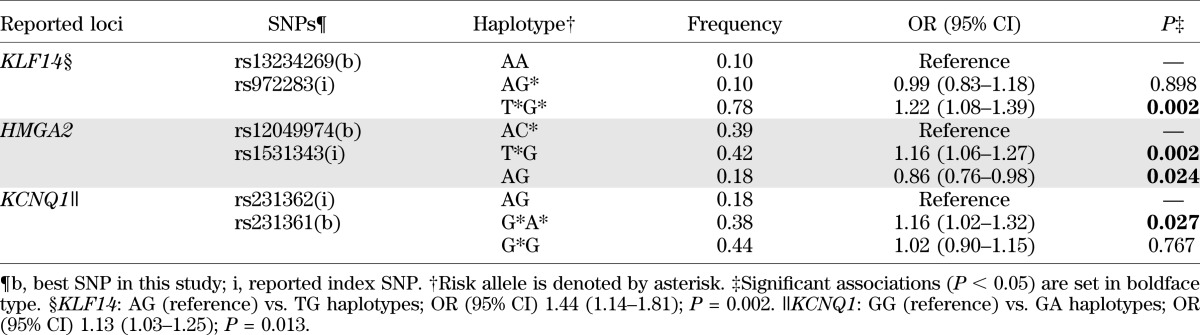
At the KLF14 locus, the best SNP rs13234269 (OR 1.26 [95% CI 1.14–1.40]; P = 1.55 × 10⁻⁵; Pemp = 0.001) was located at 5′ of KLF14, 38 kb from the index SNP rs972283. The best and index SNPs resided in two adjacent LD blocks and were perfectly correlated in CEU (r2 = 1) (Fig. 1C) but showed weak or no correlations in AfA (r2 = 0.36) (Fig. 1D) and YRI (r2 = 0.01) (Table 3). The association was weaker for the index SNP rs972283 (OR 1.24; P = 8.12 × 10⁻⁴) (Table 2) as compared with the best SNP, and was no longer significant after conditioning on the best SNP rs13234269 (P = 0.620). Haplotype analysis of the best and index SNPs revealed three common haplotypes (AA, AG, and TG). As compared with the AA haplotype, the TG haplotype formed by the risk T allele at rs13234269 and the risk G allele at rs972283 was associated with increased risk for T2D (OR 1.22; P = 0.002), but the AG haplotype did not show significant association (OR 0.99; P = 0.898). The TG haplotype was also associated with increased T2D risk when compared with the AG haplotype (P = 0.002) (Table 4).
TABLE 4.
Haplotype analyses of index and best SNPs for association with T2D in AfA
HMGA2.
At the HMGA2 locus, the best SNP rs12049974 (T allele: OR 1.24 [95% CI 1.14–1.35]; P = 1.73 × 10⁻⁶; Pemp=1.36 × 10⁻⁴) and the index SNP rs1531343, which were 100 kb apart, were located at a region of high LD near the 5′ end of HMGA2. They were uncorrelated in CEU (r2 = 0.01) (Fig. 1E) but moderately correlated in AfA (r2 = 0.43) (Fig. 1F) and YRI (r2 = 0.67) (Table 3). The association at the best SNP remained significant after adjustment for the effect of the index SNP (P = 5.07 × 10⁻⁶). The reported-risk C allele at index SNP showed trend of association with increased T2D risk after conditioning on the best SNP (OR 1.14; P = 0.051), in contrast to the protective effect in the unconditional analysis (OR 0.91; P = 0.022) (Table 2). The associations at other nearby SNPs were also substantially weaker (P > 0.001) after conditioning on the best SNP. Three common haplotypes (AC, TG, and AG) were observed using the best and the index SNPs. With reference to the AC haplotype, the TG haplotype was associated with increased T2D risk (OR 1.16 [1.06–1.27]; P = 0.002), whereas the AG haplotype was associated with decreased T2D risk (OR 0.86 [0.76–0.98]; P = 0.024) (Table 4).
NOTCH2-ADAM30.
The best SNP at the NOTCH2/ADAM30 locus was rs12075171 (OR 1.34 [95% CI 1.15–1.55]; P = 1.25 × 10⁻⁴; Pemp = 0.011) located at 5′ end of the nearby gene, REG4. The best and index SNPs were located in discrete LD blocks and were uncorrelated with each other (Fig. 1G and H). None of the other SNPs in this region were significantly associated after correction for the effective number of SNPs. The best SNP did not appear to demonstrate transferability at this locus.
KCNQ1.
Although the regional associations at the KCNQ1 locus did not reveal significance after correction for the effective number of SNPs, several SNPs in two regions near the index SNPs showed nominal associations. At KCNQ1 intron 15, the strongest associations were observed at the index SNP rs2237892 (OR 1.25 [95% CI 1.09–1.43]; P = 0.0018; Pemp = 0.22) and rs2283228 (1.23 [1.08–1.40]; P = 0.0017; Pemp = 0.21), which were highly correlated with each other (r2 = 0.91 in AfA, 0.86 in ASN, 1 in CEU, and 0.92 in YRI) (Fig. 1I and J and Table 3). At KCNQ1 intron 11, the best SNP was rs231361 (1.17 [1.07–1.28]; P = 6.64 × 10⁻⁴; Pemp = 0.082). This SNP was in weak LD (r2 = 0.13 in AfA, 0.40 in CEU, and 0.09 in YRI) (Fig. 1K and L and Table 3) to the insignificant index SNP rs231362. The effects of rs231361 were lower after conditioning on the index SNP alone (1.13 [1.02–1.25]; P = 0.018), and on both the index SNP and a surrogate SNP rs2283202 (r2 = 0.5 to rs231362 in CEU) (1.15 [0.98–1.34]; P = 0.086) (Supplementary Table 2). Haplotype analysis of the index and best SNPs revealed three common haplotypes (AG, GA, and GG). As compared with the AG haplotype, the GA haplotype formed by the risk G allele at rs231362 and the risk A allele at rs231361 was associated with increased risk for T2D (OR 1.16; P = 0.027), but the GG haplotype did not reveal significant association (1.02; P = 0.767). The GA haplotype was also associated with increased T2D risk when compared with the GG haplotype (P = 0.013) (Table 4). The associations at the best SNPs in intron 11 (rs231361) and intron 15 (rs2237892) remained significant after conditioning on each other (P = 0.003 and 0.012, respectively), suggesting independent associations.
Population differentiation and natural selection at index SNPs.
When comparing allele frequencies of the risk alleles at index SNPs in the respective European or East Asian populations, the absolute difference in risk allele frequency varied widely in our AfA samples from 0.01 at HNF1A to 0.58 at PRC1, regardless of whether the index SNPs were associated with T2D in AfA (Supplementary Table 3). Using the YRI population as a surrogate for AfA in this study, FST values at the index SNPs between CEU and YRI, or ASN and YRI populations, were highly significant at only one locus, PRC1 (Supplementary Table 2), suggesting modest population differentiation. Three index SNPs at NOTCH2-ADAM30, HMGA2, and FTO showed significant integrated haplotype scores, suggesting recent positive selection (Supplementary Table 2). Finally, we performed varLD to assess for differential LD around the index SNPs. Four loci at BCL11A, IRS1, DGKB/TMEM195, and PRC1, and one locus at PTPRD, demonstrated significant differences in LD between YRI and CEU or ASN populations, respectively (data not shown).
DISCUSSION
We found that among 41 independent T2D-associated index SNPs, only seven in TCF7L2, KLF14, KCNQ1, CDKAL1, JAZF1, ADCY5, and GCKR were significantly associated with T2D in AfA. The index SNPs in ADCY5 and GCKR were initially identified for strong association with fasting glucose levels in European populations (13), suggesting that genes regulating glucose homeostasis may also affect T2D susceptibility in AfA. The lack of replication for most index SNPs may be partly due to insufficient power, as 16 and 28 SNPs have <50 and <80% power to detect association for the previously reported effect sizes at α level of 0.05, respectively (Supplementary Table 1). In addition, winner’s curse may overestimate the true population effect size in the prior GWAS. Only seven index SNPs in AfA had an effect size greater than or equal to that reported in European and Asian populations (Supplementary Fig. 1). The lower effects in AfA further lower the power to detect the associations.
Several index sets of SNPs showed evidence of recent positive selection (e.g., NOTCH2-ADAM30 rs10923931, HMGA2 rs1531343, and FTO rs8050136), were rare (e.g., PPARG rs1801282 and CENTD2 rs1552224), or revealed considerable differences in risk allele frequencies and population differentiation (e.g., PRC1 rs8042680) in our AfA samples as compared with the European and Asian populations. These factors may also impact the direct replication of prior associations in AfA. Our findings of limited loci showing population differentiation or underselection did not provide support of the thrifty genotype hypothesis, consistent with a study on 17 T2D loci (45). Interestingly, a locus-wide study of 16 T2D loci in worldwide populations revealed many moderately differentiated loci in sub-Saharan Africans (e.g., TCF7L2, KCNJ11, IGF2BP2, and SLC30A8) and several highly differentiated loci in East Asians (e.g., HHEX, THADA, and FTO) that contribute to the global differentiation pattern (46). Recently, Chen et al. (47) showed that risk alleles at 12 T2D loci showed high FST values, as well as a trend of decreasing frequencies from Africa through Europe to East Asia. Our study focused on the index SNP comparison between Africans and Europeans/Asians, whereas the latter two studies examined global differentiation either by locus or by index SNPs. The capture of causal rather than tagging variants in locus-wide analysis and multiethnic comparisons will likely reveal more loci undergoing differentiation and selection.
Differences in genetic architecture likely affect the pattern of associations, and lower degrees of LD in AfA may facilitate fine mapping of causal variants in loci shared by AfA and other populations (28,48). In the locus-specific analysis, our sample size had 80% power to detect an OR of at least 1.19 for risk allele frequency ≥0.2 at α level of 5 × 10⁻⁴ (corrected for average effective number of SNPs). Our results demonstrated that the best SNPs in TCF7L2, KLF14, and HMGA2 were close to or the same as the index SNPs, and the associations remained significant after correction for multiple comparisons. In addition to KCNQ1, we were able to fine map these association signals by comparing LD patterns and analyzing haplotypes formed by the index and best SNPs.
The association at the TCF7L2 index SNP rs7903146 approached genome-wide significance and was the best signal within the locus and among the reported T2D loci, consistent with prior GWAS showing that this SNP was one of the most significant signals in several populations (12,17,20). Indeed, rs7903146 was also the strongest SNP for the present GWAS, and in one of the CARe plus cohorts (WFSM) reported recently (31). Of note, rs7903146 was located in a 9-kb LD block in AfA and was weakly correlated with neighboring SNPs that were not significantly associated after adjustment for the effect at rs7903146. In contrast, rs7903146 resided in a large, 64-kb LD block in Europeans and was strongly correlated with a set of different nearby SNPs (Fig. 1A and B). The differential LD pattern suggests that the risk T allele of rs7903146 is located on different haplotypes in AfA and Europeans. The differential association suggests that rs7903146 was the only SNP showing highly significant association in both populations (Fig. 1A and B). Taken together, T2D association at TCF7L2 was transferable to multiple populations, including AfA, and rs7903146 is likely the causal variant, as suggested by a recent resequencing study (49), or it may share the same haplotype with the causal variant across different populations.
At KCNQ1 intron 15, rs2237892 was the index SNP identified in East Asians and the best SNP in AfA. Similarly, the index and best SNPs at KLF14 were highly correlated in Europeans. In both cases, the best SNPs in AfA were correlated with the same set of SNPs as the index SNPs in East Asians and Europeans, respectively, but at a reduced LD. This suggests that the best and index SNPs may capture a shared causal variant on the same haplotype in these populations. At KCNQ1, rs2237892 and rs2283228 were highly correlated in several populations, including Europeans, Asians, Africans, and AfA, so the two signals were indistinguishable. However, the reduced LD and the absence of association in other nearby SNPs in AfA suggest that those are not the causal variants. At KLF14, significant association was only observed for the TG haplotype carrying risk alleles of both the best and index SNPs, but not for the AG haplotype carrying only risk allele at the index SNP, suggesting that the causal variant may be located closer to the 5′ end of KLF14 as originally reported (12) and likely resides on the TG haplotype shared across the studied populations.
In contrast, the correlations of the best SNPs in AfA and the index SNPs in Europeans at KCNQ1 intron 11 and HMGA2 were relatively weak (r2 <0.5) in both populations. At KCNQ1, the best and index SNPs shared moderate correlations with some nearby SNPs (Fig. 1K and L). Haplotype analyses suggest that AfA and Europeans may share the same causal variant on the GA haplotype formed by risk alleles of both SNPs. The scenario at HMGA2 is more complex. Haplotype analyses showed that the TG haplotype (frequency = 0.42) was at risk for T2D, whereas the AG haplotype (frequency = 0.18) was protective for T2D in AfA when compared with the AC haplotype (frequency = 0.39). The result of the TG haplotype being at risk was consistent with that of single SNP associations where the T allele of the best SNP and the G allele of the index SNP increased risk for T2D in AfA. Note that the AC haplotype was also at risk for T2D when compared with the AG haplotype. The stronger risk effect in the TG haplotype than in the AC haplotype explains the spurious opposite direction of association at the index SNP with or without conditioning on the best SNP. The respective haplotype frequencies are substantially different in CEU (0.04 for TG, 0.86 for AG, and 0.10 for AC). The TG haplotype is rare in Europeans. The AC haplotype is likely at risk for T2D as compared to the AG haplotype, leading to the observation of the index SNP C allele being at risk in Europeans. Recently, a multiethnic, gene-centric study revealed that rs9668162 at HMGA2 was associated with T2D risk in AfA (27). Rs9668162 was moderately correlated (r2 = 0.41) with the best SNP rs12049974 but weakly correlated (r2 = 0.18) with the European index SNP rs1531343 in our AfA samples, supporting our finding of an independent signal at HMGA2 in AfA. Together, this suggests either allelic heterogeneity with different causal variants residing on different haplotypes in different populations, or a common causal variant residing on multiple haplotypes at different frequencies shared across populations.
To our knowledge, this is the first comprehensive fine-mapping study of reported T2D loci in AfA. We found that only 8 out of 40 loci at TCF7L2, KLF14, KCNQ1, ADCY5, CDKAL1, JAZF1, GCKR, and HMGA2 were transferable to AfA with significant associations at the index or nearby SNPs. It should be noted that the magnitudes of association vary dramatically from strong association (TCF7L2) to very nominal evidence, e.g., GCKR and JAZF1. The lack of association is likely due to limitations in study power, population differentiation, and/or differential LD. Additional genetic variants, likely yet to be discovered, will unravel the high prevalence of T2D in AfA populations. Importantly, the reduced and differential LD patterns in AfA at the significant loci support the fine mapping of regions of association in prior reports. Subsequent studies, including higher-density imputation to the 1,000 genomes, trans-ethnic meta-analysis at loci demonstrating population variation in LD structure, and functional studies, will be valuable for localizing causal variants and confirming these findings.
Supplementary Material
ACKNOWLEDGMENTS
Genotyping services for the WFSM study were provided by the CIDR. CIDR is fully funded through a federal contract from the National Institutes of Health (NIH) to The Johns Hopkins University (Contract HHSC268200782096C). The work at Wake Forest was supported by NIH grants K99-DK-081350 (N.D.P.), R01-DK-066358 (D.W.B.), R01-DK-053591 (D.W.B.), R01-HL-56266 (B.I.F.), and R01-DK-070941 (B.I.F.), and in part by the General Clinical Research Center of the WFSM Grant M01-RR-07122. This work was also supported by the NHLBI. The following five parent studies have contributed parent study data, ancillary study data, and DNA samples through the Massachusetts Institute of Technology-Broad Institute (N01-HC-65226) to create this genotype/phenotype database for wide dissemination to the biomedical research community: ARIC, CARDIA, CFS, JHS, and MESA. ARIC is carried out as a collaborative study supported by NHLBI contracts (HHSN268201100005C, HHSN268201100006C, HHSN268201100007C, HHSN268201100008C, HHSN268201100009C, HHSN268201100010C, HHSN268201100011C, and HHSN268201100012C) R01-HL-087641, R01-HL-59367, and R01-HL-086694, National Human Genome Research Institute contract U01-HG-004402, and NIH contract HHSN268200625226C. Infrastructure was partly supported by Grant UL1-RR-025005, a component of the NIH and NIH Roadmap for Medical Research. CARDIA is affiliated with University of Alabama at Birmingham (N01-HC-48047), University of Minnesota (N01-HC-48048), Northwestern University (N01-HC-48049), Kaiser Foundation Research Institute (N01-HC-48050), University of Alabama at Birmingham (N01-HC-95095), Tufts-New England Medical Center (N01-HC-45204), WFSM (N01-HC-45205), Harbor-UCLA Research and Education Institute (N01-HC-05187), and University of California Irvine (N01-HC-45134, N01-HC-95100). CFS is affiliated with Case Western Reserve University (NIH HL-46380 and M01-RR-00080). JHS is affiliated with Jackson State University (N01-HC-95170), University of Mississippi (N01-HC-95171), and Tougaloo College (N01-HC-95172). MESA is conducted and supported by the NHLBI in collaboration with MESA investigators. Support is provided by grants and contracts N01-HC-95159, N01-HC-95160, N01-HC-95161, N01-HC-95162, N01-HC-95163, N01-HC-95164, N01-HC-95165, N01-HC-95166, N01-HC-95167, N01-HC-95168, N01-HC-95169, and RR-024156. Funding for SHARe genotyping was provided by NHLBI Contract N02-HL-6-4278. Funding for CARe genotyping was provided by NHLBI Contract N01-HC-65226. J.B.M. is supported by National Institute of Diabetes and Digestive and Kidney Diseases (R01-DK-078616 and K24-DK-080140).
No potential conflicts of interest relevant to this article were reported.
M.C.Y.N. researched data and wrote and edited the manuscript. R.S. contributed to discussion and reviewed and edited the manuscript. J.L., L.D., and J.X. researched data. N.D.P. and D.W.B. researched data, contributed to discussion, and reviewed and edited the manuscript. L.J.R.-T., J.M.Z., D.S.S., S.R.P., E.D.C., M.S., Y.-D.I.C., A.G.B., M.L., S.F.A.G., B.M.P., J.S.P., C.D.L., B.I.F., J.I.R., and J.G.W. researched data and reviewed and edited the manuscript. J.D. and J.B.M. reviewed and edited the manuscript. M.C.Y.N. is the guarantor of this work and, as such, had full access to all the data in the study and takes responsibility for the integrity of the data and the accuracy of the data analysis.
Part of this study was presented in abstract form at the 60th Annual Meeting of the American Society of Human Genetics, Washington, DC, 2–6 November 2010.
The authors would like to acknowledge the contributions of the involved research institutions, study investigators, field staff, and study participants of ARIC, CARDIA, CFS, JHS, and MESA in creating CARe for biomedical research (http://public.nhlbi.nih.gov/GeneticsGenomics/home/care.aspx).
Footnotes
This article contains Supplementary Data online at http://diabetes.diabetesjournals.org/lookup/suppl/doi:10.2337/db12-0266/-/DC1.
REFERENCES
- 1.Centers for Disease Control and Prevention National Diabetes Fact Sheet: National Estimates and General Information on Diabetes and Prediabetes in the United States. Atlanta, GA, U.S. Department of Health and Human Services, Centers for Disease Control and Prevention, 2011 [Google Scholar]
- 2.Cowie CC, Rust KF, Ford ES, et al. Full accounting of diabetes and pre-diabetes in the U.S. population in 1988-1994 and 2005-2006. Diabetes Care 2009;32:287–294 [DOI] [PMC free article] [PubMed] [Google Scholar]
- 3.Rotimi C, Cooper R, Cao G, Sundarum C, McGee D. Familial aggregation of cardiovascular diseases in African-American pedigrees. Genet Epidemiol 1994;11:397–407 [DOI] [PubMed] [Google Scholar]
- 4.Saxena R, Voight BF, Lyssenko V, et al. Diabetes Genetics Initiative of Broad Institute of Harvard and MIT, Lund University, and Novartis Institutes of BioMedical Research Genome-wide association analysis identifies loci for type 2 diabetes and triglyceride levels. Science 2007;316:1331–1336 [DOI] [PubMed] [Google Scholar]
- 5.Scott LJ, Mohlke KL, Bonnycastle LL, et al. A genome-wide association study of type 2 diabetes in Finns detects multiple susceptibility variants. Science 2007;316:1341–1345 [DOI] [PMC free article] [PubMed] [Google Scholar]
- 6.Sladek R, Rocheleau G, Rung J, et al. A genome-wide association study identifies novel risk loci for type 2 diabetes. Nature 2007;445:881–885 [DOI] [PubMed] [Google Scholar]
- 7.Steinthorsdottir V, Thorleifsson G, Reynisdottir I, et al. A variant in CDKAL1 influences insulin response and risk of type 2 diabetes. Nat Genet 2007;39:770–775 [DOI] [PubMed] [Google Scholar]
- 8.Zeggini E, Weedon MN, Lindgren CM, et al. Wellcome Trust Case Control Consortium (WTCCC) Replication of genome-wide association signals in UK samples reveals risk loci for type 2 diabetes. Science 2007;316:1336–1341 [DOI] [PMC free article] [PubMed] [Google Scholar]
- 9.Wellcome Trust Case Control Consortium Genome-wide association study of 14,000 cases of seven common diseases and 3,000 shared controls. Nature 2007;447:661–678 [DOI] [PMC free article] [PubMed] [Google Scholar]
- 10.Zeggini E, Scott LJ, Saxena R, et al. Wellcome Trust Case Control Consortium Meta-analysis of genome-wide association data and large-scale replication identifies additional susceptibility loci for type 2 diabetes. Nat Genet 2008;40:638–645 [DOI] [PMC free article] [PubMed] [Google Scholar]
- 11.Rung J, Cauchi S, Albrechtsen A, et al. Genetic variant near IRS1 is associated with type 2 diabetes, insulin resistance and hyperinsulinemia. Nat Genet 2009;41:1110–1115 [DOI] [PubMed] [Google Scholar]
- 12.Voight BF, Scott LJ, Steinthorsdottir V, et al. MAGIC investigators. GIANT Consortium Twelve type 2 diabetes susceptibility loci identified through large-scale association analysis. Nat Genet 2010;42:579–589 [DOI] [PMC free article] [PubMed] [Google Scholar]
- 13.Dupuis J, Langenberg C, Prokopenko I, et al. DIAGRAM Consortium. GIANT Consortium. Global BPgen Consortium. Anders Hamsten on behalf of Procardis Consortium. MAGIC investigators New genetic loci implicated in fasting glucose homeostasis and their impact on type 2 diabetes risk. Nat Genet 2010;42:105–116 [DOI] [PMC free article] [PubMed] [Google Scholar]
- 14.Qi L, Cornelis MC, Kraft P, et al. Meta-Analysis of Glucose and Insulin-Related Traits Consortium (MAGIC) Diabetes Genetics Replication and Meta-analysis (DIAGRAM) Consortium Genetic variants at 2q24 are associated with susceptibility to type 2 diabetes. Hum Mol Genet 2010;19:2706–2715 [DOI] [PMC free article] [PubMed] [Google Scholar]
- 15.Unoki H, Takahashi A, Kawaguchi T, et al. SNPs in KCNQ1 are associated with susceptibility to type 2 diabetes in East Asian and European populations. Nat Genet 2008;40:1098–1102 [DOI] [PubMed] [Google Scholar]
- 16.Yasuda K, Miyake K, Horikawa Y, et al. Variants in KCNQ1 are associated with susceptibility to type 2 diabetes mellitus. Nat Genet 2008;40:1092–1097 [DOI] [PubMed] [Google Scholar]
- 17.Yamauchi T, Hara K, Maeda S, et al. A genome-wide association study in the Japanese population identifies susceptibility loci for type 2 diabetes at UBE2E2 and C2CD4A-C2CD4B. Nat Genet 2010;42:864–868 [DOI] [PubMed] [Google Scholar]
- 18.Tsai FJ, Yang CF, Chen CC, et al. A genome-wide association study identifies susceptibility variants for type 2 diabetes in Han Chinese. PLoS Genet 2010;6:e1000847. [DOI] [PMC free article] [PubMed] [Google Scholar]
- 19.Shu XO, Long J, Cai Q, et al. Identification of new genetic risk variants for type 2 diabetes. PLoS Genet 2010;6:pii: e1001127 [DOI] [PMC free article] [PubMed] [Google Scholar]
- 20.Kooner JS, Saleheen D, Sim X, et al. DIAGRAM. MuTHER Genome-wide association study in individuals of South Asian ancestry identifies six new type 2 diabetes susceptibility loci. Nat Genet 2011;43:984–989 [DOI] [PMC free article] [PubMed] [Google Scholar]
- 21.Cho YS, Chen CH, Hu C, et al. DIAGRAM Consortium. MuTHER Consortium Meta-analysis of genome-wide association studies identifies eight new loci for type 2 diabetes in east Asians. Nat Genet 2012;44:67–72 [DOI] [PMC free article] [PubMed] [Google Scholar]
- 22.Ng MC, Park KS, Oh B, et al. Implication of genetic variants near TCF7L2, SLC30A8, HHEX, CDKAL1, CDKN2A/B, IGF2BP2, and FTO in type 2 diabetes and obesity in 6,719 Asians. Diabetes 2008;57:2226–2233 [DOI] [PMC free article] [PubMed] [Google Scholar]
- 23.Waters KM, Stram DO, Hassanein MT, et al. Consistent association of type 2 diabetes risk variants found in Europeans in diverse racial and ethnic groups. PLoS Genet 2010;6:pii: e1001078 [DOI] [PMC free article] [PubMed] [Google Scholar]
- 24.Sim X, Ong RT, Suo C, et al. Transferability of type 2 diabetes implicated loci in multi-ethnic cohorts from Southeast Asia. PLoS Genet 2011;7:e1001363. [DOI] [PMC free article] [PubMed] [Google Scholar]
- 25.Lewis JP, Palmer ND, Hicks PJ, et al. Association analysis in African Americans of European-derived type 2 diabetes single nucleotide polymorphisms from whole-genome association studies. Diabetes 2008;57:2220–2225 [DOI] [PMC free article] [PubMed] [Google Scholar]
- 26.Lettre G, Palmer CD, Young T, et al. Genome-wide association study of coronary heart disease and its risk factors in 8,090 African Americans: the NHLBI CARe Project. PLoS Genet 2011;7:e1001300. [DOI] [PMC free article] [PubMed] [Google Scholar]
- 27.Saxena R, Elbers CC, Guo Y, et al. Large-scale gene-centric meta-analysis across 39 studies identifies type 2 diabetes loci. Am J Hum Genet 2012;90:410–425 [DOI] [PMC free article] [PubMed] [Google Scholar]
- 28.Teo YY, Small KS, Kwiatkowski DP. Methodological challenges of genome-wide association analysis in Africa. Nat Rev Genet 2010;11:149–160 [DOI] [PMC free article] [PubMed] [Google Scholar]
- 29.Genuth S, Alberti KG, Bennett P, et al. Expert Committee on the Diagnosis and Classification of Diabetes Mellitus Follow-up report on the diagnosis of diabetes mellitus. Diabetes Care 2003;26:3160–3167 [DOI] [PubMed] [Google Scholar]
- 30.McDonough CW, Palmer ND, Hicks PJ, et al. A genome-wide association study for diabetic nephropathy genes in African Americans. Kidney Int 2011;79:563–572 [DOI] [PMC free article] [PubMed] [Google Scholar]
- 31.Palmer ND, McDonough CW, Hicks PJ, et al. DIAGRAM Consortium. MAGIC Investigators A genome-wide association search for type 2 diabetes genes in African Americans. PLoS ONE 2012;7:e29202. [DOI] [PMC free article] [PubMed] [Google Scholar]
- 32.Hester JM, Wing MR, Li J, et al. Implication of European-derived adiposity loci in African Americans. Int J Obes (Lond) 2012;36:465–473 [DOI] [PMC free article] [PubMed] [Google Scholar]
- 33.Patterson N, Price AL, Reich D. Population structure and eigenanalysis. PLoS Genet 2006;2:e190. [DOI] [PMC free article] [PubMed] [Google Scholar]
- 34.Patterson N, Hattangadi N, Lane B, et al. Methods for high-density admixture mapping of disease genes. Am J Hum Genet 2004;74:979–1000 [DOI] [PMC free article] [PubMed] [Google Scholar]
- 35.Pritchard JK, Stephens M, Donnelly P. Inference of population structure using multilocus genotype data. Genetics 2000;155:945–959 [DOI] [PMC free article] [PubMed] [Google Scholar]
- 36.Keene KL, Mychaleckyj JC, Leak TS, et al. Exploration of the utility of ancestry informative markers for genetic association studies of African Americans with type 2 diabetes and end stage renal disease. Hum Genet 2008;124:147–154 [DOI] [PMC free article] [PubMed] [Google Scholar]
- 37.Chen MH, Yang Q. GWAF: an R package for genome-wide association analyses with family data. Bioinformatics 2010;26:580–581 [DOI] [PMC free article] [PubMed] [Google Scholar]
- 38.Hindorff LA, Sethupathy P, Junkins HA, et al. Potential etiologic and functional implications of genome-wide association loci for human diseases and traits. Proc Natl Acad Sci USA 2009;106:9362–9367 [DOI] [PMC free article] [PubMed] [Google Scholar]
- 39.Almasy L, Blangero J. Multipoint quantitative-trait linkage analysis in general pedigrees. Am J Hum Genet 1998;62:1198–1211 [DOI] [PMC free article] [PubMed] [Google Scholar]
- 40.Voight BF, Kudaravalli S, Wen X, Pritchard JK. A map of recent positive selection in the human genome. PLoS Biol 2006;4:e72. [DOI] [PMC free article] [PubMed] [Google Scholar]
- 41.Ong RT, Teo YY. varLD: a program for quantifying variation in linkage disequilibrium patterns between populations. Bioinformatics 2010;26:1269–1270 [DOI] [PubMed] [Google Scholar]
- 42.Purcell S, Cherny SS, Sham PC. Genetic Power Calculator: design of linkage and association genetic mapping studies of complex traits. Bioinformatics 2003;19:149–150 [DOI] [PubMed] [Google Scholar]
- 43.Yang Y, Remmers EF, Ogunwole CB, Kastner DL, Gregersen PK, Li W. Effective sample size: quick estimation of the effect of related samples in genetic case-control association analyses. Comput Biol Chem 2011;35:40–49 [DOI] [PMC free article] [PubMed] [Google Scholar]
- 44.Takeuchi F, Serizawa M, Yamamoto K, et al. Confirmation of multiple risk loci and genetic impacts by a genome-wide association study of type 2 diabetes in the Japanese population. Diabetes 2009;58:1690–1699 [DOI] [PMC free article] [PubMed] [Google Scholar]
- 45.Southam L, Soranzo N, Montgomery SB, et al. Is the thrifty genotype hypothesis supported by evidence based on confirmed type 2 diabetes- and obesity-susceptibility variants? Diabetologia 2009;52:1846–1851 [DOI] [PMC free article] [PubMed] [Google Scholar]
- 46.Klimentidis YC, Abrams M, Wang J, Fernandez JR, Allison DB. Natural selection at genomic regions associated with obesity and type-2 diabetes: East Asians and sub-Saharan Africans exhibit high levels of differentiation at type-2 diabetes regions. Hum Genet 2011;129:407–418 [DOI] [PMC free article] [PubMed] [Google Scholar]
- 47.Chen R, Corona E, Sikora M, et al. Type 2 diabetes risk alleles demonstrate extreme directional differentiation among human populations, compared to other diseases. PLoS Genet 2012;8:e1002621. [DOI] [PMC free article] [PubMed] [Google Scholar]
- 48.Teo YY, Ong RT, Sim X, Tai ES, Chia KS. Identifying candidate causal variants via trans-population fine-mapping. Genet Epidemiol 2010;34:653–664 [DOI] [PubMed] [Google Scholar]
- 49.Palmer ND, Hester JM, An SS, et al. Resequencing and analysis of variation in the TCF7L2 gene in African Americans suggests that SNP rs7903146 is the causal diabetes susceptibility variant. Diabetes 2011;60:662–668 [DOI] [PMC free article] [PubMed] [Google Scholar]
Associated Data
This section collects any data citations, data availability statements, or supplementary materials included in this article.