

Abstract
The synthetic retinoid, Fenretinide (FEN), inhibits obesity and insulin resistance in mice and is in early clinical trials for treatment of insulin resistance in obese humans. We aimed to determine whether alterations in retinoic acid (RA)-responsive genes contribute to the beneficial effects of FEN. We examined the effect of FEN on 3T3-L1 adipocyte differentiation and alterations in gene expression in C57Bl/6 and retinaldehyde dehydrogenase (RALDH) 1 knockout (KO) mice fed a high-fat (HF) diet. FEN completely inhibited adipocyte differentiation by blocking CCAAT/enhancer-binding protein (C/EBP) α/peroxisome proliferator–activated receptor (PPAR) γ−mediated induction of downstream genes and upregulating RA-responsive genes like cellular retinol-binding protein-1. In mice fed an HF diet, RA-responsive genes were markedly increased in adipose, liver, and hypothalamus, with short-term and long-term FEN treatment. In adipose, FEN inhibited the downregulation of PPARγ and improved insulin sensitivity and the levels of adiponectin, resistin, and serum RBP (RBP4). FEN inhibited hyperleptinemia in vivo and leptin expression in adipocytes. Surprisingly, hypothalamic neuropeptide Y expression was completely suppressed, suggesting a central effect of FEN to normalize hyperglycemia. Moreover, FEN induced RA-responsive genes in RALDH1 KO mice, demonstrating that FEN can augment RA signaling when RA synthesis is impaired. We show that FEN-mediated beneficial effects are through alterations in retinoid homeostasis genes, and these are strong candidates as therapeutic targets for the treatment of obesity and insulin resistance.
More than one-third of United States adults are obese and at risk for development of type 2 diabetes and a host of other metabolic disorders, including dyslipidemia and cardiovascular disease. Despite the development and clinical use of many antidiabetes drugs, they are limited by adverse effects such as fluid retention, weight gain, congestive heart failure, liver toxicity, and the potential for carcinogenesis (1). Therefore, alternative therapies for the treatment of obesity and type 2 diabetes are needed.
The synthetic retinoid, Fenretinide [N-(4-hydroxyphenyl)retinamide] (FEN) prevents obesity and insulin resistance in mice fed a high-fat (HF) diet (2,3). In addition, FEN lowers serum retinol–binding protein (gene name RBP4) levels in rodents and humans by disrupting the ternary complex of retinol-RBP4-transthyretin and thereby by promoting renal clearance of RBP4 (4,5). However, the antiobesity action of FEN appears to be independent of its ability to lower circulating levels of this protein because FEN reduces obesity development in mice lacking RBP4 and does not appear to alter food intake or energy expenditure (3). Currently, FEN is undergoing a phase II trial for treatment of insulin resistance in obese humans with hepatic steatosis (6). Thus, the mechanisms by which FEN can prevent obesity and insulin resistance are of great interest. FEN was originally developed as a chemotherapeutic agent (7), and then was found to attenuate cancer cell growth by mechanisms such as apoptosis and reactive oxygen species generation. However, these effects appear to vary in different cells (8). FEN is now the most widely studied retinoid in clinical trials of breast cancer chemoprevention because of its selective accumulation in breast tissue and its favorable toxicological profile (9,10). One mild and reversible side effect is a reduction in circulating retinol levels and deficits in dark adaptation attributable to lowering of circulating RBP4 levels (4,5,11).
Retinoid homeostasis is tightly regulated by a complex system of enzymes and carriers that can promote the storage of retinol in the form of retinyl esters (RBP4, cellular RBP1, CRBP1, and lecithin:retinol acyltransferase); metabolism to retinoic acid (RA) and signaling through its receptors (retinaldehyde dehydrogenase [RALDH1], cellular RA-binding protein, CRABP, and RA receptors [RARs]); and degradation via cytochrome P450-type enzymes (CYP26A1) (12). It has long been known that RA potently blocks adipogenesis when introduced at early stages of differentiation (13–15). More recently, the importance of retinoid homeostasis in whole-body energy balance and glucose homeostasis has been highlighted in genetic knockout (KO) studies of RALDH1 (lean phenotype), CRBP1, and CRABP1 (obese phenotype) (16–18). Because initial mouse studies indicated that FEN could be a promising therapeutic agent to treat or prevent obesity, and because insulin resistance, glucose intolerance, and human cancer trials have demonstrated few side effects, we sought to further investigate the mechanisms by which FEN inhibits adiposity and alters glucose and lipid homeostasis. We aimed to determine whether FEN inhibits adipocyte differentiation and alters adipose and hepatic gene expression, and whether alterations in retinoid homeostasis could contribute to the mechanism of FEN-induced leanness in the setting of diet-induced obesity.
RESEARCH DESIGN AND METHODS
Cell culture.
The 3T3-L1 preadipocytes (ZenBio) were cultured in Dulbecco's modified Eagle's medium (DMEM) with 10% bovine calf serum (16170; Gibco) and 1% pyruvate (growth media). Differentiation was induced 2 days postconfluency with DMEM containing 10% fetal bovine serum (A15-104; PAA), 1% pyruvate, 1% penicillin/streptomycin, 1 μmol/L dexamethasone, 0.5 mmol/L 3-isobutyl-1-methylxanthine, and 10 μg/mL insulin (MDI media). MDI media were removed after 48 h and were replaced every 2 days with MDI media without 3-isobutyl-1-methylxanthine and dexamethasone. FEN, RA, and rosiglitazone (ROSI) were dissolved in DMSO and added as indicated (see figure legends). FEN was a generous gift from U. Thurneer (Cilag AG, Switzerland). Cells were tested for viability using Resazurin assays (R&D Systems).
Animals.
Male C57BL/6 wild-type mice were from Charles River (Edinburgh, UK). Mice were group-housed (four per box) for gene expression studies or individually housed for food intake and calorimetry, were exposed to 12-h/12-h light–dark, and had ad libitum access to food and water. Three-month-old mice were randomized by body weight and were administered a 45% HF diet (D12450B; Research Diets, New Brunswick, NJ), HF-containing 0.04% wt/wt FEN (Research Diets), or chow diet (801722 CRM(P); Special Diets Service) for the duration of the studies. FEN HF mice received FEN ∼30 mg/kg per day. Six-week-old mice were used for the short-term diet study. RALDH1 KO mice were generously provided by G. Duester (19); RBP4 KO mice were provided by L. Quadro (20). Mice were killed at the end of each experiment by cardiac exsanguination under CO2-induced anesthesia or cervical dislocation. Hypothalamus was precisely dissected from fresh brains on an ice-cold platform following anatomical landmarks. All tissues were rapidly dissected, frozen in liquid nitrogen, and stored at −80°C. Animal procedures were approved by University of Aberdeen Ethics Review Board and performed under license (PPL60/3951) approved by the UK Home Office.
Metabolic studies.
Body composition was measured by dual-energy X-ray absorptiometry (Lunar PIXIMUS-Densitometer; GE Medical Systems). Metabolic rate (energy expenditure) was measured by indirect, open-circuit calorimetry (CLAMS; Columbus Instruments) during 4–6 weeks of diet. All mice were acclimatized to monitoring cages for 3 h before measurements of O2 consumption. Food intake was measured every 3 days from initiation of diet for 4 weeks, during weeks 10–12 during long-term diet treatment, and before and during short-term treatment. Serum insulin, leptin, resistin, tumor necrosis factor-α, and interleukin-6 were measured using Milliplex Adipokine Panel (MADPK-71K; Millipore) on the Luminex platform at 20 weeks of diet treatment. On all other occasions, serum leptin was measured by ELISA (Crystal Chem). Serum glucose was measured by glucose oxidase assay (TR15103; Thermo) after collection of blood from tail vein of live mice.
Lipogenesis assay.
The assay was performed as described previously (21). Briefly, mice fed ad libitum were killed by cervical dislocation at 18 weeks of diet and perigonadal adipose was dissected. Adipocytes were isolated, resuspended (2% packed cell volume), and incubated with D-[6-3H] glucose and insulin. Triplicate assays were stopped with scintillation liquid and 3H lipid was measured.
Gene expression analysis.
Total RNA was isolated from frozen tissue or 3T3-L1 monolayers using peqGOLD TriFast (Peqlab). Specifically for adipose, TriFast homogenates were centrifuged and lipid layer was removed before phase separation. cDNA was synthesized using Bioscript cDNASynthesis Kit (Bioline), 1 μg RNA, and oligo (dT) 18 primers and random hexamer primers. Quantitative PCR was performed using GoTaq qPCR Master Mix (Promega) and gene-specific primers on the LightCycler-480 (Roche). Relative mRNA levels were calculated using the Pfaffl method (22) normalized to hypoxanthine-guanine phosphoribosyltransferase or 18S.
Immunoblotting.
Frozen tissue lysates were prepared in RIPA buffer and SDS-PAGE was performed and transferred to nitrocellulose (21). The following antibodies were used: total insulin receptor sc-711; total Akt/protein kinase B (PKB) sc-8312 (Santa Cruz); RBP4 (Dako); phospho-Akt/PKB 9271; phospho-S6 4858; phospho-ERK1/2 4376; adipose triglyceride lipase (ATGL) 2138 and HSL 4107 (Cell Signaling); and phospho-insulin receptor 44804G (Invitrogen). Proteins were visualized using enhanced chemiluminescence and were quantified with Image J software or Fusion imaging system and Bio-1D software (Peqlab).
Statistical analysis.
Data are presented as means ± SEM and were compared using one-way ANOVA with post hoc tests or Student t test (when indicated in figure legends).
RESULTS
Fenretinide inhibits 3T3-L1 differentiation.
Because RA has been shown to inhibit adipocyte differentiation, we examined the effect of FEN on adipocyte differentiation in 3T3-L1 cells. The 1 μmol/L FEN potently inhibited 3T3-L1 differentiation (Fig. 1A). Similar inhibition was obtained with RA, whereas the peroxisome proliferator–activated receptor (PPAR) γ activator ROSI, a potent inducer of the adipogenic program, was used to stimulate the rate of differentiation. Up to five-fold higher FEN did not affect cell viability (Supplementary Fig. 1). Terminal markers of adipogenesis aP2, CD36, adiponectin, and lipoprotein lipase LPL were almost completely inhibited by FEN or RA (Fig. 1B). GLUT4 mRNA was highly expressed in differentiated cells but was not detected in undifferentiated control (−VE CONT), RA, or FEN cells (data not shown). Similar results were obtained with the upstream intermediate markers PPARγ and C/EBPα (Fig. 1C). Expression of C/EBPβ mRNA, which normally increases transiently during early phases of adipogenesis, was not affected by FEN or RA (Fig. 1C).
FIG. 1.
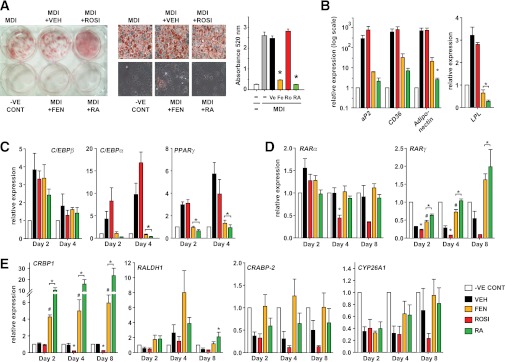
FEN inhibits 3T3-L1 preadipocyte differentiation and upregulates retinoid responsive genes. A: Oil-red-O staining and lipid quantification of 3T3-L1 adipocytes differentiated for 8 days with MDI media and indicated compounds (FEN, RA, and ROSI at 1 μmol/L or DMSO as vehicle [VEH]) added at day 0. RA was used as a known inhibitor and ROSI was used as a promoter of differentiation. Middle panels show 40× images of representative cell morphology and staining from six-well plate (left panel). Total lipid was quantified by eluting the stain and measuring absorbance at 520 nm (right panel). Significance (P < 0.05 by one-way ANOVA followed by Tukey post hoc test or t test if indicated) is shown by *ROSI, FEN, or RA compared with VEH or #FEN compared with RA. B: Gene expression of terminal adipocyte markers at day 8 of 3T3-L1 differentiation observed in cell treatments shown in (A: undifferentiated control [−VE CONT], clear bar; VEH, black bar; ROSI, red bar; FEN, orange bar; RA, green bar). aP2, CD36, and adiponectin FEN compared with VEH trended to be significantly different by t test (P = 0.097, 0.086, and 0.051, respectively). C: Early gene marker profile of key transcription factors involved in the induction of adipogenesis. Cells were treated with MDI media and the indicated compounds as in (A). Relative expression of genes was measured at the indicated time points. D and E: Gene expression profile of retinoid metabolism–related genes. Time points indicate day of differentiation from cell treatments shown in (A). The t test was used to calculate significant difference for RARγ on day 2 and 4, ROSI compared with VEH and on day 8, FEN vs. VEH and for CRBP1 on day 2, 4, and 8, FEN compared with VEH and on day 4 and 8 ROSI vs. VEH. Otherwise significance was calculated by ANOVA. Gene expression was analyzed by quantitative PCR analysis. MDI values were removed because no significant differences were observed between MDI ± VEH in all cases. Data represents mean ± SEM of three separate experiments (performed on different days and different passage cells). (A high-quality digital representation of this figure is available in the online issue.)
Because FEN is a synthetic retinoid, we tested its effects on retinoid-signaling genes (Fig. 1D and 1E). RARα was transiently upregulated with differentiation, and this was prevented by RA only. RARγ levels were downregulated during differentiation, and this was prevented by RA or FEN and expression levels induced above those of −VE CONT cells. RARβ was not expressed in these cells. RA signaling can be further regulated by several proteins controlling retinoid metabolism that are themselves regulated by RA signaling via RA response elements (RAREs) in their promoters. CRBP1, RALDH1, and CRABP2 all were upregulated with RA or FEN (Fig. 1E). The major degradation enzyme for RA, CYP26A1, was markedly repressed by induction of differentiation, and this trended to be inhibited by FEN or RA. Strikingly, all the retinoid metabolism genes examined were coordinately repressed with ROSI treatment (Fig. 1D and 1E).
Fenretinide inhibits lipid accumulation in fully differentiated 3T3-L1 adipocytes.
Next, we tested if FEN could reduce lipid accumulation in fully differentiated 3T3-L1 cells (Fig. 2), because FEN has been shown to inhibit adiposity and adipocyte lipid content in vivo (3). As expected, RA did not affect lipid accumulation in fully differentiated 3T3-L1 cells (15); however, FEN treatment significantly reduced lipid content by 26% (Fig. 2A). The mechanism of this reduction may involve a coordinate reduction in the expression levels of adipocyte genes fatty acid synthase (FAS), LPL, hormone-sensitive lipase (HSL), ATGL, leptin, and RBP4 to levels lower than in vehicle (VEH) and/or RA-treated adipocytes (Fig. 2B and C). FEN significantly induced CRBP1 and RALDH1, and it induced small increases in RARα and RARγ, but it did not affect the expression of other retinoid genes measured (Fig. 2C). To test whether FEN-treated cells were more insulin-sensitive, cells were stimulated with insulin and Akt/PKB phosphorylation was analyzed. Akt/PKB phosphorylation was increased 3.5-fold in FEN-treated adipocytes, indicating improved insulin sensitivity (Fig. 2D).
FIG. 2.
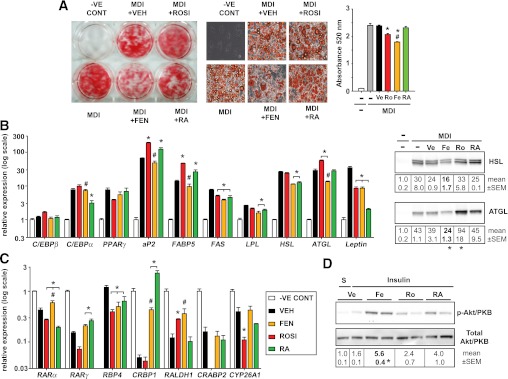
Identification of divergent effects of FEN in fully differentiated adipocytes. A: Differentiated 3T3-L1 adipocytes were used to determine if FEN could reduce lipid content of mature adipocyte cells. 3T3-L1 cultures were differentiated with MDI alone for 8 days and then were subjected to the indicated treatments for an additional 8 days (FEN, RA, and ROSI at 1 μmol/L). Oil-red-O staining and lipid accumulation quantification of 3T3-L1 adipocytes revealed FEN significantly reduced triglyceride levels, unlike RA, which did not significantly change. MDI plus VEH had equivalent DMSO added as treated cells. Middle panels show 40× images of representative cell morphology/staining from six-well plate (left panel). Total lipid was quantified by eluting the stain and measuring absorbance at 520 nm (right panel). All graphs represent mean ± SEM of three separate experiments (performed on different plates of cells). Significance (P < 0.05 by one-way ANOVA followed by Tukey post hoc test or t test if indicated) is shown for *ROSI, FEN, or RA compared with vehicle (VEH) or for #FEN vs. RA. B: Relative expression levels of adipocyte genes observed from cultures described in (A) (quantitative PCR analysis, left panel). Immunoblots of HSL and ATGL protein levels (right panel). The t test was used to calculate significant difference for ATGL FEN or ROSI compared with VEH. HSL FEN vs. VEH trended to be significantly different by t test (P = 0.06). N = 2 different plates of cells. Otherwise significance was calculated by ANOVA. C: Retinoid metabolism gene expression levels observed in 3T3-L1 cultures shown in (A). The t test was used to calculate significant difference for RARγ FEN or RA vs. VEH, for CRBP1 FEN vs. VEH, RALDH1 ROSI or FEN vs. VEH, and CYP26A1 ROSI vs. VEH. Otherwise significance was calculated by ANOVA. D: Differentiated 3T3-L1 adipocytes were stimulated with 10 nmol/L insulin (for 15 min after overnight serum-free media) or saline (S) to determine if Fenretinide could increase insulin sensitivity of mature adipocyte cells. Phosphorylation of Akt/PKB at Ser473 and total Akt/PKB protein expression were determined by immunoblotting and the signal quantified. n = 2 different plates of cells. (A high-quality digital representation of this figure is available in the online issue.)
Fenretinide improves adipokine levels in mice with HF-induced obesity.
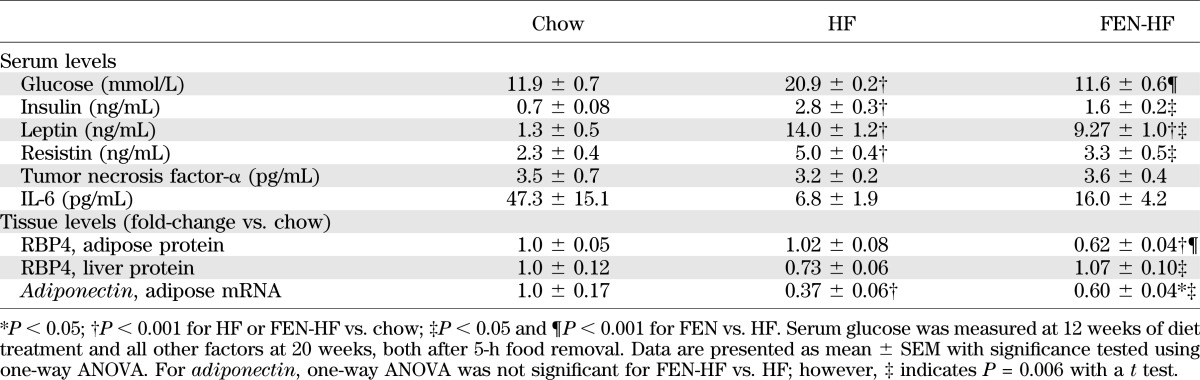
Next, we investigated whether FEN treatment would induce similar alterations in vivo. In C57Bl/6 mice, FEN treatment prevented body weight gain over the course of 20 weeks of HF feeding (Fig. 3A), inhibited adiposity (Fig. 3B), and completely normalized hyperglycemia (Table 1). FEN did not affect lean mass (not shown). White adipose tissue (WAT) dissected from FEN mice and the lipid layer after aqueous buffer homogenization were yellow instead of the normal white or pink (Fig. 3C), suggesting accumulation of FEN (a retinoid with peak UV absorbance at 300–400 nm). Similarly, clinical trials for breast cancer chemoprevention have shown FEN to selectively accumulate in breast, a characteristically fatty tissue (23,24). Thus, we tested whether FEN was acting directly on WAT. As expected, serum leptin levels were reduced (Table 1). Serum RBP4 levels are reduced with FEN treatment (2,5); however, it is not known if FEN affects tissue RBP4 protein levels in vivo. We found that adipose RBP4 protein levels were decreased 40% with FEN compared with HF-fed and chow-fed mice (Table 1). However, hepatic RBP4 protein levels were increased compared with HF-fed mice (Table 1). Elevated levels of serum resistin with HF feeding also were attenuated with FEN treatment (Table 1). Circulating levels and adipose mRNA levels of adiponectin are reduced in obesity and insulin resistance. We found adipose adiponectin mRNA levels were partially normalized, up 63% with FEN treatment (Table 1). Thus, multiple adipose-secreted factors that are altered and implicated in the pathology of obesity and insulin resistance are modulated toward normality by FEN treatment.
FIG. 3.

FEN accumulates in adipose tissue and alters adipose gene expression in HF diet–fed mice. A: Body weight curves of male C57BL/6 mice fed chow (clear circles, n = 16), HF diet (HF; black triangles, n = 24), or HF plus 0.04% wt/wt FEN (FEN-HF; gold triangles, n = 16) from 3 months of age, significance was calculated by one-way ANOVA Bonferroni post hoc test. *P < 0.05 vs. chow; #P < 0.05 vs. HF (except at 8 weeks of diet). B: Body fat content at 12 weeks on diet (chow, clear bar; HF, black bar; or FEN-HF, gold bar). C: Yellow coloration of abdominal adipose tissue in FEN-HF mice dissected after 20 weeks of diet treatment (top panel) and fat layer of adipose RIPA lysates after centrifugation (bottom panel). D: Insulin receptor protein levels in perigonadal adipose quantified after immunoblot (left panel: chow, clear bar; HF, black bar; or FEN-HF, gold bar). Negative correlation of IR protein levels in perigonadal adipose with serum insulin levels at 20 weeks of diet (right panel: chow, clear circles; HF, black triangles; or FEN-HF, gold triangles). E: Insulin-stimulated adipose lipogenesis measured ex vivo in perigonadal adipose. Chow (clear circles), HF (black triangles), or FEN-HF (gold triangles). F: Insulin-stimulated adipose signaling in vivo. Mice were fasted overnight, injected intraperitoneally with 10 mU/g insulin or saline for 10 min and tissues dissected. Phosphorylation of IR, Akt/PKB, S6, and ERK1 were determined by immunoblotting and signal quantified (chow, clear bar; HF, black bar; or FEN-HF, gold bar; n = 4–6 mice). The t test was used to calculate significant difference for p-S6 FEN vs. HF. Otherwise significance was calculated by ANOVA. G–J: Relative expression levels in perigonadal WAT of metabolic (G), energy expenditure (H), and retinoid homeostasis (I) genes, and in subcutaneous WAT (J), chow (clear bars), HF (black bars), or FEN-HF (gold bars). Molecular analysis was performed from six to eight mice per dietary group. The t test was used to calculate significant difference for perigonadal WAT PPARγ, C/EBPα, RBP4, and RALDH1 for FEN-HF vs. HF, aP2 FEN vs. chow and RARβ HF vs. chow, subcutaneous WAT PEPCK all comparisons, RARβ FEN vs. HF, and CYP26A1 chow vs. HF. Otherwise significance was calculated by ANOVA. (A high-quality digital representation of this figure is available in the online issue.)
TABLE 1.
Serum parameters and tissue levels of metabolically important secreted factors
Fenretinide partially normalizes adipose insulin sensitivity in mice fed HF diet.
In association with normalized glycemia, serum insulin levels also were markedly lower in FEN-treated mice compared with HF (Table 1). Insulin receptor (IR) protein levels are downregulated in obesity and insulin resistance, inversely correlating with circulating insulin levels (25,26). We found adipose IR protein levels to be downregulated in HF (Fig. 3D, left panel), inversely correlating with obesity (not shown) and serum insulin levels (Fig. 3D, right panel), and this decrease was attenuated with FEN treatment. Thus, we measured insulin-stimulated lipogenesis in WAT ex vivo as an indicator of WAT insulin sensitivity. Basal lipogenesis in WAT was not altered in HF or FEN HF mice; however, insulin-stimulated lipogenesis was markedly decreased in HF mice and normalized ∼40% in FEN HF mice (Fig. 3E). Moreover, in mice injected with a bolus of insulin, adipose tissue phosphorylation of Akt/PKB trended to be higher, whereas phosphorylation of p70 S6 kinase substrate S6 and of ERK1/2 were significantly decreased (Fig. 3F). S6 kinase is implicated in negative feedback inhibition of insulin signaling, and mice lacking adipose mTORC1–S6 kinase signaling or whole-body ERK1 are lean. Muscle insulin signaling was unaltered (Supplementary Fig. 2). Together, these findings indicate that improvements in adipose insulin signaling are part of the mechanism by which FEN exerts its beneficial action.
FEN alters adipose and hepatic gene expression.
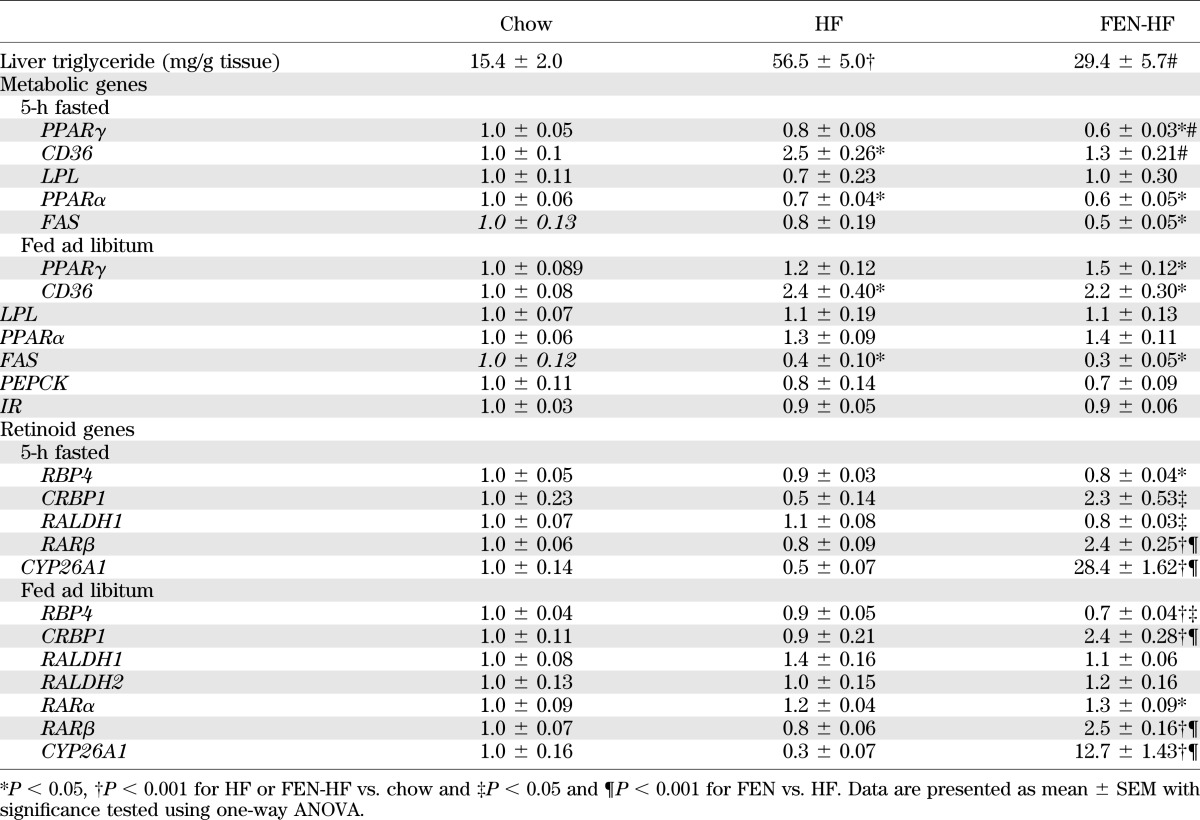
Next, we examined other metabolic genes in WAT that may be altered by HF feeding, obesity, and insulin resistance. We found PPARγ and C/EBPα were decreased ∼50% with HF diet, whereas the decrease in FEN was significantly less (∼30%). Similar gene expression changes were observed with IR, aP2, and LPL (Fig. 3G). GLUT4, PEPCK, and resistin were decreased ∼80–90% with HF diet, but were three-fold higher with FEN (Fig. 3G). CD36, leptin, and UCP1 mRNA were unaltered with FEN treatment (Fig. 3G and H). Next, we tested whether FEN could alter expression of retinoid metabolism and signaling genes. Adipose RBP4 and RALDH1 mRNA levels were downregulated with HF diet, and this was attenuated with FEN, similar to PPARγ levels (Fig. 3I). Strikingly, FEN treatment strongly induced the CRBP1, RARβ, and CYP26A1 in WAT, above and beyond the levels in chow-fed mice (Fig. 3I). Similar data were obtained from subcutaneous WAT (Fig. 3J). Moreover, we found CRBP1, RARβ, and CYP26A1 were similarly upregulated in the liver of FEN mice, whereas RBP4 levels were downregulated (Table 2). We also found that HF-induced elevations in liver triglycerides were substantially decreased with FEN treatment (Table 2). These findings were linked with increased expression of fatty acid transporter CD36 with HF diet that was prevented with FEN (Table 2). Overall, these findings suggest that long-term FEN treatment causes partial normalization of altered metabolic gene expression and potent induction of RA signaling in adipose tissue and liver, despite a reduction in circulating retinol levels.
TABLE 2.
Liver gene expression and triglyceride levels
Effect of FEN on energy expenditure, food intake, and hypothalamic gene expression.
Despite exhibiting decreased adiposity and serum leptin levels, indirect calorimetry did not show an increase in oxygen consumption as a potential mechanism of FEN action (Fig. 4A and B). Rather, oxygen consumption per mouse increased linearly with increased body mass in HF-fed mice (Fig. 4C) and, thus, FEN mice had marginally lower oxygen consumption, appropriate for their weight. Food intake was unaltered with FEN treatment (Fig. 4D). In brown adipose tissue, there was a clear upregulation of CRBP1 and a trend for upregulation of CYP26A1 by FEN; however, UCP1, IR, PEPCK, and RARβ mRNAs were the same in HF and FEN HF mice (Fig. 4E).
FIG. 4.

FEN does not affect energy expenditure or brown adipose UCP1 but completely suppresses hypothalamic NPY. A–C: Energy expenditure of mice during 4–6 weeks on diet during the night (indicated with black bar) and day (A), chow (clear circles), HF (black triangles), or FEN-HF (clear triangles), average over total time measured (B), (chow, clear bar; HF, black bar; or FEN-HF, gray bar), and positive correlation with body weight (C). N = 6–9 mice per dietary group. *P < 0.05 vs. chow by one-way ANOVA and Bonferroni post hoc test; #P < 0.05 by t test FEN-HF vs. HF. D: Gross energy intake during 12–30 days diet (up to energy expenditure measurement). FEN vs. HF is not significant. E and F: Relative gene expression levels in brown adipose tissue (E) and hypothalamus (F), chow (clear bars), HF (black bars), or FEN-HF (gray bars) from mice killed after 20 weeks on diets from 3 months of age. Molecular analysis was performed from 6–8 mice per dietary group. The t test was used to calculate significant difference for brown adipose tissue CYP26A1 HF vs. chow for hypothalamic RALDH1 and RARα FEN-HF vs. HF. Otherwise significance was calculated by ANOVA.
Despite not affecting energy expenditure or food intake, we found that FEN completely suppressed hypothalamic NPY gene expression (Fig. 4F). In addition, FEN induced hypothalamic RALDH1, RADLH2, and RARα mRNAs, indicating a central affect of FEN treatment.
Effect of short-term FEN treatment on adipose and hepatic gene expression.
The large changes in adipose and hepatic gene expression seen in Fig. 3 were associated with long-term FEN treatment (20 weeks), relative leanness, and major improvements in glucose homeostasis. Next, we tested whether long-term FEN treatment was required for these effects. After 1 week of HF diet or FEN and HF diet, both groups gained ∼2 g more than mice fed a chow diet; however, there was a trend for decreased body weight with FEN treatment (Fig. 5A). This effect was not associated with decreased food intake (Fig. 5B). Strikingly, FEN prevented the HF-induced elevation in serum leptin levels (Fig. 5C), with a similar trend for leptin mRNA in WAT, without an effect on other metabolic genes such as GLUT4, adiponectin, or PEPCK (Fig. 5D). In addition, FEN prevented the HF-induced decrease in CRBP1 mRNA in WAT. Short-term FEN treatment also decreased RBP4 mRNA and induced an increase in RARβ and CYP26A1 in WAT relative to both HF-fed and chow-fed mice (Fig. 5D). HF diet led to a characteristic marked downregulation of hepatic SCD-1 (Fig. 5E) and a 20–30% decrease in adipose GLUT4 (Fig. 5D) mRNA in both HF and FEN HF mice. Hepatic PEPCK, a known target of RA signaling, was induced in liver with short-term FEN. No other differences in metabolic genes were observed in liver with short-term FEN; however, CRBP1, lecithin:retinol acyltransferase (LRAT), RARβ, and CYP26A1 all were markedly induced. In addition, we found that hypothalamic NPY mRNA was reduced 29% and 14% with FEN compared with chow diet or HF diet, respectively (Fig. 5F). Thus, short-term FEN treatment is sufficient to induce RA signaling in adipose tissue, liver, and hypothalamus.
FIG. 5.
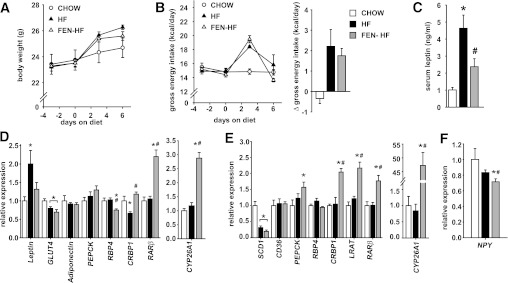
Short-term FEN treatment inhibits HF induced hyperleptinemia and induces retinoid responsive genes. A–C: Male C57 BL/6 mice on chow (clear circles), HF (black triangles), or FEN-HF (clear triangles) for 1 week from 6 weeks age, n = 8 for each diet group. Body weight curves (A) and food intake (B) represented as gross energy intake (left panel) and change in intake from baseline (right panel) and serum leptin levels after 7 days diet (C). D–F: Relative gene expression levels in perigonadal adipose (D), liver (E), and hypothalami (F) after 7 days of diet, chow (clear bars), HF (black bars), or FEN-HF (gray bars). Molecular analysis was performed in 6–8 mice per dietary group. Significance indicated by *P < 0.05 vs. chow and #P < 0.05 vs. HF. The t test was used to calculate significant difference for perigonadal-WAT GLUT4 HF vs. chow, liver PEPCK FEN vs. HF, and hypothalamic NPY FEN vs. HF. Otherwise significance was calculated by ANOVA.
Gene expression alterations in RALDH1 KO and RBP4 KO mice.
Mice lacking the enzyme RALDH1 are compromised in their ability to make RA (19) and have been shown to be resistant to obesity and insulin resistance (16). We examined whether changes in gene expression induced by FEN treatment in normal mice are similarly altered in mice lacking RALDH1. We confirmed that RALDH1 KO mice are resistant to HF-induced obesity (Fig. 6A). In adipose tissue, key metabolic genes that are downregulated in obesity were approximately two-fold higher in RALDH1 KO mice. Moreover, RBP4, CRBP1, and RARβ were induced 1.5-fold to 3-fold (Fig. 6B). In liver, CRBP1 levels were elevated two-fold; however, CYP26A1 levels were dramatically decreased (Fig. 6C). We hypothesized that CYP26A1 levels were decreased to compensate for the reduction in RA production, and thus we tested whether FEN could induce CYP26A1 mRNA in this setting. RALDH1 KO mice administered FEN and HF diet gained less body mass than mice fed HF diet (Fig. 6D). Strikingly, FEN-induced elevations in CYP26A1 and RARβ in both WAT and liver (Fig. 6E). FEN lowers serum RBP4 protein levels but also prevents obesity in RBP4 KO mice (3). Thus, we tested whether similar gene expression alterations were present in RBP4 KO mice. We found no significant changes in the expression of retinoid metabolism and signaling genes in liver or PG-WAT (Fig. 6F), strongly suggesting RBP4 KO and FEN treatment have largely differing modes of action to improve insulin sensitivity.
FIG. 6.

FEN induces retinoid response genes in the absence of RALDH1. A–C: Male RALDH1 KO (black circles) or wild-type (clear circles) mice on HF diet for 4 weeks, n = 4 for each diet group. Body weight curves (A) and relative gene expression levels in perigonadal adipose (B) and liver (C). D and E: Male RALDH1 KO on HF (clear circles or bars) or FEN-HF (black circles or bars) for 1 week, n = 5 for each diet group. Body weight curves (D) and relative mRNA levels in liver and perigonadal adipose (E, left and right panels, respectively). F: Body weight of RBP4 KO and wild-type controls and representative immunoblot of liver RBP4 protein levels (left panel). Relative gene expression levels in liver (middle panel) and perigonadal adipose (right panel). Significance (*P < 0.05) was calculated by t test.
DISCUSSION
Recent studies have identified important regulators of retinoid homeostasis as potential therapeutic targets for obesity (2,16–18). A major limitation to the use of retinol or retinyl-acetate has been the development of liver disease when these compounds are used in high doses for prolonged periods of time (27). However, FEN shows low toxicity compared with other retinoids (7,9,24). In this article, we show that FEN is a potent modulator of retinoid homeostasis genes in association with an improvement in whole-body physiology and in metabolically important genes.
CRBP1, RARβ, and CYP26A1 are known RA-responsive genes because of the presence of RAREs located in their respective promoter regions. The upregulation of these proteins is thought to simultaneously promote the catabolism of RA and storage of retinol into retinyl-esters, thereby preventing the toxic effects of excess RA signaling mediated via RARs. These markers of RA signaling were found to be upregulated with long-term (20 weeks) or short-term (7 days) FEN treatment in all tissues examined (adipose, liver, and hypothalamus) and 3T3-L1 adipocytes. CYP26A1 and CRBP1 also were upregulated in cancer cells treated with FEN (28). Moreover, FEN-induced elevations in CYP26A1 and RARβ independently of RALDH1 activity in HF-fed mice (Fig. 6E), indicating that increased RA production via RALDH1 is not required. Thus, it appears that FEN is directly or indirectly (or both) acting on RAREs in the promoters of these genes.
Many studies examining the effects of FEN on growth inhibition and apoptosis of cancer cell lines have concluded that FEN and RA exert their cellular effects through different pathways independent of RAR expression (29–31). For example, FEN and 4-MPR (the main catabolite of FEN) were found to bind poorly to recombinant RARs in vitro and only minimally activated RAREs and RXREs in cells (30). However, a role for the RARs has been supported by a number of other investigators. Fanjul et al. (32) demonstrated that 5–20 μmol/L FEN could transactivate RARγ and RARβ. RARβ expression is enhanced in normal human mammary cells after FEN exposure (33), and others have documented that RARβ or RARγ expression enhances FEN-mediated events (34,35). It is not clear why these contrasting results have been reported, but cell-type specific factors such as cofactor expression, epigenetic silencing, or phosphorylation may play a role (36–38).
Clearly, in 3T3-L1 cells, the differentiation process initiates a global downregulation of retinoid-responsive genes that FEN or RA is able to completely inhibit. It has been known that RA potently blocks adipogenesis when introduced at early stages of differentiation (13–15). Our results suggest that FEN acts similarly to RA in 3T3-L1 cells by blocking adipogenesis via inhibition of C/EBPβ-mediated transcription (39).
FEN modestly inhibited lipid accumulation in fully differentiated adipocytes (Fig. 2). These results are in marked contrast to those obtained with RA treatment (15), indicating that the exact mechanism of FEN action is not identical to that of RA. This may be because unlike RA, FEN leads to a global reduction in vitamin A levels because of the blockade of retinol transport and the renal loss of serum RBP4 in vivo. Short-term FEN treatment was sufficient to cause a downregulation in adipose RBP4 both in C57Bl/6 mice and in RALDH1 KO mice. Importantly, loss of RBP4 alone was not sufficient to induce the gene expression changes seen with either FEN treatment or RALDH1 genetic deletion. Thus, the effects of FEN are not simply attributable to its effects on RBP4 (3).
RA has been shown to inhibit leptin production or secretion (or both) in cells and in rodents (40,41). Paradoxically, RA also induces UCP1 in brown adipose tissue to increase energy expenditure (42–44). FEN inhibited the HF-induced elevation in leptin serum levels and directly inhibited leptin mRNA by 75% in fully differentiated adipocytes. In a clinical trial in overweight women, FEN improved insulin sensitivity and decreased serum leptin levels (45). We did not detect a difference in food intake or an increase in energy expenditure or brown adipose tissue UCP1 levels. However, we found that FEN completely suppressed hypothalamic NPY expression, and a similar decrease has been shown with a neuronal cell line treated with RA (46). This finding provides a specific mechanism for the complete suppression of hepatic glucose production seen during a euglycemic-hyperinsulinemic clamp (3) and complete normalization of HF-induced hyperglycemia seen in our studies and in those of Yang et al. (2), because central administration of NPY can induce hepatic insulin resistance (47).
The importance of retinoid homeostasis in whole-body energy balance and glucose homeostasis has been highlighted in genetic KO studies (16–18). The CRBP1 and CRABP2 findings are consistent with our own because FEN-induced leanness is associated with robust upregulation of these genes in vivo and in 3T3-L1 adipocytes. In our studies, we confirmed that mice lacking RALDH1 are resistant to HF-induced obesity; however, adipose RALDH1 levels were decreased with long-term HF diet and FEN treatment partially prevented this decline. Moreover, embryonic fibroblasts from RALDH1-deficient mice are impaired in their ability to undergo adipogenesis compared with wild-type fibroblasts (16). Reduced PPARγ levels as the mechanism of impaired adipogenesis in RALDH1 KO cells have been implicated (48). However, this phenotype is not consistent with that of the adipose PPARγ KO mice, which are insulin resistant and experience hepatic steatosis with an HF diet (49). We found adipose tissue of RALDH1 KO mice fed an HF diet had higher levels of PPARγ, IR, GLUT4, and adiponectin, consistent with improved whole-body insulin sensitivity and glucose homeostasis. Moreover, inhibition of 3T3-L1 cell adipogenesis by RA or FEN is associated with a marked upregulation of RALDH1.
FEN is the most widely studied retinoid in clinical trials (10) and is currently undergoing phase II clinical trials for treatment of insulin resistance in obese humans with hepatic steatosis (6). There is an urgent need for efficient and nontoxic drugs to treat obesity and insulin resistance. FEN is relatively nontoxic and has been tested in phase III trials for cancer for periods of up to 5 years. Recently, a novel method to synthesize retinamides has produced a large library of N-(4-hydroxyphenyl)retinamide analogs (50). Although these retinamides have been evaluated for effects on tumor cells and cancer models, it might be useful to screen them for potentially superior effects on the metabolic syndrome. In line with recent studies that have shown that regulators of retinoid homeostasis are potential therapeutic targets for obesity, we present evidence that FEN also is a potent modulator of retinoid homeostasis genes in association with resistance to diet-induced obesity and insulin resistance.
Supplementary Material
ACKNOWLEDGMENTS
This study was supported by the British Heart Foundation Intermediate Basic Research Fellowship FS/09/026 to N.M., RCUK fellowship to M.D., BBSRC DTG to G.D.M. and C.O., and BBSRC project grant BB/G014272/1 to P.J.M.
No potential conflicts of interest relevant to this article were reported.
N.M. and G.D.M. designed experiments. N.M., G.D.M., P.J.M., M.D., C.O., P.N.S., and K.D.S. performed experiments. N.M. wrote the manuscript and contributed financially to the studies. G.D.M., P.J.M., M.D., C.O., P.N.S., and K.D.S. contributed to discussions. G.D.M. contributed to writing the manuscript. P.J.M. and M.D. reviewed the manuscript.
N.M. is the guarantor of this work and, as such, had full access to all the data in the study and takes responsibility for the integrity of the data and the accuracy of the data analysis.
The authors thank Gregg Duester (Sanford-Burnham Medical Research Institute, La Jolla, CA) for RALDH1 KO mice, Loredana Quadro (Rutgers University, New Brunswick, NJ) for RBP4 KO mice, John Speakman (University of Aberdeen, Aberdeen, UK) for invaluable discussion regarding energy expenditure, Vivian Buchan (Rowett Institute of Nutrition and Health, University of Aberdeen, Aberdeen, UK) for technical contribution with adipokine multiplex analysis, and Tonya Martin (Johnson & Johnson, New Brunswick, NJ), and Urs Thurneer (Cilag AG, Schaffhausen, Switzerland) for the generous gift of Fenretinide to use completely without restriction or obligation.
Footnotes
This article contains Supplementary Data online at http://diabetes.diabetesjournals.org/lookup/suppl/doi:10.2337/db12-0458/-/DC1.
REFERENCES
- 1.Nesto RW, Bell D, Bonow RO, et al. Thiazolidinedione use, fluid retention, and congestive heart failure: a consensus statement from the American Heart Association and American Diabetes Association.. Circulation 2003;108:2941–2948 [DOI] [PubMed] [Google Scholar]
- 2.Yang Q, Graham TE, Mody N, et al. Serum retinol binding protein 4 contributes to insulin resistance in obesity and type 2 diabetes. Nature 2005;436:356–362 [DOI] [PubMed] [Google Scholar]
- 3.Preitner F, Mody N, Graham TE, Peroni OD, Kahn BB. Long-term Fenretinide treatment prevents high-fat diet-induced obesity, insulin resistance, and hepatic steatosis. Am J Physiol Endocrinol Metab 2009;297:E1420–E1429 [DOI] [PMC free article] [PubMed] [Google Scholar]
- 4.Berni R, Formelli F. In vitro interaction of fenretinide with plasma retinol-binding protein and its functional consequences. FEBS Lett 1992;308:43–45 [DOI] [PubMed] [Google Scholar]
- 5.Formelli F, Carsana R, Costa A, et al. Plasma retinol level reduction by the synthetic retinoid fenretinide: a one year follow-up study of breast cancer patients. Cancer Res 1989;49:6149–6152 [PubMed] [Google Scholar]
- 6.Veterans Medical Research Foundation, University of California, San Diego. A randomized, double-blind study of the effects of fenretinide administered in subjects with obesity. ClinicalTrials.gov identifier: NCT00546455 2008
- 7.Moon RC, Thompson HJ, Becci PJ, et al. N-(4-Hydroxyphenyl)retinamide, a new retinoid for prevention of breast cancer in the rat. Cancer Res 1979;39:1339–1346 [PubMed] [Google Scholar]
- 8.Hail N, Jr, Kim HJ, Lotan R. Mechanisms of fenretinide-induced apoptosis. Apoptosis 2006;11:1677–1694 [DOI] [PubMed] [Google Scholar]
- 9.Rotmensz N, De Palo G, Formelli F, et al. Long-term tolerability of fenretinide (4-HPR) in breast cancer patients. Eur J Cancer 1991;27:1127–1131 [DOI] [PubMed] [Google Scholar]
- 10.Zanardi S, Serrano D, Argusti A, Barile M, Puntoni M, Decensi A. Clinical trials with retinoids for breast cancer chemoprevention. Endocr Relat Cancer 2006;13:51–68 [DOI] [PubMed] [Google Scholar]
- 11.Decensi A, Torrisi R, Polizzi A, et al. Effect of the synthetic retinoid fenretinide on dark adaptation and the ocular surface. J Natl Cancer Inst 1994;86:105–110 [DOI] [PubMed] [Google Scholar]
- 12.Blomhoff R, Blomhoff HK. Overview of retinoid metabolism and function. J Neurobiol 2006;66:606–630 [DOI] [PubMed] [Google Scholar]
- 13.Sato M, Hiragun A, Mitsui H. Preadipocytes possess cellular retinoid binding proteins and their differentiation is inhibited by retinoids. Biochem Biophys Res Commun 1980;95:1839–1845 [DOI] [PubMed] [Google Scholar]
- 14.Murray T, Russell TR. Inhibition of adipose conversion in 3T3-L2 cells by retinoic acid. J Supramol Struct 1980;14:255–266 [DOI] [PubMed] [Google Scholar]
- 15.Xue JC, Schwarz EJ, Chawla A, Lazar MA. Distinct stages in adipogenesis revealed by retinoid inhibition of differentiation after induction of PPARgamma. Mol Cell Biol 1996;16:1567–1575 [DOI] [PMC free article] [PubMed] [Google Scholar]
- 16.Ziouzenkova O, Orasanu G, Sharlach M, et al. Retinaldehyde represses adipogenesis and diet-induced obesity. Nat Med 2007;13:695–702 [DOI] [PMC free article] [PubMed] [Google Scholar]
- 17.Zizola CF, Frey SK, Jitngarmkusol S, Kadereit B, Yan N, Vogel S. Cellular retinol-binding protein type I (CRBP-I) regulates adipogenesis. Mol Cell Biol 2010;30:3412–3420 [DOI] [PMC free article] [PubMed] [Google Scholar]
- 18.Berry DC, DeSantis D, Soltanian H, Croniger CM, Noy N. Retinoic acid upregulates preadipocyte genes to block adipogenesis and suppress diet-induced obesity. Diabetes 2012;61:1112–1121 [DOI] [PMC free article] [PubMed] [Google Scholar]
- 19.Molotkov A, Duester G. Genetic evidence that retinaldehyde dehydrogenase Raldh1 (Aldh1a1) functions downstream of alcohol dehydrogenase Adh1 in metabolism of retinol to retinoic acid. J Biol Chem 2003;278:36085–36090 [DOI] [PubMed] [Google Scholar]
- 20.Quadro L, Blaner WS, Salchow DJ, et al. Impaired retinal function and vitamin A availability in mice lacking retinol-binding protein. EMBO J 1999;18:4633–4644 [DOI] [PMC free article] [PubMed] [Google Scholar]
- 21.Owen C, Czopek A, Agouni A, et al. Adipocyte-specific protein tyrosine phosphatase 1B deletion increases lipogenesis, adipocyte cell size and is a minor regulator of glucose homeostasis. PLoS ONE 2012;7:e32700. [DOI] [PMC free article] [PubMed] [Google Scholar]
- 22.Pfaffl MW. A new mathematical model for relative quantification in real-time RT-PCR. Nucleic Acids Res 2001;29:e45. [DOI] [PMC free article] [PubMed] [Google Scholar]
- 23.Mehta RG, Moon RC, Hawthorne M, Formelli F, Costa A. Distribution of fenretinide in the mammary gland of breast cancer patients. Eur J Cancer 1991;27:138–141 [DOI] [PubMed] [Google Scholar]
- 24.Formelli F, Clerici M, Campa T, et al. Five-year administration of fenretinide: pharmacokinetics and effects on plasma retinol concentrations. J Clin Oncol 1993;11:2036–2042 [DOI] [PubMed] [Google Scholar]
- 25.Flier JS. Insulin receptors and insulin resistance. Annu Rev Med 1983;34:145–160 [DOI] [PubMed] [Google Scholar]
- 26.Tozzo E, Desbuquois B. Effects of STZ-induced diabetes and fasting on insulin receptor mRNA expression and insulin receptor gene transcription in rat liver. Diabetes 1992;41:1609–1616 [DOI] [PubMed] [Google Scholar]
- 27.Muenter MD, Perry HO, Ludwig J. Chronic vitamin A intoxication in adults. Hepatic, neurologic and dermatologic complications. Am J Med 1971;50:129–136 [DOI] [PubMed] [Google Scholar]
- 28.Villani MG, Appierto V, Cavadini E, et al. Identification of the fenretinide metabolite 4-oxo-fenretinide present in human plasma and formed in human ovarian carcinoma cells through induction of cytochrome P450 26A1. Clin Cancer Res 2004;10:6265–6275 [DOI] [PubMed] [Google Scholar]
- 29.Delia D, Aiello A, Lombardi L, et al. N-(4-hydroxyphenyl)retinamide induces apoptosis of malignant hemopoietic cell lines including those unresponsive to retinoic acid. Cancer Res 1993;53:6036–6041 [PubMed] [Google Scholar]
- 30.Sheikh MS, Shao ZM, Li XS, et al. N-(4-hydroxyphenyl)retinamide (4-HPR)-mediated biological actions involve retinoid receptor-independent pathways in human breast carcinoma. Carcinogenesis 1995;16:2477–2486 [DOI] [PubMed] [Google Scholar]
- 31.Fontana JA, Rishi AK. Classical and novel retinoids: their targets in cancer therapy. Leukemia 2002;16:463–472 [DOI] [PubMed] [Google Scholar]
- 32.Fanjul AN, Delia D, Pierotti MA, Rideout D, Yu JQ, Pfahl M. 4-Hydroxyphenyl retinamide is a highly selective activator of retinoid receptors [published correction appears in J Biol Chem 1996;271(52):33705]. J Biol Chem 1996;271:22441–22446 [DOI] [PubMed] [Google Scholar]
- 33.Swisshelm K, Ryan K, Lee X, Tsou HC, Peacocke M, Sager R. Down-regulation of retinoic acid receptor beta in mammary carcinoma cell lines and its up-regulation in senescing normal mammary epithelial cells. Cell Growth Differ 1994;5:133–141 [PubMed] [Google Scholar]
- 34.Sabichi AL, Hendricks DT, Bober MA, Birrer MJ. Retinoic acid receptor beta expression and growth inhibition of gynecologic cancer cells by the synthetic retinoid N-(4-hydroxyphenyl) retinamide. J Natl Cancer Inst 1998;90:597–605 [DOI] [PubMed] [Google Scholar]
- 35.Liu G, Wu M, Levi G, Ferrari N. Inhibition of cancer cell growth by all-trans retinoic acid and its analog N-(4-hydroxyphenyl) retinamide: a possible mechanism of action via regulation of retinoid receptors expression. Int J Cancer 1998;78:248–254 [DOI] [PubMed] [Google Scholar]
- 36.Ren M, Pozzi S, Bistulfi G, Somenzi G, Rossetti S, Sacchi N. Impaired retinoic acid (RA) signal leads to RARbeta2 epigenetic silencing and RA resistance. Mol Cell Biol 2005;25:10591–10603 [DOI] [PMC free article] [PubMed] [Google Scholar]
- 37.Bruck N, Vitoux D, Ferry C, et al. A coordinated phosphorylation cascade initiated by p38MAPK/MSK1 directs RARalpha to target promoters. EMBO J 2009;28:34–47 [DOI] [PMC free article] [PubMed] [Google Scholar]
- 38.Wang A, Alimova IN, Luo P, Jong A, Triche TJ, Wu L. Loss of CAK phosphorylation of RARalpha mediates transcriptional control of retinoid-induced cancer cell differentiation. FASEB J 2010;24:833–843 [DOI] [PMC free article] [PubMed] [Google Scholar]
- 39.Schwarz EJ, Reginato MJ, Shao D, Krakow SL, Lazar MA. Retinoic acid blocks adipogenesis by inhibiting C/EBPbeta-mediated transcription. Mol Cell Biol 1997;17:1552–1561 [DOI] [PMC free article] [PubMed] [Google Scholar]
- 40.Kumar MV, Scarpace PJ. Differential effects of retinoic acid on uncoupling protein-1 and leptin gene expression. J Endocrinol 1998;157:237–243 [DOI] [PubMed] [Google Scholar]
- 41.Menendez C, Lage M, Peino R, et al. Retinoic acid and vitamin D(3) powerfully inhibit in vitro leptin secretion by human adipose tissue. J Endocrinol 2001;170:425–431 [DOI] [PubMed] [Google Scholar]
- 42.Alvarez R, de Andrés J, Yubero P, et al. A novel regulatory pathway of brown fat thermogenesis. Retinoic acid is a transcriptional activator of the mitochondrial uncoupling protein gene. J Biol Chem 1995;270:5666–5673 [DOI] [PubMed] [Google Scholar]
- 43.Puigserver P, Vázquez F, Bonet ML, Picó C, Palou A. In vitro and in vivo induction of brown adipocyte uncoupling protein (thermogenin) by retinoic acid. Biochem J 1996;317:827–833 [DOI] [PMC free article] [PubMed] [Google Scholar]
- 44.Kumar MV, Sunvold GD, Scarpace PJ. Dietary vitamin A supplementation in rats: suppression of leptin and induction of UCP1 mRNA. J Lipid Res 1999;40:824–829 [PubMed] [Google Scholar]
- 45.Johansson H, Gandini S, Guerrieri-Gonzaga A, et al. Effect of fenretinide and low-dose tamoxifen on insulin sensitivity in premenopausal women at high risk for breast cancer. Cancer Res 2008;68:9512–9518 [DOI] [PMC free article] [PubMed] [Google Scholar]
- 46.Magni P, Beretta E, Scaccianoce E, Motta M. Retinoic acid negatively regulates neuropeptide Y expression in human neuroblastoma cells. Neuropharmacology 2000;39:1628–1636 [DOI] [PubMed] [Google Scholar]
- 47.van den Hoek AM, van Heijningen C, Schröder-van der Elst JP, et al. Intracerebroventricular administration of neuropeptide Y induces hepatic insulin resistance via sympathetic innervation. Diabetes 2008;57:2304–2310 [DOI] [PMC free article] [PubMed] [Google Scholar]
- 48.Reichert B, Yasmeen R, Jeyakumar SM, et al. Concerted action of aldehyde dehydrogenases influences depot-specific fat formation. Mol Endocrinol 2011;25:799–809 [DOI] [PMC free article] [PubMed] [Google Scholar]
- 49.He W, Barak Y, Hevener A, et al. Adipose-specific peroxisome proliferator-activated receptor gamma knockout causes insulin resistance in fat and liver but not in muscle. Proc Natl Acad Sci USA 2003;100:15712–15717 [DOI] [PMC free article] [PubMed] [Google Scholar]
- 50.Mershon SM, Anding AL, Chapman JS, Clagett-Dame M, Stonerock LA, Curley RW., Jr Solid phase-assisted synthesis and screening of a small library of N-(4-hydroxyphenyl)retinamide (4-HPR) analogs. Bioorg Med Chem Lett 2007;17:836–840 [DOI] [PMC free article] [PubMed] [Google Scholar]
Associated Data
This section collects any data citations, data availability statements, or supplementary materials included in this article.