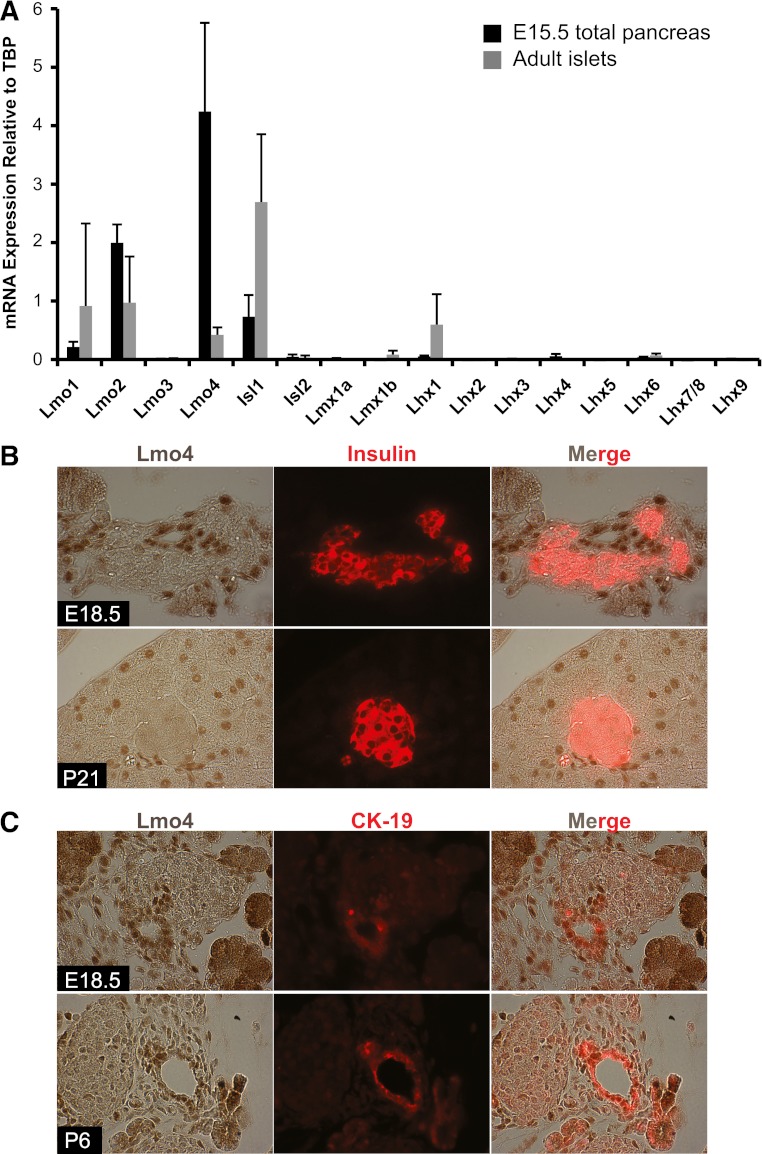
FIG. 2.
Analysis of LIM-HD and Lmo levels in the developing and adult pancreas. A: LIM-HD and Lmo mRNA expression was measured by qPCR in the E15.5 pancreas (black bars) and 3-month-old islets (gray bars). Values are relative to TATA-binding protein (TBP), set at onefold. Error bars represent ± SEM (n = 5). B: Lmo4 (brown) and insulin (red) staining was performed on E18.5 and P21 pancreas tissue. Lmo4 was not found in hormone+ cells. C: Lmo4 (brown) colocalized with the ductal CK-19 (red) marker in E18.5 and P6 pancreata. (A high-quality digital representation of this figure is available in the online issue.)

