

Abstract
Insulin resistance associated with altered fat partitioning in liver and adipose tissues is a prediabetic condition in obese adolescents. We investigated interactions between glucose tolerance, insulin sensitivity, and the expression of lipogenic genes in abdominal subcutaneous adipose and liver tissue in 53 obese adolescents. Based on their 2-h glucose tests they were stratified in the following groups: group 1, 2-h glucose level <120 mg/dL; group 2, 2-h glucose level between 120 and 140 mg/dL; and group 3, 2-h glucose level >140 mg/dL. Liver and adipose tissue insulin sensitivity were greater in group 1 than in group 2 and group 3, and muscle insulin sensitivity progressively decreased from group 1 to group 3. The expression of the carbohydrate-responsive element-binding protein (ChREBP) was decreased in adipose tissue but increased in the liver (eight subjects) in adolescents with impaired glucose tolerance or type 2 diabetes. The expression of adipose ChREBPα and ChREBPβ was inversely related to 2-h glucose level and positively correlated to insulin sensitivity. Improvement of glucose tolerance in four subjects was associated with an increase of ChREBP/GLUT4 expression in the adipose tissue. In conclusion, early in the development of prediabetes/type 2 diabetes in youth, ChREBPβ expression in adipose tissue predicts insulin resistance and, therefore, might play a role in the regulation of glucose tolerance.
Emerging evidence suggests that the ability to retain fat in the subcutaneous adipose tissue (SAT) is beneficial in human obesity because of its association with reduced visceral fat, absence of fat deposition in the liver and muscle, and better insulin sensitivity (1,2). Recently, we showed that a reduced lipogenic/adipogenic expression and number of hypertrophic adipocytes may be linked to hepatic steatosis as well as to insulin resistance in obese adolescents (3). In that study, transcription of genes controlled by sterol-regulatory element-binding protein-1c (SREBP1c) were determined by RT-PCR, along with measures of adipocyte morphometry and cellularity (3). Although this early study indicated an important association between the insulin-stimulated SREBP1c pathway in SAT and ectopic fat accumulation/insulin resistance, it lacked any information about the role of the carbohydrate-responsive element-binding protein (ChREBP), a key determinant of systemic insulin sensitivity and glucose homeostasis (4). The role of adipose tissue in the development of the obesity-related insulin resistance is complex, encompassing increased release of fatty acids, altered adipokine secretion, and/or inflammation (5). Altered adipose tissue glucose metabolism also is a cause of insulin resistance, and adipose-tissue glucose transporter type 4 (GLUT4) plays a central role in systemic glucose metabolism (6,7). Of note, adipose-specific GLUT4 knockout mice have insulin resistance and type 2 diabetes (T2D) (6). Early in the development of type 2 diabetes, downregulation of human and mouse adipose tissue GLUT4 is present (8). More recent studies by Herman et al. (4) have greatly advanced the field by clearly demonstrating that ChREBP, a major regulator of de novo lipogenesis in adipose tissue, is highly regulated by GLUT4 in adipose tissue and that ChREBP in adipose tissue is required for the improved glucose homeostasis resulting from increased adipose GLUT4 expression. Although significant progress has been achieved toward the understanding of the physiological role and expression of ChREBP in adipose and liver tissue of rodents, much less is known about its regulation in humans, particularly in obese adolescents. In the current study, we expand on our previous observation regarding the role of dysregulation of lipogenesis in the pathogenesis of insulin resistance by determining the dynamic changes in the expression of ChREBP and its two recently discovered isoforms, along with GLUT4, patatin-like phospholipase domain-containing protein 3 (PNPLA3), fatty acid synthase (FASN), and acetyl-CoA carboxylase (ACC) in adipocytes obtained from the abdominal subcutaneous depot of obese adolescents with varying degree of glucose tolerance but with similar level of obesity. The expression of ChREBP and its lipogenic target genes also were measured in liver tissue obtained in a subset of subjects in whom a liver biopsy was performed for diagnosis of nonalcoholic fatty liver disease (NAFLD)/nonalcoholic steatohepatitis (NASH). We hypothesized that adolescents with prediabetes or early T2D, independent of obesity, would display reduced transcription of ChREBP in SAT that would correlate with the expression of GLUT4 and insulin resistance and, more importantly, with the level of hyperglycemia. The opposite would be present in the liver, where an increased expression of ChREBP would be associated with hepatic steatosis and insulin resistance.
RESEARCH DESIGN AND METHODS
Subjects.
The Yale Pathophysiology of T2D in Obese Youth Study is a long-term project aimed at examining early alterations in glucose metabolism in relation to fat patterning in obese adolescents. As part of this study, subjects undergo a detailed assessment of glucose tolerance status, a hyperinsulinemic-euglycemic clamp, a dual-energy X-ray absorptiometry scan, and an abdominal magnetic resonance imaging (MRI). Fifty-three obese adolescents agreed to undergo a subcutaneous periumbillical adipose tissue biopsy and were divided into three groups based on their 2-h glucose level: 2-h glucose level <120 mg/dL (27 with normal glucose tolerance [NGT]), between 120 and 140 mg/dL (16 with NGT at risk for impaired glucose tolerance [IGT]), and >140 mg/dL (5 with IGT and 5 with T2D). A liver biopsy was performed in eight subjects because of sustained elevation in ALT. None of the subjects was using any medications known to affect glucose and lipid metabolism. The nature and potential risks of the study were explained to all subjects before obtaining their written informed consent. The study was approved by the ethics committees of the Yale University Hospital. Data on insulin sensitivity, adipocyte cell size, and genes regulating adipogenesis from 38 subjects were reported in a previous report (3).
Metabolic studies
The oral glucose tolerance test.
All subjects were invited to the Yale Center for Clinical Investigation for an oral glucose tolerance test (OGTT) at 8:00 a.m. after an overnight fast. An OGTT was then performed as previously described (9). The composite whole-body insulin sensitivity index was calculated using the formula described by Matsuda et al. (10).
The hyperinsulinemic-euglycemic clamp.
After a 10-h overnight fast, at 7:00 a.m., two intravenous catheters, one for blood sampling and one for infusion of glucose, insulin, and tracers, were inserted in the antecubital vein of each arm after local lidocaine infiltration. The sampling arm was kept in a heated box for arterialization of blood. Whole-body insulin sensitivity was measured by two-step euglycemic clamp by infusing insulin as a primed continuous infusion at 4 mU⋅m−2·min−1 and 80 mU⋅m−2⋅min−1. Each step lasted 2 h. A primed continuous infusion of 6,6-deuterium glucose and of 2H5-glycerol were used to quantify effects of insulin on glucose and glycerol turnover. To maintain the plasma enrichment of 2d-glucose constant throughout the clamp, we used the Hot Glucose infusion (GINF) method (11).
Dual-energy X-ray absorptiometry and MRI.
Whole-body composition was measured by dual-energy X-ray absorptiometry with a Hologic scanner (Boston, MA). Abdominal MRI studies were performed on a GE or Siemens Sonata 1.5-T system (12) as previously reported (13).
Liver fat assessment: fast MRI.
Hepatic fat fraction, an estimate of the percentage of fat in the liver, was measured by fast-gradient MRI (12). This method strongly correlated with 1H-MRS (r = 0.93; P < 0.001) (14), as well as with macrovesicular steatosis determined by liver histology in children (r = 0.86; P < 0.0001) (15).
Subcutaneous adipose biopsies.
After local lidocaine administration, a 1-cm scalpel incision was made inferior to the umbilicus, from which 1 g of SAT was obtained. From this sample, two 30-mg samples were used immediately for osmium fixation, two 50 mg samples were used immediately for in vitro lipogenesis test, and the rest was flash-frozen for RNA extraction. In vitro lipogenesis was tested as previously described (3) (Supplementary Data). RNA was extracted and quantification of several differentially expressed genes by real-time RT-PCR was performed using an ABI 7000 Sequence Detection System (Applied Biosystems, Foster City, CA) (Supplementary Data). RNA expression was studied in 35 subjects (26 in group 1 and 9 in group 3) using Affymetrix Human Gene 1.0 ST arrays (Supplementary Data).
Liver biopsies.
Liver biopsies were performed in eight subjects referred to a pediatric hepatologist because of elevated ALT levels. Half of the specimen was sent to pathology, and the other half was used for RNA extraction and quantitative PCR (Supplementary Data).
Analytical methods.
Plasma glucose levels were measured using the YSI 2700 STAT Analyzer (Yellow Springs Instruments) and lipid levels by an Autoanalyzer (model 747–200; Roche-Hitachi). Plasma insulin, adiponectin, and leptin were measured with a radioimmunoassay (Linco, St. Charles, MO). Analysis of enrichments of 2d-glucose and 2H5-glycerol in plasma was performed as described elsewhere (11). The glucose disposal rate was calculated during the last 30 min (steady state) of each step of the clamp and was expressed as milligrams of glucose per minute per kilogram of lean body mass (LBM) (mg/kg LBM⋅min). Endogenous hepatic glucose production and glycerol turnover at baseline and during the two steps of the insulin clamp, along with the clamped glucose disposal rates, were calculated as previously reported (11).
Statistical analysis.
Univariate general linear model and χ2 test (for categorical variables) were used to compare the clinical and laboratory characteristics among the three groups. Potential confounders (sex, age, BMI, and ethnicity) were entered in an ANOVA (ANCOVA) model in which the metabolic and cell size parameters, as well as gene expression as quantitated by RT-PCR, were dependent variables and the group was the primary grouping variable; non-normally distributed parameters were log-transformed before entry into the model. Spearman correlation was used to assess associations between variables of interest. All analyses were performed using IBM SPSS 19 (SPSS, Chicago, IL). For all analyses, P < 0.05 was considered statistically significant.
RESULTS
Body fat patterning and metabolic characteristics by 2-h glucose levels.
Age, gender, percent total fat, and BMI were similar across the three groups (Table 1). However, the groups differed slightly by ethnicity, with the number of African Americans being lower in the second group. Significant increases in ratios of visceral to visceral and subcutaneous (P = 0.005) and hepatic fat content (%) were observed in the groups with higher 2-h glucose levels (P = 0.022). With the increase in 2-h glucose levels, we observed an increase in fasting glucose (P < 0.001) and insulin levels (P = 0.006), as well as a decrease in insulin sensitivity measured by the OGTT (P = 0.001) and the clamp (P = 0.005). The low insulin infusion caused a greater suppression of hepatic glucose production in group 1 (P = 0.046), whereas during the high-insulin infusion step suppression of hepatic glucose production was identical in all three groups. Basal glycerol turnover did not differ among the groups. In group 3, suppression of lipolysis was less during the low-dose insulin infusion (P = 0.013), whereas during the high-dose it was similar in all three groups (Table 1).
TABLE 1.
Metabolic characteristics of the obese adolescents undergoing fat biopsy (n = 53)

Subcutaneous adipose tissue biopsies.
Affymetrix gene arrays were used to evaluate potential differences in the gene expression profiles of the subcutaneous fat biopsy specimen. The genechip analysis demonstrated that 46 genes were upregulated in group 3 compared with group 1, and 85 genes were downregulated in group 3 compared with group 1. When applying pathway analyses, the transcription ChREBP regulation pathway emerged as one of the most significantly different pathways between group 1 and group 3 (Supplementary Table 1A). Genechip data revealed the downreglation of ChREBP (also known as MLXIPL; foldchange = −1.31; P = 0.010) and PNPLA3 (foldchange = −1.71; P = 0.043) in group 3 (Supplementary Table 1B), which we confirmed with quantitative PCR (ANOVA P < 0.05; Fig. 1A). Based on these data, we focused on ChREBP, a major determinant of adipose tissue fatty acid synthesis and systemic insulin sensitivity (4), which has been shown to regulate PNPLA3 expression (16). Glucose-dependent binding of ChREBP to a carbohydrate-response element in the PNPLA3 promotor recently has been demonstrated by chromatin immunoprecipitation and silencing of ChREBP in human hepatocytes abolished induction of PNPLA3 mRNA by glucose (17).
FIG. 1.

Decreased lipogenic gene expression in SAT across groups. A: Subcutaneous expression of ChREBP, GLUT4, PNPLA3, SREBP1c, FASN, ACC, and thioredoxin-interacting protein (TXNIP), normalized to the expression of 18S ribosomal RNA and based on the expression of a human control adipose tissue (2ΔΔCt). B: Subcutaneous expression of both isoforms of ChREBP (ChREBPα and ChREBPβ), normalized to the expression of 18S ribosomal RNA and based on the expression of a human control adipose tissue (2ΔΔCt). Expression values of group 1 (white bars; 2-h glucose level <120 mg/dL) were set to 1 and values for group 2 (gray bars; 2-h glucose levels 120–140 mg/dL) and group 3 (black bars; 2-h glucose levels >140 mg/dL) are expressed as fold-changes compared with group 1 (mean ± SD, n = 53). **ANCOVA (adjusted for age, gender, ethnicity, and BMI) between the three groups was significant at P < 0.02 (*P < 0.07). (A high-quality color representation of this figure is available in the online issue.)
Expression of both isoforms of ChREBP (α and β) was significantly different across the groups (ANOVA P < 0.02; Fig. 1B). Because ChREBP expression is regulated by GLUT4 in adipose tissue (4), we measured the expression of GLUT4 across the groups and found a significant decrease in GLUT4 expression with increasing 2-h glucose level (P = 0.041; Fig. 1A). ChREBP regulates the transcription of several genes involved in fatty acid synthesis (FASN, ACC) (18) that also are regulated by other transcription factors (like SREBP1c), and the transcription of genes (thioredoxin-interacting protein, Rgs16) (19,20) that are not known to be regulated by other lipogenic transcription factors. Significant differences in the expression of SREBP1c (P = 0.008), FASN (P = 0.006), and ACC (P = 0.028) across the three groups were found with increasing 2-h glucose level, whereas thioredoxin-interacting protein (TXNIP) showing the same trend missed significance (Fig. 1A). Because ACC and FASN are regulated primarily at the level of transcription, it is expected that decreases in the activities of these enzymes are reflected by decreases in their mRNA.
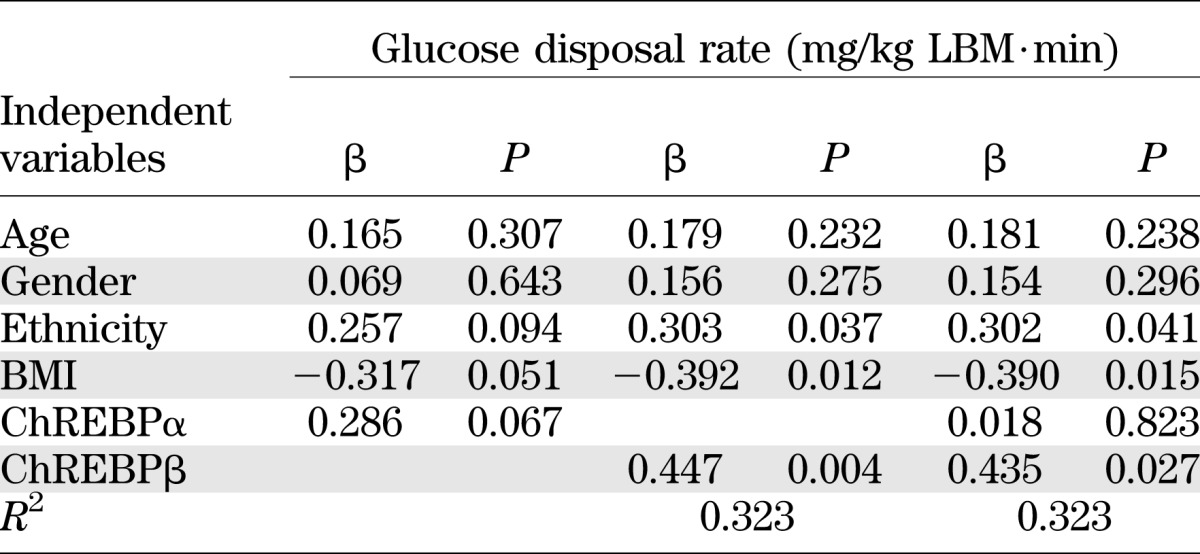
Expression of adipose ChREBP correlates with expression of GLUT4 (r = 0.457; P = 0.001), PNPLA3 (r = 0.480; P = 0.0004), FASN (r = 0.444; P = 0.001), ACC (r = 0.360; P = 0.009), TXNIP (r = 0.410; P = 0.005), 2-h glucose level (r = −0.356; P = 0.010), and insulin sensitivity measured by the clamp (r = 0.368; P = 0.018; n = 43), as well as the OGTT (r = 0.417; P = 0.002; n = 53). Furthermore, the expression of both isoforms of ChREBP (α and β) was significantly correlated with 2-h glucose level (ChREBPα: r = −0.433 and P = 0.002; ChREBPβ: r = −0.307 and P = 0.038) and insulin sensitivity measured by the clamp (ChREBPα: r = 0.329 and P = 0.036; ChREBPβ: r = 0.345 and P = 0.039). Multiple linear regression analysis for ChREBPα and ChREBPβ as predictors of insulin sensitivity measured by the clamp (M/LBM) demonstrated that expression of ChREBPβ, but not ChREBPα, predicts insulin sensitivity (Table 2). Insulin sensitivity measured by the clamp is a better predictor for ChREBPβ expression in SAT (r2 = 0.285; P = 0.004), whereas 2-h glucose level seems to be a better predictor for ChREBPα expression (r2 = 0.120; P = 0.047).
TABLE 2.
Linear regression analysis for predicting insulin sensitivity at the clamp (n = 43)
To determine whether improvement of glucose tolerance status will reverse the downregulation of GLUT4 and ChREBP, we repeated SAT biopsies in four subjects who had improvement from IGT to NGT (Supplementary Table 2; converter), and as a control we repeated biopsies in five subjects who continued to have NGT (Supplementary Table 2; nonconverter). All subjects were recruited from our longitudinal pathophysiology cohort undergoing repeated OGTTs and were treated neither pharmacologically nor through lifestyle interventions. Quantitative PCR on the repeated SAT biopsies showed an increase in the expression of GLUT4, ChREBP, PNPLA3, SREBP1c, FASN, and ACC after improvement in 2-h glucose level (Fig. 2A), whereas no difference in expression was found in the nonconverters (Fig. 2C). The same could be observed for the two ChREBP isoforms, α and β (Fig. 2B, D). Statistical analysis of all nine repeated biopsies showed a significant correlation between change in 2-h glucose level and change in ChREBP expression (r = −0.817; P = 0.007; n = 9), as well as change in insulin sensitivity (M/LBM) and change in ChREBP expression (r = −0.357; P = 0.385; n = 8).
FIG. 2.

Changes in subcutaneous lipogenic gene expression in converters (A, B) or nonconverters (C, D). A and C: Subcutaneous expression of ChREBP, PNPLA3, GLUT4, SREBP1c, FASN, and ACC normalized to the expression of 18S ribosomal RNA and based on the expression of a human control adipose tissue (2ΔΔCt). B and D: Subcutaneous expression of both isoforms of ChREBP (α and β), normalized to the expression of 18S ribosomal RNA and based on the expression of a human control adipose tissue (2ΔΔCt). Expression values of biopsy 1 (white bars) were set to 1, and values for biopsy 2 (black bars) are expressed as fold-changes compared with biopsy 1 (mean ± SD, n = 4 for A, B and n = 5 for C, D).
To assess if the decrease in lipogenic gene expression is associated with a decrease in insulin sensitivity of the adipose tissue, we measured the insulin-stimulated incorporation of glucose into triglycerides in the fresh adipose tissue biopsy specimen using C14-labeled glucose. Insulin-stimulated de novo lipogenesis (nmol glucose incorporated per hour per gram of adipose tissue) was significantly reduced in 5 subjects from group 3 compared with 14 subjects from group 1 (P = 0.047; Fig. 3).
FIG. 3.

Impaired stimulation of de novo lipogenesis in SAT of IGT/T2D. The percent (%) increase in lipogenesis after stimulation with 10 nmol/L insulin compared with the basal lipogenesis (nmol glucose incorporated per hour per gram of adipose tissue) set to 100% in group 1 (2-h glucose levels <120 mg/dL; n = 14; white bar) vs. group 3 (2-h glucose levels >140 mg/dL; n = 5; black bar; mean ± SD; P = 0.047).
Liver biopsies.
Although hepatic steatosis, defined as percentage of hepatic fat fraction >5.5%, was seen in 50% of the entire cohort, liver tissue specimen were obtained only from eight subjects after they underwent a liver biopsy because of persistent elevation in ALT levels. Three subjects had NGT (2-h glucose level <120 mg/dL), three subjects had IGT (2-h glucose level >140 mg/dL), and two had T2D (2-h glucose level >200 mg/dL) (Supplementary Table 3). We analyzed gene expression by quantitative PCR in NGT (group 1; 2-h glucose level <120 mg/dL) compared with IGT/T2D (group 2; 2-h glucose level >140 mg/dL). In contrast to what was seen in the SAT, the expression of PNPLA3, ChREBP, SREBP1c, FASN, and ACC was significantly increased in the liver specimen of IGT/T2D subjects compared with those with NGT (Fig. 4A). The same could be observed for the two ChREBP isoforms, α and β (Fig. 4B). To further illustrate the close associations between the upregulation of lipogenesis with NAFLD/NASH, we show in Fig. 4C a representative histologic report from one subject with NGT with minimal liver fat accumulation, in contrast to two subjects who have IGT and T2D with predominant NASH (macrovesicular steatosis, hepatocyte ballooning, and signs of bridging fibrosis). Opposite to what we have seen in adipose tissue, Spearman correlation showed a significant increase in homeostasis model assessment-insulin resistance (HOMA-IR) with increasing levels of ChREBP (r = 0.786; P = 0.036), SREBP1c (r = 0.775; P = 0.041), and PNPLA3 (r = 0.821; P = 0.023) expression. In liver tissue, only expression of SREBP1c (r = 0.955; P = 0.001), but not ChREBP, showed significant correlation with 2-h glucose level. Multivariate regression analyses, adjusting for age, gender, race, and BMI, revealed SREBP1c as a stronger determinant of 2-h glucose level (r2 = 0.846; P = 0.009) and insulin sensitivity (r2 = 0.800; P = 0.016) in liver tissue, whereas ChREBP is a stronger determinant of 2-h glucose level (r2 = 0.130; P = 0.042) and insulin sensitivity (r2 = 0.243; P = 0.049) in adipose tissue.
FIG. 4.

A: Hepatic expression of ChREBP, FASN, ACC, PNPLA3, and SREBP1c, normalized to the expression of β-actin and based on the expression of a human control liver tissue (2ΔΔCt). B: Hepatic expression of both isoforms of ChREBP (α and β), normalized to the expression of β-actin and based on the expression of a human control liver tissue (2ΔΔCt). The white symbols represent group 1 with 2-h glucose levels <120 mg/dL, and the black symbols represent group 2 with 2-h glucose levels >140 mg/dL (mean ± SD, n = 8). **The independent sample t test was significant at P < 0.03 (*P < 0.07). C: Representative histological images of NAFLD in two IGT/T2D patients (right) with predominantly macrovesicular pattern lipid infiltration and some degree of hepatic ballooning (hematoxylin and eosin staining, top), with early bridging fibrosis (Klatrin staining, bottom) vs. one NGT patient (left; magnification 20×).
DISCUSSION
In the current study, we expand on our previous observation regarding the role of dysregulation of lipogenesis in the pathogenesis of insulin resistance by investigating the interactions between glucose tolerance, insulin sensitivity, and the expression of lipogenic genes in abdominal SAT and liver tissue in equally obese adolescents across the spectrum of glucose tolerance. Notably, we found that independent of overall degree of obesity, the lipogenic expression as determined by the measurement of ChREBP, SREBP1c, PNPLA3, ACC, and FASN mRNA was decreased in the SAT of IGT/T2D adolescents, in marked contrast to the increased liver expression of these genes. Importantly, the expression of ChREBP in the SAT was inversely related with 2-h glucose level and increased after conversion from IGT to NGT.
For the first time, we report a potential role of ChREBP in the development of glucose dysregulation in obese adolescents. The opposite regulation of ChREBP in the liver and adipose tissue in the current study was found to be related to both insulin resistance and the 2-h glucose levels, with ChREBPβ being the major isoform predicting insulin sensitivity (Table 2). In contrast to the SAT, in the liver we found an increased expression of lipogenic genes (ChREBP, SREBP1c, PNPLA3, FASN, ACC) in IGT/T2D adolescents. The increased expression of these lipogenic genes correlated positively with insulin resistance, which is in contrast to recently published data by Benhamed et al. (21), showing a negative correlation of ChREBP expression and HOMA-IR. Of note, our patients were in a higher range of HOMA-IR (mean HOMA-IR, 13.5) compared with Benhamed’s adult cohort with a mean HOMA-IR of 5.6. Whereas our patients were equally obese, it is known from literature that compared with lean adult subjects, obese subjects have a decreased expression of lipogenic genes in adipose tissue but increased hepatic lipogenesis (22). In adult obese subjects ChREBP expression and protein levels in the liver were higher compared with lean subjects, whereas the expression was decreased in adipose tissues (23). The increased hepatic lipogenesis is consistent with the effects of high insulin levels on liver lipogenic genes demonstrated in vitro (24–26). Moreover, the hepatic overexpression of ChREBP was seen in the context of liver steatosis as measured not only by MRI but also more specifically by liver biopsy, which revealed the presence of NASH in five out of eight patients (representative images for NGT, IGT, and T2D; Fig. 4C). The upregulation of lipogenesis in the liver and the presence of hepatic steatosis translated into a lack of insulin suppression of hepatic glucose production during the first step of the insulin clamp, indicating severe hepatic insulin resistance with increasing 2-h glucose level (group 3). Consistent with our data, downregulation of ChREBP in liver of ob/ob mice has been shown to improve hepatic steatosis as well as insulin sensitivity and glucose tolerance (27), whereas newer data from the same group show that overexpression of ChREBP in the liver of C57Bl/6J mice leads to hepatic steatosis without causing insulin resistance (21). Although some transgenic mouse studies have disassociated hepatic steatosis from hepatic insulin resistance (21,28), other studies (29–33) of rodent models of NAFLD have demonstrated that diacylglycerol activation of protein kinase C ε (PKCε) is the key trigger in the pathogenesis of NAFLD-associated hepatic insulin resistance. Moreover, recent studies strongly suggest that that hepatic DAG content in lipid droplets is the best predictor of insulin resistance in humans, supporting the hypothesis that NAFLD-associated hepatic insulin resistance is caused by an increase in hepatic DAG content, which results in activation of protein kinase C (34). Nevertheless, it is also conceivable that other factors associated with steatosis, such as inflammation, circulating adipokines, and endoplasmic reticulum stress, affect insulin sensitivity without necessarily being directly related with hepatic lipid accumulation (35).
The cause of the downregulation in ChREBP in the SAT of obese adolescents with high 2-h glucose levels is not entirely clear but might be related to the effects of alteration in GLUT4 expression, as recently shown by Herman et al. (4). Adipose tissue GLUT4 regulates the expression of ChREBP, a major determinant of adipose tissue fatty acid synthesis and systemic insulin sensitivity (4). Glucose-mediated activation of the ChREBPα isoform induces expression of the ChREBPβ isoform and therefore increases fatty acid synthesis in adipose tissue, which improves systemic insulin sensitivity (4). Multivariate regression analyses showed that ChREBPβ might be the major isoform predicting insulin sensitivity, but our results are based only on mRNA levels. It is plausible that activation of ChREBPα, for example, by posttranslational modifications, is highly important in insulin sensitivity, and this is likely to be the dominant factor that induces the expression of ChREBPβ. In our obese adolescent cohort, expression of adipose ChREBP strongly correlates with GLUT4 expression and insulin sensitivity. Consistent with adipose--GLUT4 KO mice (6), we found profound hepatic and peripheral insulin resistance with the increasing 2-h glucose levels in our obese adolescents.
Although GLUT4 also is significantly decreased in the adipose tissue of obese nondiabetic subjects (36), PNPLA3 is reduced in the adipose tissue of T2D subjects, but not in obese subjects, and increases with insulin treatment (16), suggesting that PNPLA3 dysregulation in adipose tissue may be associated with impaired insulin sensitivity and glucose intolerance in T2D subjects, but not in obese patients. In our cohort, adipose PNPLA3 expression positively correlated with insulin sensitivity (Matsuda index: r = 0.329 and P = 0.024), which is consistent with previous reports that PNPLA3 gene expression positively correlates with insulin sensitivity and negatively with fasting glucose both in obese and nonobese subjects (37). PNPLA3 gene exhibits features of lipogenic genes (38) and is regulated by SREBP1c and ChREBP (16,39,40). Glucose-dependent binding of ChREBP to a carbohydrate-response element in the PNPLA3 promotor recently has been demonstrated by chromatin immunoprecipitation, and silencing of ChREBP in human hepatocytes abolished induction of PNPLA3 mRNA by glucose (17).
Reversal of the expression in GLUT4 and ChREBP as well as in the expression of its lipogenic target genes in the adipose tissue after normalization of the glucose tolerance status in four obese subjects, with two subjects losing weight and two subjects gaining weight, supports the importance of GLUT4 and ChREBP in the regulation of this complex lipogenic machinery. Two of the subjects with conversion to NGT not only had improvement in their hyperglycemia but also had improvement in their insulin sensitivity and showed the highest increase in GLUT4 and ChREBP expression. Furthermore, we found that glucose incorporation into triglycerides in vitro in adipose tissue specimens from IGT/T2D adolescents was impaired in response to insulin stimulation (Fig. 3). Our findings are consistent with those reported for adipocytes from obese adults with T2D (41).
Although our study is mainly cross-sectional and does not prove causality, the direct correlation between adipose ChREBP expression and insulin sensitivity, as well as the indirect correlation with 2-h glucose levels, suggests that adipose ChREBP may be involved in regulating whole-body insulin action and glucose homeostasis by upregulation of adipose tissue de novo lipogenesis. The phenotype of impaired glucose tolerance and decreased adipose ChREBP expression seem to coexist with a phenotype of hepatic steatosis and increased liver ChREBP expression. Limitations of the study are attributable to the fact that we measured only expression and not protein content, which was mainly the result of limited amount of tissue obtained from these adolescents. Furthermore, we sampled only SAT and the results could be different in visceral adipose tissue, as shown for other mRNA levels (42). Because of ethical reasons, we also were not able to include a normal control group for the liver biopsies. Our longitudinal data are from a small number of adolescents; therefore, presented data for converters from IGT to NGT are very preliminary and further studies are needed in this area.
Several strengths need to be highlighted in this study, including: the detailed metabolic characterization of three obese groups of adolescents who differed in their glucose tolerance status; the use of state-of-the-art measurements of insulin sensitivity; imaging techniques for assessment of lipid content in liver and abdominal fat distribution; and measurements of the expression of genes regulating lipogenesis in SAT and liver.
In conclusion, early in the development of prediabetes/T2D in youth, ChREBPβ expression in adipose tissue predicts insulin resistance and therefore might play a role in the regulation of glucose tolerance.
Supplementary Material
ACKNOWLEDGMENTS
This study was supported by grants from the National Institutes of Health (NIH) (R01-HD40787, R01-HD28016, and K24-HD01464) to S.C. and by the Clinical and Translational Science Award Grant UL1 RR0249139 from the National Center for Research Resources (NCRR), a component of the NIH, and R01-EB006494 (Bioimage Suite), and by Distinguished Clinical Scientist Awards from the American Diabetes Association, DK-49230 (S.C.) and DK-085638 (G.I.S.), the Diabetes and Endocrinology Research Center Grant P30 DK045735, and the European Society for Paediatric Endocrinology Long-Term Research Fellowship (to C.G.). S.W.C. was supported by the Intramural Research Program of the NIH, National Institute of Diabetes and Digestive and Kidney Diseases. This publication was and its contents are solely the responsibility of the authors and do not necessarily represent the official view of NCRR or NIH.
No potential conflicts of interest relevant to this article were reported.
R.K. and S.C. wrote the manuscript. R.K. performed the statistical analyses. S.C. initiated the concept of the study and designed it together with R.K., S.W.C., and G.I.S. D.N. was the surgeon for the biopsies. A.L. performed the statistical analyses for the Affymetrix genechip data. C.G. and E.D. performed the hyperinsulinemic-euglycemic clamps. M.S. and B.P. were responsible for recruiting the subjects and performing the MRI analysis. All authors contributed to the interpretation of the data. S.C. is the guarantor of this work and, as such, had full access to all of the data in the study and takes responsibility for the integrity of the data and the accuracy of the data analysis.
Parts of this study were presented in poster form at the 72nd Scientific Sessions of the American Diabetes Association, Philadelphia, Pennsylvania, 8–12 June 2012, and at the annual meeting of the European Society for Paediatric Endocrinology, Leipzig, Germany, 20–23 September 2012.
The authors thank all the volunteers and Karen Allen, Yale Center for Clinical Investigation, Yale University, New Haven, Connecticut, for her skillful help in the study.
Footnotes
This article contains Supplementary Data online at http://diabetes.diabetesjournals.org/lookup/suppl/doi:10.2337/db12-0889/-/DC1.
REFERENCES
- 1.Danforth E., Jr Failure of adipocyte differentiation causes type II diabetes mellitus? Nat Genet 2000;26:13. [DOI] [PubMed] [Google Scholar]
- 2.Shulman GI. Cellular mechanisms of insulin resistance. J Clin Invest 2000;106:171–176 [DOI] [PMC free article] [PubMed] [Google Scholar]
- 3.Kursawe R, Eszlinger M, Narayan D, et al. Cellularity and adipogenic profile of the abdominal subcutaneous adipose tissue from obese adolescents: association with insulin resistance and hepatic steatosis. Diabetes 2010;59:2288–2296 [DOI] [PMC free article] [PubMed] [Google Scholar]
- 4.Herman MA, Peroni OD, Villoria J, et al. A novel ChREBP isoform in adipose tissue regulates systemic glucose metabolism. Nature 2012;484:333–338 [DOI] [PMC free article] [PubMed] [Google Scholar]
- 5.Schenk S, Saberi M, Olefsky JM. Insulin sensitivity: modulation by nutrients and inflammation. J Clin Invest 2008;118:2992–3002 [DOI] [PMC free article] [PubMed] [Google Scholar]
- 6.Abel ED, Peroni O, Kim JK, et al. Adipose-selective targeting of the GLUT4 gene impairs insulin action in muscle and liver. Nature 2001;409:729–733 [DOI] [PubMed] [Google Scholar]
- 7.Shepherd PR, Kahn BB. Glucose transporters and insulin action—implications for insulin resistance and diabetes mellitus. N Engl J Med 1999;341:248–257 [DOI] [PubMed] [Google Scholar]
- 8.Garvey WT, Maianu L, Huecksteadt TP, Birnbaum MJ, Molina JM, Ciaraldi TP. Pretranslational suppression of a glucose transporter protein causes insulin resistance in adipocytes from patients with non-insulin-dependent diabetes mellitus and obesity. J Clin Invest 1991;87:1072–1081 [DOI] [PMC free article] [PubMed] [Google Scholar]
- 9.Cali’ AM, Bonadonna RC, Trombetta M, Weiss R, Caprio S. Metabolic abnormalities underlying the different prediabetic phenotypes in obese adolescents. J Clin Endocrinol Metab 2008;93:1767–1773 [DOI] [PMC free article] [PubMed] [Google Scholar]
- 10.Matsuda M, DeFronzo RA. Insulin sensitivity indices obtained from oral glucose tolerance testing: comparison with the euglycemic insulin clamp. Diabetes Care 1999;22:1462–1470 [DOI] [PubMed] [Google Scholar]
- 11.Weiss R, Dufour S, Taksali SE, et al. Prediabetes in obese youth: a syndrome of impaired glucose tolerance, severe insulin resistance, and altered myocellular and abdominal fat partitioning. Lancet 2003;362:951–957 [DOI] [PMC free article] [PubMed] [Google Scholar]
- 12.Burgert TS, Taksali SE, Dziura J, et al. Alanine aminotransferase levels and fatty liver in childhood obesity: associations with insulin resistance, adiponectin, and visceral fat. J Clin Endocrinol Metab 2006;91:4287–4294 [DOI] [PubMed] [Google Scholar]
- 13.Cali AM, De Oliveira AM, Kim H, et al. Glucose dysregulation and hepatic steatosis in obese adolescents: is there a link? Hepatology 2009;49:1896–1903 [DOI] [PMC free article] [PubMed] [Google Scholar]
- 14.Kim H, Taksali SE, Dufour S, et al. Comparative MR study of hepatic fat quantification using single-voxel proton spectroscopy, two-point dixon and three-point IDEAL. Magn Reson Med 2008;59:521–527 [DOI] [PMC free article] [PubMed] [Google Scholar]
- 15.Pacifico L, Celestre M, Anania C, Paolantonio P, Chiesa C, Laghi A. MRI and ultrasound for hepatic fat quantification:relationships to clinical and metabolic characteristics of pediatric nonalcoholic fatty liver disease. Acta Paediatr 2007;96:542–547 [DOI] [PubMed] [Google Scholar]
- 16.Moldes M, Beauregard G, Faraj M, et al. Adiponutrin gene is regulated by insulin and glucose in human adipose tissue. Eur J Endocrinol 2006;155:461–468 [DOI] [PubMed] [Google Scholar]
- 17.Perttilä J, Huaman-Samanez C, Caron S, et al. PNPLA3 is regulated by glucose in human hepatocytes, and its I148M mutant slows down triglyceride hydrolysis. Am J Physiol Endocrinol Metab 2012;302:E1063–E1069 [DOI] [PubMed] [Google Scholar]
- 18.Towle HC. Glucose as a regulator of eukaryotic gene transcription. Trends Endocrinol Metab 2005;16:489–494 [DOI] [PubMed] [Google Scholar]
- 19.Minn AH, Hafele C, Shalev A. Thioredoxin-interacting protein is stimulated by glucose through a carbohydrate response element and induces beta-cell apoptosis. Endocrinology 2005;146:2397–2405 [DOI] [PubMed] [Google Scholar]
- 20.Pashkov V, Huang J, Parameswara VK, et al. Regulator of G protein signaling (RGS16) inhibits hepatic fatty acid oxidation in a carbohydrate response element-binding protein (ChREBP)-dependent manner. J Biol Chem 2011;286:15116–15125 [DOI] [PMC free article] [PubMed] [Google Scholar]
- 21.Benhamed F, Denechaud PD, Lemoine M, et al. The lipogenic transcription factor ChREBP dissociates hepatic steatosis from insulin resistance in mice and humans. J Clin Invest 2012;122:2176–2194 [DOI] [PMC free article] [PubMed] [Google Scholar]
- 22.Diraison F, Dusserre E, Vidal H, Sothier M, Beylot M. Increased hepatic lipogenesis but decreased expression of lipogenic gene in adipose tissue in human obesity. Am J Physiol Endocrinol Metab 2002;282:E46–E51 [DOI] [PubMed] [Google Scholar]
- 23.Hurtado del Pozo C, Vesperinas-García G, Rubio MA, et al. ChREBP expression in the liver, adipose tissue and differentiated preadipocytes in human obesity. Biochim Biophys Acta 2011;1811:1194–1200 [DOI] [PubMed] [Google Scholar]
- 24.Girard J, Perdereau D, Foufelle F, Prip-Buus C, Ferré P. Regulation of lipogenic enzyme gene expression by nutrients and hormones. FASEB J 1994;8:36–42 [DOI] [PubMed] [Google Scholar]
- 25.Foufelle F, Gouhot B, Pégorier JP, Perdereau D, Girard J, Ferré P. Glucose stimulation of lipogenic enzyme gene expression in cultured white adipose tissue. A role for glucose 6-phosphate. J Biol Chem 1992;267:20543–20546 [PubMed] [Google Scholar]
- 26.Ferré P. Regulation of gene expression by glucose. Proc Nutr Soc 1999;58:621–623 [DOI] [PubMed] [Google Scholar]
- 27.Dentin R, Benhamed F, Hainault I, et al. Liver-specific inhibition of ChREBP improves hepatic steatosis and insulin resistance in ob/ob mice. Diabetes 2006;55:2159–2170 [DOI] [PubMed] [Google Scholar]
- 28.Monetti M, Levin MC, Watt MJ, et al. Dissociation of hepatic steatosis and insulin resistance in mice overexpressing DGAT in the liver. Cell Metab 2007;6:69–78 [DOI] [PubMed] [Google Scholar]
- 29.Zhang D, Liu ZX, Choi CS, et al. Mitochondrial dysfunction due to long-chain Acyl-CoA dehydrogenase deficiency causes hepatic steatosis and hepatic insulin resistance. Proc Natl Acad Sci USA 2007;104:17075–17080 [DOI] [PMC free article] [PubMed] [Google Scholar]
- 30.Neschen S, Morino K, Hammond LE, et al. Prevention of hepatic steatosis and hepatic insulin resistance in mitochondrial acyl-CoA:glycerol-sn-3-phosphate acyltransferase 1 knockout mice. Cell Metab 2005;2:55–65 [DOI] [PubMed] [Google Scholar]
- 31.Savage DB, Choi CS, Samuel VT, et al. Reversal of diet-induced hepatic steatosis and hepatic insulin resistance by antisense oligonucleotide inhibitors of acetyl-CoA carboxylases 1 and 2. J Clin Invest 2006;116:817–824 [DOI] [PMC free article] [PubMed] [Google Scholar]
- 32.Samuel VT, Liu ZX, Wang A, et al. Inhibition of protein kinase Cepsilon prevents hepatic insulin resistance in nonalcoholic fatty liver disease. J Clin Invest 2007;117:739–745 [DOI] [PMC free article] [PubMed] [Google Scholar]
- 33.Samuel VT, Liu ZX, Qu X, et al. Mechanism of hepatic insulin resistance in non-alcoholic fatty liver disease. J Biol Chem 2004;279:32345–32353 [DOI] [PubMed] [Google Scholar]
- 34.Kumashiro N, Erion DM, Zhang D, et al. Cellular mechanism of insulin resistance in nonalcoholic fatty liver disease. Proc Natl Acad Sci USA 2011;108:16381–16385 [DOI] [PMC free article] [PubMed] [Google Scholar]
- 35.Fabbrini E, Sullivan S, Klein S. Obesity and nonalcoholic fatty liver disease: biochemical, metabolic, and clinical implications. Hepatology 2010;51:679–689 [DOI] [PMC free article] [PubMed] [Google Scholar]
- 36.Ducluzeau PH, Perretti N, Laville M, et al. Regulation by insulin of gene expression in human skeletal muscle and adipose tissue. Evidence for specific defects in type 2 diabetes. Diabetes 2001;50:1134–1142 [DOI] [PubMed] [Google Scholar]
- 37.Liu YM, Moldes M, Bastard JP, et al. Adiponutrin: A new gene regulated by energy balance in human adipose tissue. J Clin Endocrinol Metab 2004;89:2684–2689 [DOI] [PubMed] [Google Scholar]
- 38.Baulande S, Lasnier F, Lucas M, Pairault J. Adiponutrin, a transmembrane protein corresponding to a novel dietary- and obesity-linked mRNA specifically expressed in the adipose lineage. J Biol Chem 2001;276:33336–33344 [DOI] [PubMed] [Google Scholar]
- 39.Kim JB, Spiegelman BM. ADD1/SREBP1 promotes adipocyte differentiation and gene expression linked to fatty acid metabolism. Genes Dev 1996;10:1096–1107 [DOI] [PubMed] [Google Scholar]
- 40.Tontonoz P, Kim JB, Graves RA, Spiegelman BM. ADD1: a novel helix-loop-helix transcription factor associated with adipocyte determination and differentiation. Mol Cell Biol 1993;13:4753–4759 [DOI] [PMC free article] [PubMed] [Google Scholar]
- 41.Yu ZW, Jansson PA, Posner BI, Smith U, Eriksson JW. Peroxovanadate and insulin action in adipocytes from NIDDM patients. Evidence against a primary defect in tyrosine phosphorylation. Diabetologia 1997;40:1197–1203 [DOI] [PubMed] [Google Scholar]
- 42.Samaras K, Botelho NK, Chisholm DJ, Lord RV. Subcutaneous and visceral adipose tissue gene expression of serum adipokines that predict type 2 diabetes. Obesity (Silver Spring) 2010;18:884–889 [DOI] [PubMed] [Google Scholar]
Associated Data
This section collects any data citations, data availability statements, or supplementary materials included in this article.