

Abstract
Functional neuroimaging commands a dominant role in current neuroscience research. However its use in bedside clinical and certain neuro-scientific studies has been limited because the current tools lack the combination of being non-invasive, non-ionizing and portable while maintaining moderate resolution and localization accuracy. Optical neuroimaging satisfies many of these requirements, but, until recent advances in high-density diffuse optical tomography (HD-DOT), has been hampered by limited resolution. While early results of HD-DOT have been promising, a quantitative voxel-wise comparison and validation of HD-DOT against the gold standard of functional magnetic resonance imaging (fMRI) has been lacking. Herein, we provide such an analysis within the visual cortex using matched visual stimulation protocols in a single group of subjects (n=5) during separate HD-DOT and fMRI scanning sessions. To attain the needed voxel-to-voxel co-registration between HD-DOT and fMRI image spaces, we implemented subject-specific head modeling that incorporated MRI anatomy, detailed segmentation, and alignment of source and detector positions. Comparisons of the visual responses found an average localization error between HD-DOT and fMRI of 4.4 +/− 1 mm, significantly less than the average distance between cortical gyri. This specificity demonstrates that HD-DOT has sufficient image quality to be useful as a surrogate for fMRI.
Keywords: optical tomography, functional neuroimaging, cortex, mapping, human
1. Introduction
Functional brain mapping has revolutionized neuroscience research, by providing noninvasive investigations into human brain activity. However, functional imaging of the brain has, so far, found only limited clinical application with early uses in pre-operative planning (Nelles et al., 2009; Shimony et al., 2009; Wengenroth et al., 2011; Zhang et al., 2009). Functional imaging has the potential to play a larger clinical role in diagnosis, prognosis and monitoring due to its ability to find subtle changes in function before disease progresses to large-scale structural change. However, traditional functional brain mapping methods, including functional MRI (fMRI) and positron emission tomography (PET) are limited in many settings by immobility, expense, and constraints on subjects. Additionally, they have contraindications for metallic implants (fMRI) or use ionizing radiation (PET), limiting the number of repeated studies. In contrast, optical methods provide non-ionizing functional neuroimaging with potentially portable and wearable technology that is well-suited for many of the subjects inaccessible by fMRI or PET. Early diffuse optical imaging (DOI) methods used sparse sets of source-detector pairs to generate two-dimensional, low-resolution images of cerebral hemodynamics (Maki et al., 1995; Obrig and Villringer, 2003; Villringer et al., 1993). A more advanced method, diffuse optical tomography (DOT), relies on a variety of measurement strategies to improve lateral and depth resolution. Time-resolved (TR) measurements use time-gating (Benaron et al., 2000; Gibson et al., 2006; Hebden et al., 2002; Kohl-Bareis et al., 2002; Selb et al., 2005; Steinbrink et al., 2001) or frequency-domain phase data (Kohl-Bareis et al., 2002) to profile different tissue depths. However, the complexity and cost of TR systems impose practical limits and require tradeoffs between channel count, source and detector density, coverage (field-of-view), and frame rate. Another strategy uses high-density DOT grids with overlapping continuous wave measurements at multiple SD-pair separations (Bluestone et al., 2001; Boas et al., 2004a; Joseph et al., 2006; Zeff et al., 2007). Relative to DOI, the newer HD-DOT methods achieve higher resolution and improved localization accuracy (Gibson and Dehghani, 2009; Gibson et al., 2005; Habermehl et al., 2011; Koch et al., 2010; White and Culver, 2010b; Zeff et al., 2007). While HD-DOT’s ability to decipher detail has been established in studies of retinotopy in visual cortex (White and Culver, 2010a; Zeff et al., 2007) and finger-topy in the motor cortex (Custo et al., 2009; Koch et al., 2010; White et al., 2009), the image quality of HD-DOT at the voxel level has not been compared directly to fMRI, the current gold standard in hemodynamic-based functional neuroimaging. Establishing the relationship between HD-DOT and fMRI functional maps could significantly strengthen the impact that HD-DOT might have when used as a surrogate for fMRI. The purpose of this study is to validate HD-DOT functional mapping accuracy through a quantitative voxel-wise comparison to fMRI in subject-matched datasets of visual cortex activity.
Previous comparative studies of diffuse optical and fMRI signals have used either non-imaging systems or sparse measurement datasets and performed comparisons unrelated to image quality. For example, thorough comparisons have been made in the measurement space of the DOI instrument (Cui et al., 2011; Huppert et al., 2006a; Huppert et al., 2006b; Sassaroli et al., 2006; Strangman et al., 2002; Toronov et al., 2001). Additionally, there have been detailed temporal evaluations (e.g., comparing the time course of the DOI response within a similar volume as that displaying an MRI response (Okamoto et al., 2004; Sakatani et al., 2007)). Throughout these studies, correlations were found between the time courses of BOLD and optical data. These findings along with parallel studies in rodent models (Bouchard et al., 2009; Culver et al., 2003; Custo et al., 2009; Devor et al., 2003; Dunn et al., 2005; Siegel et al., 2003) and human neonates (Villringer and Chance, 1997) lay the foundation for optical measurements to be used in calculations of metabolic markers such as CMRO2 at the bedside. Additionally, image- and time-domain comparisons have been made with simultaneously acquired MRI and NIRS (Toronov et al., 2007; Zhang et al., 2005). However, these studies used point-like activations and have not investigated image quality throughout an extended cortical region.
In this study we perform spatial voxel-wise comparisons between HD-DOT and fMRI data sets for cortical responses to visual stimulations throughout the visual field of view. The HD-DOT and fMRI datasets were co-registered on a subject specific basis by segmenting anatomical MRIs for each subject, locating and co-registering the HD-DOT cap placement on each subject’s head, and solving the forward light model within the subject-specific space. Visual activations were used because they have served extensively as a substrate for validation by other neuroimaging methodologies (Belliveau et al., 1991; Engel et al., 1997; Fox et al., 1986; Fox et al., 1985) and because the structure and function of the visual cortex has been comprehensively mapped via invasive anatomical and electrical studies in mammals (Felleman and Van Essen, 1991; Gilbert and Wiesel, 1979; Rosa et al., 1993) and humans (Harding et al., 1991; Spalding, 1952). The comparison between HD-DOT and fMRI was quantified by calculating the center-of-mass of the imaged hemodynamic response to matched visual activations, and by a complete phase analysis of the responses to stimulations throughout the full visual field. The resulting HD-DOT image quality evaluation serves as a strong foundation and validation enabling further adoption of HD-DOT by both neuroscientists and clinicians.
2. Methods
2.1. Subjects and Stimulus Protocol
Five healthy adult right-handed subjects (aged 21–30) were recruited for this study. All subjects passed MR screening to ensure their safe participation. Informed consent was obtained for all subjects. The research was approved by the Human Research Protection Office at Washington University School of Medicine. All stimuli are angularly sweeping reversing black-and-white logarithmic checkerboard wedges (10 Hz reversal) on a 50% gray background (Engel et al., 1994; Warnking et al., 2002). The grids rotate around a white cross located at the center of the visual field, step 10° each second, and complete a full sweep every 36 seconds. For the HD-DOT stimuli, subjects are seated in an adjustable chair facing a 19″ LCD display at a 90 cm viewing distance. For the fMRI stimuli, the stimulus is presented via a projector onto a screen that the subject could visualize from their position within the MR tube with a mirror attached to the head coil. The stimulus size is calibrated to be the same size on the retina as when presented in the HD-DOT setting: each wedge subtends a radial angle of 2.5°–10.5° and a polar angle of 60°. A set of stimuli consists of 10 repetitions of either clockwise- or counter-clockwise-rotating flickering wedges. Subjects are instructed to fixate on the central crosshair. Gray screens are presented for 30 seconds before and after each stimuli set.
2.2. HD-DOT Imaging system and Acquisition
The high-density imaging system has been described previously (Zeff et al., 2007). Briefly, our high-density DOT instrument uses light-emitting diode (LED) sources at 750 nm and 850 nm (750-03AU and OPE5T85, Roithner Lasertechnik) and avalanche photo diode (APD, Hamamatsu C5460-01) detectors (Zeff et al., 2007). Each detector has a dedicated 24-bit analog-to-digital converter (MOTU HD-192). Sources and detectors are coupled with fiber optic bundles to a flexible imaging cap held on to the back of the head with hook-and-loop strapping. After digitization, the APD measurements are written directly to hard-disk at 96 kHz. With temporal, frequency, and spatial encoding, the system works with a frame rate of 11 Hz in continuous wave mode (the time and frequency encoding is at ~10 kHz, much slower than the >10 MHz needed for measuring the time of flight for light propagation through tissue). The array has 24 source and 28 detector positions placed in two interlaced rectangular arrays with first- through fourth- nearest neighbor separations as follows: 1.3, 3.0, 3.9, and 4.7 cm. In order to ensure consistent pad placement between sessions, measurements of the distance between the optode array and the nasion and eyes are taken and recorded. Once the cap is placed comfortably with good signal-to-noise, the exact placement of the pad is found by measuring the locations of the outer four corner positions of the optode array using a commercially available 3D digitizer (Fastrak, Polhemus). Concurrently, we also measure the locations of anatomical landmarks on the head and face of the subject (e.g., the nasion) (Klem et al., 1999) to locate the pad relative to the subject’s head.
2.3. fMRI Acquisition
MRI scans are collected on a Siemens Trio (Erlagen, Germany) 3T scanner. Anatomical T1-weighted MPRAGE (echo time (TE) = 3.13 ms, repetition time (TR) = 2400 ms, flip angle = 8°, 1 × 1 × 1 mm isotropic voxels) and T2-weighted (TE = 84 ms, flip angle = 120°, 1 × 1 × 4 mm voxels) scans are taken at each session (for simplicity, we will subsequently refer to these scans as T1 and T2). Functional images are collected using a series of asymmetric gradient spin-echo echo-planar (EPI) sequences (each brain volume had a TE = 27 ms, TR = 2000 ms, flip angle = 90°, 4 × 4 × 4 mm voxels) to measure the blood-oxygenation-level-dependent (BOLD) contrast. In keeping with standard methods for performing BOLD analysis, we transform the BOLD data to a 3 mm isotropic voxelated space.
2.4. Head Modeling
To place the HD-DOT image space into the correct subject specific anatomic location, a full head model must be constructed. The head model incorporates the surface head shape, assumed optical properties of each voxel, and locations of the sources and detectors of the HD-DOT system. The basis for the head model is the subject-specific anatomical T1 (Fig. 1a) and T2. These volumes contribute complementary information that provides characteristic information for each tissue type. An iterative series of thresholding, region growing, and masking techniques are used to segment the head tissue into scalp, skull, cerebral spinal fluid (CSF), gray matter, and white matter regions (Fig. 1b).
Figure 1.
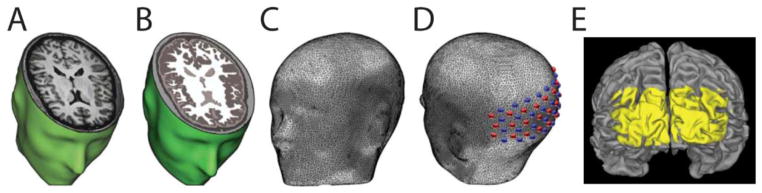
Subject-specific head modeling. (A) T1-weighted MRI volume. (B) Segmented head volume displaying scalp, skull, CSF, gray matter and white matter. (C) High-density tetrahedral mesh for finite element forward light model. (D) Optode positions localized on mesh. The high-density optode grid is composed of 24 sources (red) and 28 detectors (blue). (E) Surface rendering of cortex. Yellow coloring denotes FOV of HD-DOT imaging pad derived from top 50% of the summed sensitivity matrix (see Methods) on the cortical ribbon of Subject 2.
To generate a space for the numerical light modeling, a high-density volumetric tetrahedral head mesh (Fig. 1c) is created from the segmented head using the Mimics software package (Materialize, Belgium). Each subject’s head mesh has approximately 5 × 10⁵ nodes and 3 × 10⁶ tetrahedral volume elements. To ensure proper resolution, the maximum inter-node distance both on the surface and within the mesh volume is set to 3 mm. Tissue-type-specific labeling of optical properties generates a more accurate light model than assuming homogeneous optical properties (Custo et al., 2006; Dehaes et al., 2011; Dehghani et al., 2000; Heiskala et al., 2009; Ripoll et al., 2000). Thus, each node is labeled by tissue type and assigned optical properties from the literature as summarized in Table 1 (Bevilacqua et al., 1999; Custo et al., 2006; Strangman et al., 2003). While errors in the assumed baseline optical properties will propagate through to the magnitude of the differential concentration changes (Strangman et al., 2003), this treatment of baseline optical properties is consistent with standard DOT processing (Blasi et al., 2007; Bluestone et al., 2001; Boas et al., 2001; Custo et al., 2009; Dehghani et al., 2009). Interpretation of concentration magnitudes should account for these model assumptions. The image quality assessments at the focus of this paper use normalized differential magnitudes.
Table 1.
Optical properties of segmented head tissue for forward light model.
To place the optode locations on the head model, the anatomical landmarks on the subject’s head (measured during data collection) are then identified on the subject specific mesh generated from the anatomical MRIs. An affine transform aligns the coordinate space from the 3D digitizer in real space to the coordinate space in the MRI space (Benaron et al., 2000; Custo et al., 2009; Gibson et al., 2003). This is necessary because the MRI volume has small inherent artifacts and distortions relative to real space. Thus, the digitizer points are translated, rotated, and skewed to match the MRI space. Using this same transform, the four measured points on the optode cap are transformed to their locations on the head mesh. These four optode locations are then used as anchors to fit the entire cap onto the head mesh using a spring-relaxation energy-minimization algorithm (Joseph et al., 2006). Source and detector locations on the head obtained during the HD-DOT session are thus placed at the relevant loci on the mesh (Fig. 1d). Similar methods of optode placement have been described previously (Custo et al., 2009; Fuchs et al., 2002).
A sensitivity matrix for the subject-specific head model is calculated using a finite-element forward light model based on the diffusion approximation to the radiative transport equation using the NIRFAST software package (Dehghani et al., 2003). The sensitivity matrix provides a mapping function that transforms the measured HD-DOT data to optical parameter changes within the model. The original tetrahedral finite-element based sensitivity function is then transformed into the 3 mm isotropic voxel space (standard in current BOLD processing practices) through a weighted spatial average to create the sensitivity matrix for the subject-specific space. As a result of these procedures the image spaces for the two modalities are co-aligned.
2.5. Functional Data Analysis
HD-DOT light measurement data were converted to log-ratio and high-pass filtered (0.02 Hz cutoff) to remove long term drift. An average of all 1st-nearest-neighbor measurements (sampling predominantly scalp and skull) was constructed as an estimate of systemic signals (Obrig and Villringer, 2003; White et al., 2009; Zeff et al., 2007). This signal was then regressed from all measurements. After a low-pass filter (0.5 Hz cutoff) removed residual pulse signals, the time traces were used for image reconstruction. Note that while a time trace of the average across channels of all 1st nearest- neighbor pairs was removed during the global signal regression, the individual 1st-nearest-neighbor channels retain variance after this regression and are used during the reconstruction. To manage system noise during cap fit, real-time data displays are used to adjust the cap (at the individual optode level if needed) to optimize the highest possible light level and lowest possible noise level. Further, the data is de-noised by removing noisy source-detector pair measurement channels that have signal standard deviations (across time) greater than 7.5% of their mean signal magnitude. Using this threshold, the following percentages of nearest neighbor (nn) measurements are typically retained: 100% 1st nn, 95% 2nd nn, 65% 3rd nn, and 19% 4th nn. The numerous overlapping measurements provided by the HD-DOT arrays minimize the effect of a single noisy channel on a particular tissue voxel. Thus the reconstruction of data sampling brain tissue is driven by the 1st and 2nd nearest- neighbor pairs with some additional depth information provided by 3rd nearest- neighbor and 4th nearest- neighbor pairs where possible. An average total of 257 independent measurements were used in each reconstruction.
The sensitivity matrix is inverted as described previously (Dehghani et al., 2009; Zeff et al., 2007). Following the notation of Dehghani et al. 2009, we set the Tikhonov regularization constant λ=0.01, and the spatially variant regularization parameter β=0.01. Our reconstruction utilizes a spatial constraint to aid in separating out superficial surface noise from deeper measurements. While previous studies have constrained their reconstructions to the cortical ribbon (Boas and Dale, 2005), we used a less restrictive spatial prior. The reconstructions were constrained to all voxels in either scalp or brain tissue. The scalp voxels capture potential optode coupling noise, as well as potential superficial scalp signals. The brain tissue voxels allow brain activations to reconstruct freely within any brain tissue (gray or white matter). The volumetric constraint is applied prior to inversion and is enabled by the use of an anatomical head model. The reconstructed hemodynamic responses still reside within a three-dimensional voxelated space, but the constraint excludes them from the skull and CSF which is a reasonable assumption for images of neural activity. The voxelated hemodynamic response within the brain tissue volume is used for the entire comparative DOT - fMRI quantitative analysis. In keeping with standard methods for performing BOLD analysis, we use a 3 mm isotropic voxelated space.
Relative changes in oxygenated (HbO2), deoxygenated (HbR), and total hemoglobin (HbT) concentrations are obtained from the absorption coefficients by spectral decomposition of the extinction coefficients of HbO2 and HbR at the two wavelengths (Bluestone et al., 2001). Additionally, HD-DOT data is down-sampled to 1 Hz.
MRI data analysis was performed using standard pre-processing of anatomical and functional images as described previously (Shulman et al., 2010), except that while the MRIs are rotated and translated to a standard imaging coordinate system, they are not transformed (stretched) into an atlas space. Each subject’s fMRI data are aligned to their own subject-specific MRPAGE (T1) volume and functional data is re-sampled to a 3 × 3 × 3 mm voxelated space, standard for BOLD analysis. Additionally, the fMRI data is spatially smoothed to match the point-spread function of the HD-DOT system, 1.3 cm (White and Culver, 2010b), and interpolated to 1 Hz, to match data rates for subsequent comparison.
For visualization of the data only, the data is mapped onto the mesh that represents the complex two-dimensional cortical mid-thickness sheet. Each subject’s cortical pial surface and white matter outer surface were extracted using FreeSurfer (Dale et al., 1999; Fischl et al., 2001; Segonne et al., 2004) (http://surfer.nmr.mgh.harvard.edu). These surfaces were converted to a cortical mid-thickness using the Caret 5.62 software package (Van Essen et al., 2001) (http://brainmap.wustl.edu/caret/). For visualization only, all volumetric activation data is then mapped onto the cortical surface in Caret.
2.6. Comparison Analysis
All subsequent processing was performed within the field of view (FOV) of the HD-DOT system, as defined by the region of the imaging domain with high sensitivity (>50% of max sensitivity) determined through the forward light model (Fig. 1e). Sensitivity within a voxel is given by the sum over all measurements within the sensitivity matrix. To compare the image-volumes produced by the two modalities, we utilized two metrics. First, we quantified the localization error within four visual quadrants, areas within the FOV of the HD-DOT system that have high SNR. The center-of-mass (CofM) of an activation within a quadrant is calculated for each of the hemoglobin species concentrations as well as the BOLD data. The CofM error in location of an activation was computed as the Euclidian distance from the center-of-mass of the fMRI response to the center-of-mass of the HD-DOT response separately for each frame.
To quantify the localization error at every voxel within the FOV, we used phase analysis. Rather than using data from a small subset of the FOV as in the center-of-mass analysis, phase maps provide access to an error metric for every voxel within the FOV. We first define a physiologically-based constraint to the FOV for the phase analysis by calculating the spatially variant signal to noise ratio in the response defined as the ratio of the power of the Fourier transform at the stimulus frequency to the power at all other frequencies (excluding very low frequencies and harmonics of the stimulus frequency) (Saygin and Sereno, 2008; Sereno et al., 1995). In effect, this models the signal to noise as a ratio of two χ2 statistics, each with degrees of freedom equal to the number of time points. This ratio has an F-distribution from which we obtained p-values. Voxels with a p-value less than 0.001 were included in the analysis. Note that because the noise is not evenly distributed across frequencies, this is a conservative threshold estimate. The phase of the response at each voxel is calculated using methods described previously (White and Culver, 2010a). The hemodynamic delay is removed from the analysis by taking the vector average of the phase of the response to the counter-clockwise-moving stimuli with the response to the clockwise-moving stimuli after reflecting the imaginary part of the response to the clockwise stimuli about zero (Sereno et al., 1995). This way the stimulus phase is directly related to the response phase at each time point in the data. Each voxel’s phase error ΔθfMRI-Hd-DOT = θfMRI − θHd-DOT is calculated as the difference between the phase measured with HD-DOT to that measured via fMRI. The norm of the gradient of the phase map ||∇θ|| at a given voxel is the magnitude of the change in retinal polar phase angle given a unit change in distance in the imaged volume. Therefore, dividing an error in phase ΔθfMRI-Hd-DOT by this norm provides us with an estimate of the distance error for each voxel (Δle=ΔθfMRI-Hd-DOT / ||∇θ||). All analyses for each subject are carried out within the subject-specific space as defined by the T1-weighted MRI.
3. Results
In response to flickering checkerboard wedges (Fig. 2) the location and spatial extent of the HD-DOT and fMRI activations within an individual subject are qualitatively similar (Fig. 3). All activations displayed are block averaged from a set of ten repetitions. For visual comparison, both the voxel and cortical surface representations where cropped to a threshold of 50% maximum response. In the parasagittal slice view of Figure 3a, it can be seen that the responses in the right cortex to a stimulation in the left visual field are detected in qualitatively similar locations. The activations lie within the opposite quadrant as the visual stimulus. While the HD-DOT signals lie on the same gyri as the fMRI signals, it is apparent that the activation is reconstructed towards the surface. Responses to the ventral stimuli are displayed in a dorsally located axial slice in Fig. 3b (Neurological orientation of the figures: subject left is figure left). Again, there is strong agreement between the fMRI BOLD signal and HD-DOT reconstructed hemoglobin concentrations. In the volumetric slice view, it can be challenging to visualize the full three-dimensional nature of the activation, especially the intersection with the convoluted cortical surface. Thus, Fig. 3c displays the response to stimulation within each of the four quadrants overlaid on the cortical surface as seen from behind the head. It is apparent that the spatial extents of the HD-DOT and fMRI activations are also qualitatively similar on the cortical surface. The spatial correspondence of HD-DOT with fMRI is more fully demonstrated in a movie of all the phase positions of the block-averaged periodic stimuli (Supplemental Movie 1). Qualitatively, the topography of the responses along the cortical anatomy agree strongly throughout the entirety of the stimulus presentation; both modalities continually exhibit a response in the opposite quadrant of the visual cortex from the quadrant of the visual field.
Figure 2.

Experimental design. Subject head model fixating on a stimulus screen placed 90 cm away. The visual stimulus is an angularly sweeping black and white reversing radial grid (10 Hz reversal) on a 50% gray background. The wedge extends over a polar angle of 60° and a radial angle of 2.5° – 10.5° and was rotated in steps of 10° each second.
Figure 3.
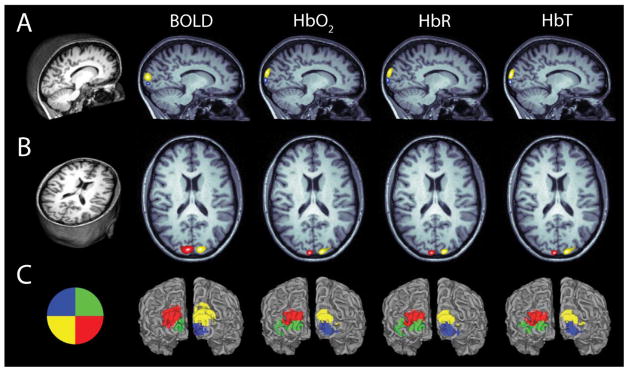
Quadrant activations of BOLD and each hemoglobin concentration species. (A) Parasagittal slice through the T1-weighted MRI of Subject 1. Activations are shown in response to a wedge within the opposite visual quadrant (see visual stimulus key in (C)). Activations for each contrast are thresholded at 50% maximum for that specific activation. (B) Axial slice with activations. Slices are shown in Neurological space (left is left). (C) Visual stimulus key and surface rendering of cortex with activations overlaid for each quadrant. Note there is qualitative agreement between the measured BOLD activation and each of the HD-DOT reconstructed hemoglobin concentrations both in activation location and spatial extent. All activations are the block-averaged responses (10 repetitions) from Subject 1.
With the HD-DOT and fMRI data sets co-registered we can examine the temporal hemodynamics within a single voxel of visual cortex. Both modalities present signals with a strong periodicity and high contrast to noise ratio (CNR) (Fig. 4a; red: oxygenated hemoglobin (ΔHbO2), blue: deoxygenated hemoglobin (ΔHbR), and green: total hemoglobin (ΔHbT), black: fMRI-BOLD). The high contrast to noise ratio is also evident in the Fourier transform of hemodynamic time course with a strong peak at the stimulation frequency, a smaller peak at the first harmonic and lower relative power at other frequencies (Fig. 4b). Even though the HD-DOT and fMRI recordings are taken during different sessions, the responses within the same single voxel for each modality, are highly correlated (Fig. 2b).
Figure 4.

Time course of activations in a single voxel in Subject 1. (A) Time trace of hemoglobin concentrations (measured with HD-DOT) in response to eight repetitions of the wedge stimulus. (ΔHbO2, red; ΔHbR, blue; ΔHbT, green). The time trace of BOLD signal is shown in black. (B) Fourier transforms of the time traces in (A). Note the strong peak at the rotation frequency of the stimulus wedge, with little background noise in the signal.
Similar spatial results were observed for all subjects recorded (Fig. 5, for clarity, only the HbR reconstructed response is shown for HD-DOT). For a comparison of image quality on every subject for each HD-DOT contrast, see Supplemental Fig. 1. In Subject 5, the lower quadrants are nearly missing in the HD-DOT image. This is due to low SNR on the ventral part of the pad for that subject. In general, dorsally located activations for HD-DOT had better contrast-to-noise and better agreement with the BOLD response than ventral activations
Figure 5.
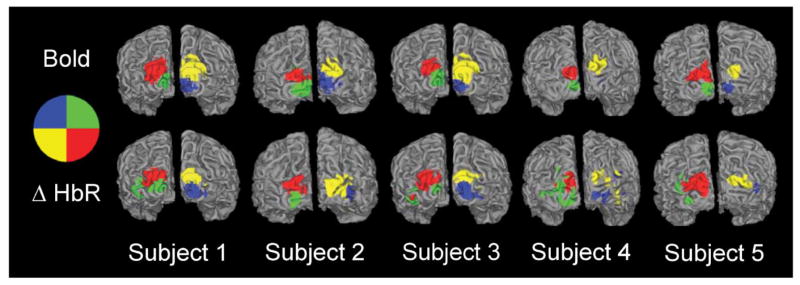
Quadrant activations for all five subjects. All HD-DOT quadrants are ΔHbR contrast. Note that for all subjects, there is qualitative agreement between HD-DOT and fMRI activations both in location as well as extent. The blue quadrant is nearly absent in Subject 4’s BOLD response because the actual recorded activation is deeper in the cortical folds than can be seen within this view. Note that the activation to that quadrant is detected with HD-DOT, but part of the activation is localized on the gyri superficial to the BOLD-measured location.
To quantify the localization error of HD-DOT reconstructions relative to the fMRI BOLD signal, we calculated the CofM error as the Euclidian distance between the CofM of the activations. The average CofM errors across all subjects are: ΔHbO2 4.9 +/− 1 mm, ΔHbR 5.4 +/− 2 mm, ΔHbT 4.7 +/− 1 mm, with an average across all hemoglobin contrasts of: 5.0 +/− 1 mm. The errors for the dorsal quadrants (4.2 +/− 1 mm) are lower than for the ventral quadrants (5.9 +/− 1 mm) (Fig. 3, Fig. 5, Supplementary Fig. 1).
Qualitatively, closer inspection shows that the HD-DOT signal diminishes with depth into the sulcal folds as compared to fMRI (Fig. 6); the HD-DOT response is contained almost entirely within the fMRI response area, and co-localized at the surface ridges of the cortical gyri.
Figure 6.

Overlay of HD-DOT (ΔHbO2) and fMRI activation in Subject 1. Visual stimulus in the lower right visual field gives rise to a strong response in the upper left visual cortex. Red: Overlap of HD-DOT and fMRI measured response. Yellow: HD-DOT but not fMRI. Green: fMRI but not HD-DOT. Note that the majority of the HD-DOT signal is co-localized with the fMRI response along the top 10 mm of the gyral ridges of the cortical surface. Activations are thresholded at 50% maximum for each modality. D: dorsal. A: anterior. L: left.
To determine the image quality throughout the field-of-view of the imaging pad, we applied a more continuous metric of response activation using Fourier phase analysis. We calculated phase maps for both fMRI (Fig. 7a) and HD-DOT (Fig. 7c) that revealed the pinwheel structure of the stimulus (Fig. 7b). For clarity, only the HbO2 contrast data is shown. The circular correlation coefficient (Lee and Fisher, 1983) CCC of the phases of the different modalities shows a strong correlation of 0.50 (Fig. 7d). This provides an assessment of how correlated HD-DOT and fMRI responses are for stimuli throughout the entire visual field of view.
Figure 7.

Phase map error analysis in Subject 2. (A) A map of phase is defined throughout the visual cortex for the BOLD response, shown here for Subject 2. (B) Visual stimulus key for the phase maps. (C) Phase map for HD-DOT (ΔHbO2 contrast). Note spatial correspondence with (A). (D) Scatter plot of circular correlation coefficient of BOLD and ΔHbO2 phases in each voxel within the field of view. Black line is the zero-error line. (E) A phase error plot is created by subtracting the HD-DOT phase in each voxel from the fMRI phase. All phase errors greater than +/− π are corrected via phase wrapping. (F) An estimate of the localization error between fMRI and DOT derived from the phase maps.
We also used the phase analysis to evaluate the localization error between HD-DOT and fMRI. The phase error between the HD-DOT and fMRI was calculated for each voxel and converted into a distance error. After converting to a distance error, the map of errors of the imaging pad on Subject 2 is smooth across the field of view and not dependent on the location of the voxel relative to the stimulus (Fig. 7f). A map of the localization error across the whole field of view was created for each subject (Supplementary Fig. 2). After removing outliers and averaging over all voxels for all subjects, the average localization error for the HD-DOT imaging pad is ΔHbO2 4.2 +/− 1 mm, ΔHbR 4.2 +/− 2 mm, ΔHbT 4.8 +/− 1 mm, giving an overall average of 4.4 +/− 1 mm. A summary of all localization errors is provided in Table 2.
Table 2.
Summary of HD-DOT imaging errors across subjects and contrasts.
| Center of mass error (mm, mean +/− SD) | Phase map error (mm, mean +/− SD) | |||||
|---|---|---|---|---|---|---|
| Subject | HbO2 | HbR | HbT | HbO2 | HbR | HbT |
| 1 | 5.6 +/− 2 | 5.7 +/− 1 | 5.6 +/− 2 | 4.6 +/− 4 | 4.7 +/− 4 | 4.8 +/− 4 |
| 2 | 3.4 +/− 2 | 4.4 +/− 2 | 3.6 +/− 1 | 3.2 +/− 3 | 4.4 +/− 3 | 4.0 +/− 4 |
| 3 | 3.9 +/− 3 | 3.9 +/− 2 | 4.1 +/− 4 | 6.5 +/− 5 | 5.3 +/− 4 | 6.0 +/− 5 |
| 4 | 6.7 +/− 1 | 7.8 +/− 1 | 5.4 +/− 2 | 3.4 +/− 3 | 3.5 +/− 2 | 6.0 +/− 3 |
| 5 | 4.9 +/− 2 | 5.2 +/− 2 | 4.9 +/− 2 | 3.4 +/− 3 | 3.2 +/− 3 | 3.2 +/− 3 |
| Average | 4.9 +/− 1 | 5.4 +/− 2 | 4.7 +/− 1 | 4.2 +/− 1 | 4.2 +/− 1 | 4.8 +/− 1 |
| Average | 5.0 +/− 1 | 4.4 +/− 1 | ||||
4. Discussion
Our results provide an image quality benchmark test of HD-DOT via a voxel-to-voxel comparison with fMRI. We demonstrate that the location and spatial extent HD-DOT activations are qualitatively similar to fMRI activations throughout the accessible portions of the visual cortex (Fig. 3 and Fig. 5). Since the data sets were co-registered time traces of responses within individual voxels could be compared. Consistent with previous fMRI and NIRS studies, the signals are highly correlated between the two modalities (Fig. 4). Qualitatively, the cortical topography of the responses agree strongly throughout the phase cycle of the stimulus presentation (Supplemental Movie 1). Quantitatively, we find the correspondence of quadrant locations between the two modalities to have an average center-of-mass error of 5.0 +/− 1 mm. Using phase maps to calculate localization error in every voxel across the field of view we measured an average localization error in the HD-DOT of 4.4 +/− 1 mm. Through examination of the voxel overlap between HD-DOT and fMRI, we find excellent agreement along the cortical ridges (Fig. 6), while the concurrence falls off as the cortex folds away from the scalp surface and the sensitivity of the HD-DOT system diminishes.
In this study a high density of overlapping measurements (Zeff et al., 2007) enabled a quantitative voxel-wise comparison of image quality of co-registered HD-DOT and fMRI over an extended region of cortex. Previous comparisons between fMRI and DOT have examined the co-localization between the two modalities in visual (Zhang et al., 2005) and motor (Joseph et al., 2006; Koch et al., 2010) cortices. However, these studies did not perform quantitative voxel-by-voxel comparisons. The motor papers used qualitative means to infer image agreement by projecting the fMRI data to individual DOI measurements at the scalp surface (Joseph et al., 2006), or used a generic head model for the forward light modeling rather than using the subject-specific anatomy to generate a realistic photon-propagation model (Koch et al., 2010) and then projected the data from the ‘model head’ onto the subject specific MRI anatomy. In contrast this visual study compared fMRI activations to DOT reconstructions in a subject-specific brain volume. The use of the subject-specific anatomy guarantees true alignment with the fMRI data set leading to the gyral specificity apparent in the reconstructions. The use of phase encoded retinotopy establishes the co-localization of HD-DOT and fMRI over contiguous regions of the visual cortex.
While topographic DOI methods remain in wide use (Cui et al., 2011; Franceschini et al., 2006; Khan et al., 2010; Lindauer et al., 2001; Ou et al., 2009; Sakatani et al., 2007; Tian et al., 2010), the image quality improvements of HD-DOT methods have been established by several research groups(Joseph et al., 2006; Koch et al., 2010; Zeff et al., 2007). Quantitative comparative studies, using both simulated and in vivo data, have demonstrated clear improvements in resolution of the tomography approach (Boas et al., 2004a; Boas et al., 2004b; Boas et al., 2001; Koch et al., 2010; White and Culver, 2010b). While elegant depth compensation algorithms have been proposed to increase the quality of depth localization of DOT (Niu et al., 2010), a full comparison of such methods is beyond the scope of the present work. The spatially-dependent regularization techniques use herein for human DOT have been detailed in references: (Dehghani et al., 2009; White and Culver, 2010a, b; White et al., 2009; Zeff et al., 2007). Incorporation of additional overlapping measurements provides the most straightforward approach to further increases in image quality and extension of the imaging domain. Specifically, it has been shown (Dehghani et al., 2009) that the inclusion of larger source-detector pair separations leads to improved depth profiling and sensitivity. As the measurement pair distances increase, the SNR falls off exponentionally (Boas et al., 2001). Thus, if DOT systems are developed with better sensitivity, they might sample deeper and possibly improve upon the resolution and localization accuracy of current systems. In these five subjects, the current system is capable of maintaining good localization (<5mm error) down to a cortical depth of 0.75 cm, or about 1.75 cm below the surface of the scalp.
In this study, we have used NIRFAST, a finite-element solver of the diffusion equation (Dehghani et al., 2003) to construct the model solution to the forward light scattering problem. Alternatively, a solution to the full radiative transport equation (RTE) can be obtained via Monte Carlo (MC) methods. Recent comparative studies between RTE and diffusion modeling have shown that the diffusion equation is sufficient for general considerations of DOT in healthy adults (Custo et al., 2006). The favorable comparative fMRI-DOT results of this paper using diffusion modeling further support the use of diffusion modeling. However, there may be clinical situations, for example patients with cerebral edema, in which MC modeling will have significant advantages. While historically MC modeling methods were very time consuming, recent advances in GPU technologies hold promise for more time efficient implementation of forward solvers (Fang and Boas, 2009; Ren et al., 2010). It will be important for future studies to compare the image quality of reconstructions obtained via both RTE and diffusion modeling.
General Linear Models (GLMs), while standard in the fMRI literature, are not yet standard with DOT. The localization error of the centers of mass of the quadrants was calculated using the reconstructed hemoglobin concentrations for HD-DOT and the raw BOLD signal for fMRI. No noise-weighting correction was made for either modality. However, in the phase-map analysis, we did calculate the statistical significance for the measured response within each voxel with a conservative weighting by the noise (see Methods). The phase map analysis conducted herein provided a similar analysis as GLM by calculating both the correlation magnitude and phase of the response to a periodic stimuli. More generalized statistical parametric mapping (SPM) methods have been developed for NIRS data (Villringer et al., 1993; Ye et al., 2009), that address the uneven spatial sampling of NIRS topography. In principal, due to the improved spatial sampling of DOT compared to NIRS (White and Culver, 2010b), the extension of SPM methods used in fMRI for calculating roughness and addressing the multiple comparisons problem should be more straight forward for DOT than NIRS.
In our analysis we smoothed (Gaussian kernel with FWHM = 13 mm) the fMRI data to match the DOT imaging point spread function based on the rationale that we wanted to compare the differences in the modalities, not differences in the point spread functions. However an alternate approach would be to use standard fMRI processing which typically uses 8 mm Gaussian smoothing (Wenger et al., 2004). To evaluate the localization errors with normal fMRI processing we re-ran the quadrant localization error analysis with a set of fMRI data smoothed to 8 mm. The resulting average localization error of the quadrants was 4.5 +/−2 mm, (within the error of the results from 13 mm smoothing). Thus the small localization errors between fMRI and HD-DOT hold even with standard fMRI processing.
The fMRI and HD-DOT data reside within the same model space. Thus, the magnitude of an error in the location of activation or a phase map value can be directly compared. The purpose of the current paper is a within-subject voxel-to-voxel comparison of HD-DOT and fMRI. We used five subjects to obtain a sampling across head types. We provide group averaging of the within subject errors between fMRI and DOT (errors in CofM and in the phase plots). Group averaging of the DOT data on a voxel by voxel basis requires spatial normalization that, while standardized for fMRI, has not yet been established in the literature for DOT. However, spatial normalization of DOT data will be an important area of future work to enable voxel-wise group level comparisons, data averaging, and better alignment with fMRI processing.
A general limitation of DOT systems is that while the upper portions of the cortical hull can be sampled, deep brain structures and deep cortical tissue along midline (e.g. area V1 of the visual cortex) cannot be sampled. To address this issue we constrained our comparison of fMRI and DOT to the regions of the tissue that were well sampled by the DOT imaging array. This limited the potential confound of having displaced or mismatched sampling volumes. Retinotopic stimuli, even at a single focal location in the visual field of view, lead to multiple activations within the visual cortex due to the presence of multiple representations (i.e. V1, V2, V3 etc…). Qualitatively, the cortical topography of the responses are in agreement throughout the accessible visual areas (Supplemental Movie 1). The phase analysis confirms this quantitatively.
5. Conclusion
These co-registered retinotopic results establish that HD-DOT methods can map brain function with good (< 5 mm localization error) voxel-to-voxel correspondence with fMRI. By using a phase-encoded visual paradigm this study not only compared point-activations but also full maps of visual cortex, a standard analysis in fMRI literature (Warnking et al., 2002). The HD-DOT maps were verified to be not only aligned with the fMRI but also possessing the same qualitative contours and structure along the cortical ribbon. Limiting aspects of previous HD-DOT studies (Custo et al., 2009; Zeff et al., 2007) were directly addressed. Specifically, we used anatomical head modeling with accurate optode placement, co-registration of the data set to not only the specific subject anatomy but also to an additional neuroimaging modality, and contiguous mapping of an extend region of the cortex. The resulting voxel-wise comparison reveals that the localization errors between HD-DOT and fMRI in functional maps of visual cortex are on average within the size of a gyral ridge. This gyral specificity demonstrates that HD-DOT methods show great promise and have sufficient image quality to be useful as a surrogate for fMRI in both clinical and basic neuroscience.
Supplementary Material
Acknowledgments
We thank Gavin Perry and Martin Olevitch for help with HD-DOT instrumentation and software; Fran Miezin for developing the BOLD sequence we used; Donna Dierker for help and patience with Caret and FreeSurfer software; and Tracy Nolan and Linda Larson-Prior with some MRI data acquisition.
7. Role of the Funding Source: This work was supported in part by NIH grants R01-EB009233 (J.P.C), T90-DA022871 (Imaging Science Fellowship, B.R.W.) and a Fulbright Science and Technology Ph.D. Award (S.L.F.). The funding source had no involvement in the study design, collection, analysis, interpretation of the data, writing of the paper, or decision to submit the paper for publication. J.P.C and Washington University have financial interests in Cephalogics LLC based on a license of related optical imaging technology by the University to Cephalogics LLC.
Abbreviations
- HD-DOT
high-density diffuse optical tomography
- DOI
diffuse optical imaging
- HbO2
oxyhemoglobin
- HbR
deoxyhemoglobin
- HbT
total hemoglobin
- FOV
field of view
Footnotes
Publisher's Disclaimer: This is a PDF file of an unedited manuscript that has been accepted for publication. As a service to our customers we are providing this early version of the manuscript. The manuscript will undergo copyediting, typesetting, and review of the resulting proof before it is published in its final citable form. Please note that during the production process errors may be discovered which could affect the content, and all legal disclaimers that apply to the journal pertain.
References
- Belliveau JW, Kennedy DN, Jr, McKinstry RC, Buchbinder BR, Weisskoff RM, Cohen MS, Vevea JM, Brady TJ, Rosen BR. Functional mapping of the human visual cortex by magnetic resonance imaging. Science. 1991;254:716–719. doi: 10.1126/science.1948051. [DOI] [PubMed] [Google Scholar]
- Benaron DA, Hintz SR, Villringer A, Boas D, Kleinschmidt A, Frahm J, Hirth C, Obrig H, van Houten JC, Kermit EL, Cheong WF, Stevenson DK. Noninvasive functional imaging of human brain using light. Journal of cerebral blood flow and metabolism : official journal of the International Society of Cerebral Blood Flow and Metabolism. 2000;20:469–477. doi: 10.1097/00004647-200003000-00005. [DOI] [PubMed] [Google Scholar]
- Bevilacqua F, Piguet D, Marquet P, Gross JD, Tromberg BJ, Depeursinge C. In vivo local determination of tissue optical properties: applications to human brain. Appl Opt. 1999;38:4939–4950. doi: 10.1364/ao.38.004939. [DOI] [PubMed] [Google Scholar]
- Blasi A, Fox S, Everdell N, Volein A, Tucker L, Csibra G, Gibson AP, Hebden JC, Johnson MH, Elwell CE. Investigation of depth dependent changes in cerebral haemodynamics during face perception in infants. Physics in medicine and biology. 2007;52:6849–6864. doi: 10.1088/0031-9155/52/23/005. [DOI] [PubMed] [Google Scholar]
- Bluestone A, Abdoulaev G, Schmitz C, Barbour R, Hielscher A. Three-dimensional optical tomography of hemodynamics in the human head. Optics express. 2001;9:272–286. doi: 10.1364/oe.9.000272. [DOI] [PubMed] [Google Scholar]
- Boas DA, Chen K, Grebert D, Franceschini MA. Improving the diffuse optical imaging spatial resolution of the cerebral hemodynamic response to brain activation in humans. Optics letters. 2004a;29:1506–1508. doi: 10.1364/ol.29.001506. [DOI] [PubMed] [Google Scholar]
- Boas DA, Dale AM. Simulation study of magnetic resonance imaging-guided cortically constrained diffuse optical tomography of human brain function. Applied optics. 2005;44:1957–1968. doi: 10.1364/ao.44.001957. [DOI] [PubMed] [Google Scholar]
- Boas DA, Dale AM, Franceschini MA. Diffuse optical imaging of brain activation: approaches to optimizing image sensitivity, resolution, and accuracy. Neuroimage. 2004b;23(Suppl 1):S275–288. doi: 10.1016/j.neuroimage.2004.07.011. [DOI] [PubMed] [Google Scholar]
- Boas DA, Gaudette T, Strangman G, Cheng X, Marota JJ, Mandeville JB. The accuracy of near infrared spectroscopy and imaging during focal changes in cerebral hemodynamics. Neuroimage. 2001;13:76–90. doi: 10.1006/nimg.2000.0674. [DOI] [PubMed] [Google Scholar]
- Bouchard MB, Chen BR, Burgess SA, Hillman EM. Ultra-fast multispectral optical imaging of cortical oxygenation, blood flow, and intracellular calcium dynamics. Optics express. 2009;17:15670–15678. doi: 10.1364/OE.17.015670. [DOI] [PMC free article] [PubMed] [Google Scholar]
- Cui X, Bray S, Bryant DM, Glover GH, Reiss AL. A quantitative comparison of NIRS and fMRI across multiple cognitive tasks. Neuroimage. 2011;54:2808–2821. doi: 10.1016/j.neuroimage.2010.10.069. [DOI] [PMC free article] [PubMed] [Google Scholar]
- Culver JP, Durduran T, Furuya D, Cheung C, Greenberg JH, Yodh AG. Diffuse optical tomography of cerebral blood flow, oxygenation, and metabolism in rat during focal ischemia. Journal of cerebral blood flow and metabolism : official journal of the International Society of Cerebral Blood Flow and Metabolism. 2003;23:911–924. doi: 10.1097/01.WCB.0000076703.71231.BB. [DOI] [PubMed] [Google Scholar]
- Custo A, Boas DA, Tsuzuki D, Dan I, Mesquita R, Fischl B, Grimson WE, Wells W., 3rd Anatomical atlas-guided diffuse optical tomography of brain activation. Neuroimage. 2009;49:561–567. doi: 10.1016/j.neuroimage.2009.07.033. [DOI] [PMC free article] [PubMed] [Google Scholar]
- Custo A, Wells WM, 3rd, Barnett AH, Hillman EM, Boas DA. Effective scattering coefficient of the cerebral spinal fluid in adult head models for diffuse optical imaging. Applied optics. 2006;45:4747–4755. doi: 10.1364/ao.45.004747. [DOI] [PubMed] [Google Scholar]
- Dale AM, Fischl B, Sereno MI. Cortical surface-based analysis. I. Segmentation and surface reconstruction. Neuroimage. 1999;9:179–194. doi: 10.1006/nimg.1998.0395. [DOI] [PubMed] [Google Scholar]
- Dehaes M, Grant PE, Sliva DD, Roche-Labarbe N, Pienaar R, Boas DA, Franceschini MA, Selb J. Assessment of the frequency-domain multi-distance method to evaluate the brain optical properties: Monte Carlo simulations from neonate to adult. Biomedical optics express. 2011;2:552–567. doi: 10.1364/BOE.2.000552. [DOI] [PMC free article] [PubMed] [Google Scholar]
- Dehghani H, Arridge SR, Schweiger M, Delpy DT. Optical tomography in the presence of void regions. Journal of the Optical Society of America A, Optics, image science, and vision. 2000;17:1659–1670. doi: 10.1364/josaa.17.001659. [DOI] [PubMed] [Google Scholar]
- Dehghani H, Pogue BW, Poplack SP, Paulsen KD. Multiwavelength three-dimensional near-infrared tomography of the breast: initial simulation, phantom, and clinical results. Appl Opt. 2003;42:135–145. doi: 10.1364/ao.42.000135. [DOI] [PubMed] [Google Scholar]
- Dehghani H, White BR, Zeff BW, Tizzard A, Culver JP. Depth sensitivity and image reconstruction analysis of dense imaging arrays for mapping brain function with diffuse optical tomography. Appl Opt. 2009;48:D137–143. doi: 10.1364/ao.48.00d137. [DOI] [PMC free article] [PubMed] [Google Scholar]
- Devor A, Dunn AK, Andermann ML, Ulbert I, Boas DA, Dale AM. Coupling of total hemoglobin concentration, oxygenation, and neural activity in rat somatosensory cortex. Neuron. 2003;39:353–359. doi: 10.1016/s0896-6273(03)00403-3. [DOI] [PubMed] [Google Scholar]
- Dunn AK, Devor A, Dale AM, Boas DA. Spatial extent of oxygen metabolism and hemodynamic changes during functional activation of the rat somatosensory cortex. Neuroimage. 2005;27:279–290. doi: 10.1016/j.neuroimage.2005.04.024. [DOI] [PubMed] [Google Scholar]
- Engel SA, Glover GH, Wandell BA. Retinotopic organization in human visual cortex and the spatial precision of functional MRI. Cereb Cortex. 1997;7:181–192. doi: 10.1093/cercor/7.2.181. [DOI] [PubMed] [Google Scholar]
- Engel SA, Rumelhart DE, Wandell BA, Lee AT, Glover GH, Chichilnisky EJ, Shadlen MN. fMRI of human visual cortex. Nature. 1994;369:525. doi: 10.1038/369525a0. [DOI] [PubMed] [Google Scholar]
- Fang Q, Boas DA. Monte Carlo simulation of photon migration in 3D turbid media accelerated by graphics processing units. Optics express. 2009;17:20178–20190. doi: 10.1364/OE.17.020178. [DOI] [PMC free article] [PubMed] [Google Scholar]
- Felleman DJ, Van Essen DC. Distributed hierarchical processing in the primate cerebral cortex. Cereb Cortex. 1991;1:1–47. doi: 10.1093/cercor/1.1.1-a. [DOI] [PubMed] [Google Scholar]
- Fischl B, Liu A, Dale AM. Automated manifold surgery: constructing geometrically accurate and topologically correct models of the human cerebral cortex. IEEE transactions on medical imaging. 2001;20:70–80. doi: 10.1109/42.906426. [DOI] [PubMed] [Google Scholar]
- Fox PT, Mintun MA, Raichle ME, Miezin FM, Allman JM, Van Essen DC. Mapping human visual cortex with positron emission tomography. Nature. 1986;323:806–809. doi: 10.1038/323806a0. [DOI] [PubMed] [Google Scholar]
- Fox PT, Perlmutter JS, Raichle ME. A stereotactic method of anatomical localization for positron emission tomography. J Comput Assist Tomogr. 1985;9:141–153. doi: 10.1097/00004728-198501000-00025. [DOI] [PubMed] [Google Scholar]
- Franceschini MA, Joseph DK, Huppert TJ, Diamond SG, Boas DA. Diffuse optical imaging of the whole head. Journal of biomedical optics. 2006;11:054007. doi: 10.1117/1.2363365. [DOI] [PMC free article] [PubMed] [Google Scholar]
- Fuchs M, Kastner J, Wagner M, Hawes S, Ebersole JS. A standardized boundary element method volume conductor model. Clinical neurophysiology : official journal of the International Federation of Clinical Neurophysiology. 2002;113:702–712. doi: 10.1016/s1388-2457(02)00030-5. [DOI] [PubMed] [Google Scholar]
- Gibson A, Dehghani H. Diffuse optical imaging. Philosophical transactions Series A, Mathematical, physical, and engineering sciences. 2009;367:3055–3072. doi: 10.1098/rsta.2009.0080. [DOI] [PubMed] [Google Scholar]
- Gibson A, Yusof RM, Dehghani H, Riley J, Everdell N, Richards R, Hebden JC, Schweiger M, Arridge SR, Delpy DT. Optical tomography of a realistic neonatal head phantom. Applied optics. 2003;42:3109–3116. doi: 10.1364/ao.42.003109. [DOI] [PubMed] [Google Scholar]
- Gibson AP, Austin T, Everdell NL, Schweiger M, Arridge SR, Meek JH, Wyatt JS, Delpy DT, Hebden JC. Three-dimensional whole-head optical tomography of passive motor evoked responses in the neonate. Neuroimage. 2006;30:521–528. doi: 10.1016/j.neuroimage.2005.08.059. [DOI] [PubMed] [Google Scholar]
- Gibson AP, Hebden JC, Arridge SR. Recent advances in diffuse optical imaging. Physics in medicine and biology. 2005;50:R1–43. doi: 10.1088/0031-9155/50/4/r01. [DOI] [PubMed] [Google Scholar]
- Gilbert CD, Wiesel TN. Morphology and intracortical projections of functionally characterised neurones in the cat visual cortex. Nature. 1979;280:120–125. doi: 10.1038/280120a0. [DOI] [PubMed] [Google Scholar]
- Habermehl C, Holtze S, Steinbrink J, Koch SP, Obrig H, Mehnert J, Schmitz CH. Somatosensory activation of two fingers can be discriminated with ultrahigh-density diffuse optical tomography. Neuroimage. 2011 doi: 10.1016/j.neuroimage.2011.11.062. [DOI] [PMC free article] [PubMed] [Google Scholar]
- Harding GF, Janday B, Armstrong RA. Topographic mapping and source localization of the pattern reversal visual evoked magnetic response. Brain Topogr. 1991;4:47–55. doi: 10.1007/BF01129665. [DOI] [PubMed] [Google Scholar]
- Hebden JC, Gibson A, Yusof RM, Everdell N, Hillman EM, Delpy DT, Arridge SR, Austin T, Meek JH, Wyatt JS. Three-dimensional optical tomography of the premature infant brain. Physics in medicine and biology. 2002;47:4155–4166. doi: 10.1088/0031-9155/47/23/303. [DOI] [PubMed] [Google Scholar]
- Heiskala J, Pollari M, Metsaranta M, Grant PE, Nissila I. Probabilistic atlas can improve reconstruction from optical imaging of the neonatal brain. Optics express. 2009;17:14977–14992. doi: 10.1364/oe.17.014977. [DOI] [PubMed] [Google Scholar]
- Huppert TJ, Hoge RD, Dale AM, Franceschini MA, Boas DA. Quantitative spatial comparison of diffuse optical imaging with blood oxygen level-dependent and arterial spin labeling-based functional magnetic resonance imaging. Journal of biomedical optics. 2006a;11:064018. doi: 10.1117/1.2400910. [DOI] [PMC free article] [PubMed] [Google Scholar]
- Huppert TJ, Hoge RD, Diamond SG, Franceschini MA, Boas DA. A temporal comparison of BOLD, ASL, and NIRS hemodynamic responses to motor stimuli in adult humans. Neuroimage. 2006b;29:368–382. doi: 10.1016/j.neuroimage.2005.08.065. [DOI] [PMC free article] [PubMed] [Google Scholar]
- Joseph DK, Huppert TJ, Franceschini MA, Boas DA. Diffuse optical tomography system to image brain activation with improved spatial resolution and validation with functional magnetic resonance imaging. Applied optics. 2006;45:8142–8151. doi: 10.1364/ao.45.008142. [DOI] [PubMed] [Google Scholar]
- Khan B, Tian F, Behbehani K, Romero MI, Delgado MR, Clegg NJ, Smith L, Reid D, Liu H, Alexandrakis G. Identification of abnormal motor cortex activation patterns in children with cerebral palsy by functional near-infrared spectroscopy. Journal of biomedical optics. 2010;15:036008. doi: 10.1117/1.3432746. [DOI] [PMC free article] [PubMed] [Google Scholar]
- Klem GH, Luders HO, Jasper HH, Elger C. The ten-twenty electrode system of the International Federation. The International Federation of Clinical Neurophysiology. Electroencephalography and clinical neurophysiology Supplement. 1999;52:3–6. [PubMed] [Google Scholar]
- Koch SP, Habermehl C, Mehnert J, Schmitz CH, Holtze S, Villringer A, Steinbrink J, Obrig H. High-resolution optical functional mapping of the human somatosensory cortex. Front Neuroenergetics. 2010;2:12. doi: 10.3389/fnene.2010.00012. [DOI] [PMC free article] [PubMed] [Google Scholar]
- Kohl-Bareis M, Obrig H, Steinbrink J, Malak J, Uludag K, Villringer A. Noninvasive monitoring of cerebral blood flow by a dye bolus method: separation of brain from skin and skull signals. Journal of biomedical optics. 2002;7:464–470. doi: 10.1117/1.1482719. [DOI] [PubMed] [Google Scholar]
- Lee WH, Fisher J. Right ventricular diastolic disorders. Archives of internal medicine. 1983;143:332–337. [PubMed] [Google Scholar]
- Lindauer U, Royl G, Leithner C, Kuhl M, Gold L, Gethmann J, Kohl-Bareis M, Villringer A, Dirnagl U. No evidence for early decrease in blood oxygenation in rat whisker cortex in response to functional activation. Neuroimage. 2001;13:988–1001. doi: 10.1006/nimg.2000.0709. [DOI] [PubMed] [Google Scholar]
- Maki A, Yamashita Y, Ito Y, Watanabe E, Mayanagi Y, Koizumi H. Spatial and temporal analysis of human motor activity using noninvasive NIR topography. Medical physics. 1995;22:1997–2005. doi: 10.1118/1.597496. [DOI] [PubMed] [Google Scholar]
- Nelles M, Gieseke J, Urbach H, Semrau R, Bystrov D, Schild HH, Willinek WA. Pre- and postoperative MR brain imaging with automatic planning and scanning software in tumor patients: an intraindividual comparative study at 3 Tesla. Journal of magnetic resonance imaging : JMRI. 2009;30:672–677. doi: 10.1002/jmri.21888. [DOI] [PubMed] [Google Scholar]
- Niu H, Lin ZJ, Tian F, Dhamne S, Liu H. Comprehensive investigation of three-dimensional diffuse optical tomography with depth compensation algorithm. Journal of biomedical optics. 2010;15:046005. doi: 10.1117/1.3462986. [DOI] [PMC free article] [PubMed] [Google Scholar]
- Obrig H, Villringer A. Beyond the visible--imaging the human brain with light. Journal of cerebral blood flow and metabolism : official journal of the International Society of Cerebral Blood Flow and Metabolism. 2003;23:1–18. doi: 10.1097/01.WCB.0000043472.45775.29. [DOI] [PubMed] [Google Scholar]
- Okamoto M, Dan H, Shimizu K, Takeo K, Amita T, Oda I, Konishi I, Sakamoto K, Isobe S, Suzuki T, Kohyama K, Dan I. Multimodal assessment of cortical activation during apple peeling by NIRS and fMRI. Neuroimage. 2004;21:1275–1288. doi: 10.1016/j.neuroimage.2003.12.003. [DOI] [PubMed] [Google Scholar]
- Ou W, Nissila I, Radhakrishnan H, Boas DA, Hamalainen MS, Franceschini MA. Study of neurovascular coupling in humans via simultaneous magnetoencephalography and diffuse optical imaging acquisition. Neuroimage. 2009;46:624–632. doi: 10.1016/j.neuroimage.2009.03.008. [DOI] [PMC free article] [PubMed] [Google Scholar]
- Ren N, Liang J, Qu X, Li J, Lu B, Tian J. GPU-based Monte Carlo simulation for light propagation in complex heterogeneous tissues. Optics express. 2010;18:6811–6823. doi: 10.1364/OE.18.006811. [DOI] [PubMed] [Google Scholar]
- Ripoll J, Nieto-Vesperinas M, Arridge SR, Dehghani H. Boundary conditions for light propagation in diffusive media with nonscattering regions. Journal of the Optical Society of America A, Optics, image science, and vision. 2000;17:1671–1681. doi: 10.1364/josaa.17.001671. [DOI] [PubMed] [Google Scholar]
- Rosa MG, Soares JG, Fiorani M, Jr, Gattass R. Cortical afferents of visual area MT in the Cebus monkey: possible homologies between New and Old World monkeys. Vis Neurosci. 1993;10:827–855. doi: 10.1017/s0952523800006064. [DOI] [PubMed] [Google Scholar]
- Sakatani K, Murata Y, Fujiwara N, Hoshino T, Nakamura S, Kano T, Katayama Y. Comparison of blood-oxygen-level-dependent functional magnetic resonance imaging and near-infrared spectroscopy recording during functional brain activation in patients with stroke and brain tumors. J Biomed Opt. 2007;12:062110. doi: 10.1117/1.2823036. [DOI] [PubMed] [Google Scholar]
- Sassaroli A, de BFB, Tong Y, Renshaw PF, Fantini S. Spatially weighted BOLD signal for comparison of functional magnetic resonance imaging and near-infrared imaging of the brain. Neuroimage. 2006;33:505–514. doi: 10.1016/j.neuroimage.2006.07.006. [DOI] [PubMed] [Google Scholar]
- Saygin AP, Sereno MI. Retinotopy and attention in human occipital, temporal, parietal, and frontal cortex. Cerebral cortex. 2008;18:2158–2168. doi: 10.1093/cercor/bhm242. [DOI] [PubMed] [Google Scholar]
- Segonne F, Dale AM, Busa E, Glessner M, Salat D, Hahn HK, Fischl B. A hybrid approach to the skull stripping problem in MRI. Neuroimage. 2004;22:1060–1075. doi: 10.1016/j.neuroimage.2004.03.032. [DOI] [PubMed] [Google Scholar]
- Selb J, Stott JJ, Franceschini MA, Sorensen AG, Boas DA. Improved sensitivity to cerebral hemodynamics during brain activation with a time-gated optical system: analytical model and experimental validation. Journal of biomedical optics. 2005;10:11013. doi: 10.1117/1.1852553. [DOI] [PubMed] [Google Scholar]
- Sereno MI, Dale AM, Reppas JB, Kwong KK, Belliveau JW, Brady TJ, Rosen BR, Tootell RB. Borders of multiple visual areas in humans revealed by functional magnetic resonance imaging. Science. 1995;268:889–893. doi: 10.1126/science.7754376. [DOI] [PubMed] [Google Scholar]
- Shimony JS, Zhang D, Johnston JM, Fox MD, Roy A, Leuthardt EC. Resting-state spontaneous fluctuations in brain activity: a new paradigm for presurgical planning using fMRI. Academic radiology. 2009;16:578–583. doi: 10.1016/j.acra.2009.02.001. [DOI] [PMC free article] [PubMed] [Google Scholar]
- Shulman GL, Pope DL, Astafiev SV, McAvoy MP, Snyder AZ, Corbetta M. Right hemisphere dominance during spatial selective attention and target detection occurs outside the dorsal frontoparietal network. J Neurosci. 2010;30:3640–3651. doi: 10.1523/JNEUROSCI.4085-09.2010. [DOI] [PMC free article] [PubMed] [Google Scholar]
- Siegel AM, Culver JP, Mandeville JB, Boas DA. Temporal comparison of functional brain imaging with diffuse optical tomography and fMRI during rat forepaw stimulation. Physics in medicine and biology. 2003;48:1391–1403. doi: 10.1088/0031-9155/48/10/311. [DOI] [PubMed] [Google Scholar]
- Spalding JM. Wounds of the visual pathway. Part II. The striate cortex. J Neurol Neurosurg Psychiatry. 1952;15:169–183. doi: 10.1136/jnnp.15.3.169. [DOI] [PMC free article] [PubMed] [Google Scholar]
- Steinbrink J, Wabnitz H, Obrig H, Villringer A, Rinneberg H. Determining changes in NIR absorption using a layered model of the human head. Physics in medicine and biology. 2001;46:879–896. doi: 10.1088/0031-9155/46/3/320. [DOI] [PubMed] [Google Scholar]
- Strangman G, Culver JP, Thompson JH, Boas DA. A quantitative comparison of simultaneous BOLD fMRI and NIRS recordings during functional brain activation. Neuroimage. 2002;17:719–731. [PubMed] [Google Scholar]
- Strangman G, Franceschini MA, Boas DA. Factors affecting the accuracy of near-infrared spectroscopy concentration calculations for focal changes in oxygenation parameters. Neuroimage. 2003;18:865–879. doi: 10.1016/s1053-8119(03)00021-1. [DOI] [PubMed] [Google Scholar]
- Tian F, Delgado MR, Dhamne SC, Khan B, Alexandrakis G, Romero MI, Smith L, Reid D, Clegg NJ, Liu H. Quantification of functional near infrared spectroscopy to assess cortical reorganization in children with cerebral palsy. Optics express. 2010;18:25973–25986. doi: 10.1364/OE.18.025973. [DOI] [PMC free article] [PubMed] [Google Scholar]
- Toronov V, Webb A, Choi JH, Wolf M, Michalos A, Gratton E, Hueber D. Investigation of human brain hemodynamics by simultaneous near-infrared spectroscopy and functional magnetic resonance imaging. Med Phys. 2001;28:521–527. doi: 10.1118/1.1354627. [DOI] [PubMed] [Google Scholar]
- Toronov VY, Zhang X, Webb AG. A spatial and temporal comparison of hemodynamic signals measured using optical and functional magnetic resonance imaging during activation in the human primary visual cortex. Neuroimage. 2007;34:1136–1148. doi: 10.1016/j.neuroimage.2006.08.048. [DOI] [PMC free article] [PubMed] [Google Scholar]
- Van Essen DC, Drury HA, Dickson J, Harwell J, Hanlon D, Anderson CH. An integrated software suite for surface-based analyses of cerebral cortex. J Am Med Inform Assoc. 2001;8:443–459. doi: 10.1136/jamia.2001.0080443. [DOI] [PMC free article] [PubMed] [Google Scholar]
- Villringer A, Chance B. Non-invasive optical spectroscopy and imaging of human brain function. Trends in neurosciences. 1997;20:435–442. doi: 10.1016/s0166-2236(97)01132-6. [DOI] [PubMed] [Google Scholar]
- Villringer A, Planck J, Hock C, Schleinkofer L, Dirnagl U. Near infrared spectroscopy (NIRS): a new tool to study hemodynamic changes during activation of brain function in human adults. Neuroscience letters. 1993;154:101–104. doi: 10.1016/0304-3940(93)90181-j. [DOI] [PubMed] [Google Scholar]
- Warnking J, Dojat M, Guerin-Dugue A, Delon-Martin C, Olympieff S, Richard N, Chehikian A, Segebarth C. fMRI retinotopic mapping--step by step. Neuroimage. 2002;17:1665–1683. doi: 10.1006/nimg.2002.1304. [DOI] [PubMed] [Google Scholar]
- Wengenroth M, Blatow M, Guenther J, Akbar M, Tronnier VM, Stippich C. Diagnostic benefits of presurgical fMRI in patients with brain tumours in the primary sensorimotor cortex. European radiology. 2011;21:1517–1525. doi: 10.1007/s00330-011-2067-9. [DOI] [PMC free article] [PubMed] [Google Scholar]
- Wenger KK, Visscher KM, Miezin FM, Petersen SE, Schlaggar BL. Comparison of sustained and transient activity in children and adults using a mixed blocked/event-related fMRI design. Neuroimage. 2004;22:975–985. doi: 10.1016/j.neuroimage.2004.02.028. [DOI] [PubMed] [Google Scholar]
- White BR, Culver JP. Phase-encoded retinotopy as an evaluation of diffuse optical neuroimaging. Neuroimage. 2010a;49:568–577. doi: 10.1016/j.neuroimage.2009.07.023. [DOI] [PMC free article] [PubMed] [Google Scholar]
- White BR, Culver JP. Quantitative evaluation of high-density diffuse optical tomography: in vivo resolution and mapping performance. J Biomed Opt. 2010b;15:026006. doi: 10.1117/1.3368999. [DOI] [PMC free article] [PubMed] [Google Scholar]
- White BR, Snyder AZ, Cohen AL, Petersen SE, Raichle ME, Schlaggar BL, Culver JP. Resting-state functional connectivity in the human brain revealed with diffuse optical tomography. Neuroimage. 2009;47:148–156. doi: 10.1016/j.neuroimage.2009.03.058. [DOI] [PMC free article] [PubMed] [Google Scholar]
- Ye JC, Tak S, Jang KE, Jung J, Jang J. NIRS-SPM: statistical parametric mapping for near-infrared spectroscopy. Neuroimage. 2009;44:428–447. doi: 10.1016/j.neuroimage.2008.08.036. [DOI] [PubMed] [Google Scholar]
- Zeff BW, White BR, Dehghani H, Schlaggar BL, Culver JP. Retinotopic mapping of adult human visual cortex with high-density diffuse optical tomography. Proc Natl Acad Sci U S A. 2007;104:12169–12174. doi: 10.1073/pnas.0611266104. [DOI] [PMC free article] [PubMed] [Google Scholar]
- Zhang D, Johnston JM, Fox MD, Leuthardt EC, Grubb RL, Chicoine MR, Smyth MD, Snyder AZ, Raichle ME, Shimony JS. Preoperative sensorimotor mapping in brain tumor patients using spontaneous fluctuations in neuronal activity imaged with functional magnetic resonance imaging: initial experience. Neurosurgery. 2009;65:226–236. doi: 10.1227/01.NEU.0000350868.95634.CA. [DOI] [PMC free article] [PubMed] [Google Scholar]
- Zhang X, Toronov V, Webb A. Simultaneous integrated diffuse optical tomography and functional magnetic resonance imaging of the human brain. Opt Express. 2005;13:5513–5521. doi: 10.1364/opex.13.005513. [DOI] [PMC free article] [PubMed] [Google Scholar]
Associated Data
This section collects any data citations, data availability statements, or supplementary materials included in this article.