Abstract
Kaposi’s sarcoma (KS) is an infectious cancer occurring most commonly in human immunodeficiency virus (HIV) positive patients and in endemic regions, such as Sub-Saharan Africa, where KS is among the top four most prevalent cancers. The cause of KS is the Kaposi’s sarcoma-associated herpesvirus (KSHV, also called HHV-8), an oncogenic herpesvirus that while routinely diagnosed in developed nations, provides challenges to developing world medical providers and point-of-care detection. A major challenge in the diagnosis of KS is the existence of a number of other diseases with similar clinical presentation and histopathological features, requiring the detection of KSHV in a biopsy sample. In this work we develop an answer to this challenge by creating a multiplexed one-pot detection system for KSHV DNA and DNA from a frequently confounding disease, bacillary angiomatosis. Gold and silver nanoparticle aggregation reactions are tuned for each target and a multi-color change system is developed capable of detecting both targets down to levels between 1 nM and 2 nM. The system developed here could later be integrated with microfluidic sample processing to create a final device capable of solving the two major challenges in point-of-care KS detection.
Introduction
With the onset of the acquired immunodeficiency syndrome (AIDS) epidemic in the early 1980s, one of the first indicators of infected patients was the presence of red skin lesions, a symptom of a disease known as Kaposi’s sarcoma (KS).1–4 Before the discovery of the cause of AIDS, KS and other opportunistic infections were often the first signs, and biggest complications, for infected individuals. During this time significant research efforts were made to determine the cause of AIDS, and in 1983 HIV was discovered.5–6 A little over ten years later the cause of KS was first connected to a second virus, Kaposi’s sarcoma-associated herpesvirus (KSHV), later given the alternative designation of human herpesvirus 8 (HHV-8).7
Today, KS is still the most prevalent cancer in untreated HIV-infected individuals. Initial studies showed that it affected 1 in 20 HIV-positive patients.8 With the introduction of highly active anti-retroviral therapy (HAART), patients in the developed world have seen improvements in the management and treatment of KS, but it remains increased in incidence as compared to the pre-AIDS era in HIV-infected patients.9–10 In regions of the developing world, such as Sub-Saharan Africa, both HIV and KS are endemic, and KS is the fourth leading cancer in the region.11 In some countries such as Uganda, KS is the number one cause of cancer in men.11–12
The infectious cause of KS is now well known to be the oncogenic herpesvirus KSHV or HHV-8.7, 13 While the details of transmission are still being studied, it is most likely through saliva 14–16 and in some regions KSHV rapidly spreads beginning in childhood affecting large portions of the population, reaching seroprevalence of over 50%.11, 17 Like other herpesviruses, KSHV can establish a latent infection, and remains without causing any disease for the remaining life in most infected hosts, being necessary but not sufficient of KS development. In locations where the seroprevalence of KSHV is this high, the clinically relevant test becomes determining if KSHV is present in a specific tumor, and not simply if it is present in a person’s blood. A second issue arises because of a number of other diseases have a similar presentation as Kaposi’s sarcoma, and are part of the differential diagnosis.18–20 KS most often presents as a collection of red lesions, and when looked at on a typical hematoxylin and eosin (H&E) stained histology slide has a number of unique features, including vascular spaces and proliferation of spindle cells thought to be of lymphatic endothelial origin.13, 21 However, while these features are characteristic of KS, a number of other diseases, including bacillary angiomatosis (BA) caused by Bartonella henselae or quintana, and pyogenic granuloma with no known infectious cause, can often have a similar clinical and histological appearance and represent a diagnostic challenge.18–19
In developed clinical settings, skin biopsies are easily processed for histology using advanced tools including tissue processing systems and microtomes. KS diagnosis can then be made after an H&E staining through microscopic evaluation by a pathologist, and when the histological characteristics are uncertain, the presence of KSHV is determined to confirm the diagnosis either with immunohistochemistry specific for unique KSHV proteins or polymerase chain reaction (PCR) specific for unique KSHV DNA sequences. While the professional expertise and methods for sample preparation and diagnostic techniques are available in developed nations, they are scarce or nonexistent in many of the places where KS is most prevalent. If affordable point-of-care diagnostics could be created that are capable of distinguishing KS from other similar conditions, better treatment could be provided. Ultimately, two unique challenges present themselves in the creation of point-of-care diagnostics for Kaposi’s sarcoma in the developing world. The first is the requirement for the detection of KSHV in a biopsy sample without reliance on common laboratory technology. Extracting DNA from a skin biopsy sample using only simple, robust technology has thus far received little attention. The second challenge involves the presence of other diseases that can mimic KS, and thus the need for creating multiplexed detections that can distinguish one from the other. Further, these multiplexed detection systems need to be easily integrated to work with a small sample size, and in the presence of whatever surfactants and contamination is left over after DNA extraction.
While diagnostics in the developing world in general pose a number of challenges, a large amount of work has been done addressing them. Recently an abundance of biosensors have been developing using mechanical,22–23 electrical,24 and optical 25 techniques to detect bioanalytes in minute quantities. Many of these devices combine microfluidics and other nanotechnologies in order to create tools which both operate at the length scale of the detection target and at a macroscopic scale which can be simply read-out. A number of them have even been applied in the developing world, where the additional constraints placed on devices by a lack of resources and trained personnel compound issues further.26–27 Yet for all of the successes of these biosensors, a number of limitations still exist, including the need to pre-process samples, the ability to work in a range of buffers (including those used to lyse cells), high sensitivity limits, and often a limited ability to detect multiple targets.
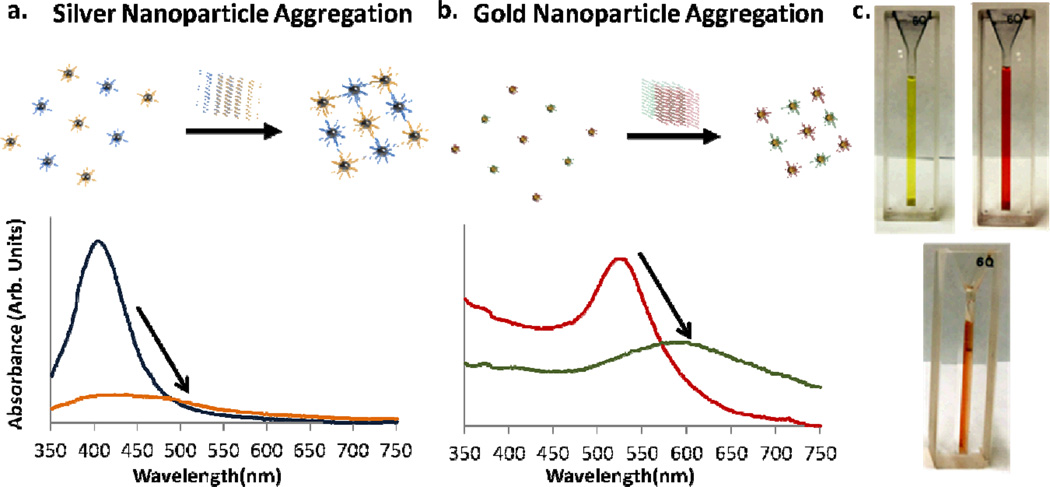
Perhaps some of the most interesting recently developed diagnostic technologies are those which link the presence of a bioanalyte to changes in the localized surface plasmon resonance of metal nanostructures.28–30 These devices are both highly sensitive and produce a convincing color-change that is discernible to the naked eye. To date techniques using nanoparticle based detection schemes have been applied to the recognition of oligonucleotides,31–32 proteins,33 metal ions,34 and other small molecules.35–36 In the form of metal nanoparticles, localized surface plasmon resonance biosensors often rely on some target molecule to trigger particle aggregation. When nanoparticles aggregate as illustrated in Figures 1a and 1b, the particles surface plasmons couple and their resonance condition changes. These colorimetric detection reactions were initially developed with sensitivities around 1nM to 10nM.31, 37 Later work examined the limitations of these colorimetric nanoparticle aggregation detections, and determined the detection limit is ultimately a function of the relative concentration of nanoparticles to the concentration of DNA, and the size and optical cross section of the nanoparticles (among a few other factors).28 By using larger nanoparticles (~50nm) or a material with a higher optical cross section (i.e. silver) these colorimetric nanoparticle detection schemes have been optimized to reach sensitivities in the 50pM to 1nM range.28, 32, 38
Fig. 1.
(a) and (b) Illustrate the aggregation of silver and gold nanoparticles in the presence of target DNA. As the nanoparticles aggregate their surface plasmons couple, the resonance condition changes, and their characteristic optical peaks red shift. (c) 600 uL of gold nanoparticles, silver nanoparticles and a combination of both are shown, illustrating their optical properties. In the orange gold and silver solution each type of nanoparticle can be functionalized to react differently, allowing for either color change reaction to take place independently.
Additionally, a number of other nanoparticle based detection schemes exist, which use the same recognition reaction, but a different sensing mechanism. Examples include scanometric based detection in which gold nanoparticles bind to a surface and are then made visible through the deposition of silver on their surface,26, 39 bio-barcode based detection schemes where the DNA signal is amplified before a similar silver deposition,40 and simple spot-and-read tests where light from an illuminated glass slide is evanescently coupled into gold nanoparticles after aggregation.30 It is difficult to produce a single low limit of detection because of the number of techniques and targets which exist, but nanoparticle based colorimetric detection schemes that integrate waveguiding glass slides have been shown to go to detection limits as low as approximately 300fM,30 and bio-barcode techniques have been shown to reach as low as sub-attomolar detection limits.40–42 Recently, smartphone based technologies have also been combined with a number of colorimetric technologies, allowing for point-of-care detection and quantification of target levels using pre-existing technology43–44. One pertinent example includes the use of a gold-on-paper platform and a smartphone camera in order to detect DNA sequences from Mycobacterium tuberculosis, the cause of Tuberculosis45.
Here we present a solution to the differential diagnosis of KS and BA based on a colorimetric one-pot gold and silver nanoparticle system (Figure 1c). By combining these two oligonucleotide detection techniques in one solution we create a sysem that has two independent color change reactions depending on the DNA target present. We present both the visible color change associated with these detection reactions as well as the changes in the solutions optical spectrum and show the limit of detection of the system approaches single nanomolar concentrations. We demonstrate that our color change reactions have similar sensitivities to other aggregation reactions (~1nM), and that the two reactions do not interfere with each other. Because this multiplexed detection scheme can be carried out in one solution, it can later easily be integrated into a microfluidic device which solves the second challenge in KS detection, working with biopsy samples. Further, additional techniques, including illumination through an evanescently coupled glass slide, could later be utilized to further enhance our limit of detection.
Experimental Section
Primer Design and Selection
Oligonucleotide sequences were chosen for KSHV using BLAST Primer Design46 to determine short DNA sequences (~20BP) for DNA that codes for vCyclin, a KSHV protein known to express itself both during the latent and lytic viral phases.47 The fact that vCyclin is expressed both latently and lytically could later be useful, because direct detection of extracted RNA could provide an additional template for amplification. Bacillary angiomatosis, a bacterial infection, can be caused by two different species, Bartonella quintana and henselae48, and primers were designed to be specific to both agents. Briefly, the two bacteria genomes were compared to find conserved regions, a reference genome was created out of the conserved regions, and BLAST Primer Design was used to find oligonucleotides specific to these regions. A 15 base long polyadenine sequence was added to the 5’ end of the sequences, followed by an alkyl thiol group used to bind the oligonucleotides to gold particles. All oligonucleotides were ordered from Invitrogen (Grand Island, NY), and their sequence information can be found in Table 1.
Table 1.
Probe and Target Sequences for KSHV and BA
| Name | Sequence | TM(°C) 300mM NaCl |
|---|---|---|
| KSHV Probe 1 | AAAAAAAAAAAAAAAGCCAACGTCATTCCGCAGGAT | 76.1 |
| KSHV Probe 2 | AAAAAAAAAAAAAAAAGGCTGTGCGCTGTTGGTTCCT | 78.7 |
| KSHV Target | ATCCTGCGGAATGACGTTGGCAGGAACCAACAGCGCACAGCCT | 96.5 |
| Bartonella Probe 1 | AAAAAAAAAAAAAAACCAATCGGTGGAGACGG | 70.2 |
| Bartonella Probe 2 | AAAAAAAAAAAAAAACGCTGACCAAGAGCAGGA | 71.3 |
| Bartonella Target Sequence | CCGTCTCCACCGATTGGTCCTGCTCTTGGTCAGCG | 94.2 |
Gold and Silver Nanoparticle Functionalization
Gold and silver particles with average diameters of 15 and 20nm, respectively, were functionalized using thiol based chemistry using methods described by others 31–32, 37. These sizes were chosen as a compromise between larger particles which generally provide higher sensitivity38, and smaller particles which are generally easier to make stable in salt solutions. Briefly, 50 µL of 100 µM oligonucleotides with 5’ alkyl thiol groups was added to 1mL solutions of gold (3nM) and silver (750pM) nanoparticles in excess and allowed to react overnight. The solution was then brought to 10mM sodium phosphate and .01% sodium dodecyl sulfate (SDS), and again given 24 hr to react. This process was repeated, this time adding sodium chloride, resulting in final concentrations of 100mM, 200mM, and 300mM, each time with 24 hours in between. These increasing molarity salt solutions are used to screen electrostatic interactions between DNA strands, ultimately allowing for a higher density layer to be formed on the surface of the nanoparticles. After the final incubation period, solutions were spun down and resuspended in .01% SDS three times to remove excess oligonucleotides, and finally brought to 10mM Sodium Phosphate and 300mM Sodium chloride.
Melting Temperature Analysis
In previous literature Storhoff et al.37 and Thompson et al.32 have shown how gold and silver nanoparticle-based aggregation can have specificity high enough to determine single nucleotide mismatches between targets. A perfect and one nucleotide mismatched target have different melting temperatures, and by measuring what temperature the nanoparticles disassociate one can distinguish between the two. A similar disassociation temperature is determined here for a correct target for both nanoparticle systems, and further detection reactions are performed at a temperature just below this threshold to insure incorrect targets don’t cause any aggregation. KSHV and Bartonella DNA (10nM) sequences were added to solutions of conjugated gold and silver nanoparticles respectively, and the solutions were allowed 4 hr to aggregate. Then, the solutions were heated in 5 degree increments from 45°C to 95°C to determine at what temperature the nanoparticles disassociated.
KSHV and BA Detection and Sensitivity Measurements
Solutions of gold and silver nanoparticles were mixed to yield a final concentration of 1.5 nM gold nanoparticles and 325 pM silver nanoparticles. Due to silver’s higher absorption cross section, a lower concentration was used. Target and Control DNA were added at concentrations of 5nM and solutions were kept 2 hours at 65 °C to react before their absorbance measurements were recorded. Similarly, experiments were conducted to measure the limit of detection of the system. Different concentrations of DNA from 10pM to 1uM were added to 40 µL of both silver and gold independently to measure the sensitivity of each channel. Solutions were given 2 hr at 65°C to react, and their near UV and visible spectrums were collected.
Materials and Instrumentation
Spectrophotometric measurements were taken using a Spectramax plus 384 (Molecular Devices, Sunnyvale, CA) in the Nanobiotechnology Center at Cornell University. SEMs were taken on a Zeiss Ultra (Oberkochen, Germany) in the Cornell Center for Nanofabrication. Gold nanoparticles were purchased from Nanopartz (Loveland, CO). All other reagents were purchased from Sigma-Aldrich (St. Louis, MO).
Results and Discussion
Nanoparticle-Oligonucleotide Conjugation
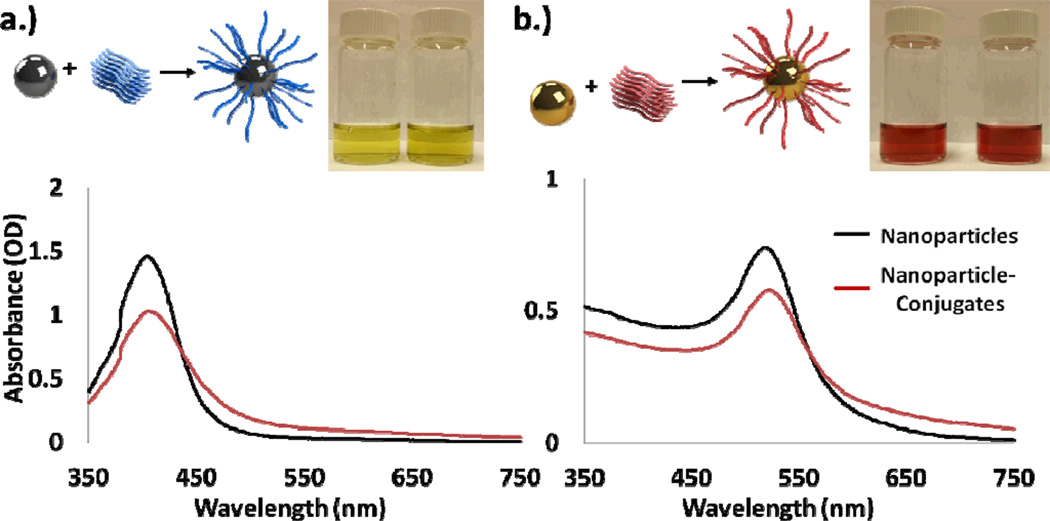
The attachment of oligonucleotides to gold and silver nanoparticles yielded homogenous stable solutions of nanoparticle conjugates the same color as the original solution. As in previous work by Storhoff et al. and Thompson et al., a small change of roughly 1 to 3 nm in nanoparticle resonance was observed in accordance with the nanoparticle conjugations, as shown in Figure 2.32, 37 Decreases in absorbance were also observed due to incomplete collection of nanoparticles during excess oligonucleotide removal. The final gold nanoparticle solutions were stable for greater than 1 month at room temperature, while the silver particles were stable for approximately two weeks. This difference in stability is likely attributed to the different reaction constants between gold and thiol and silver and thiol.
Fig. 2.
(a) Silver and (b) Gold Nanoparticles functionalized using thiolated oligonucleotides. After conjugation, both spectrums red shifted by approximately 1–3nm, as similarly reported in previous literature. The change in total absorption is mostly due to incompletely collection of the nanoparticles after conjugation. Silver and gold particles after conjugation are shown in the inset images respectively.
Melting Temperature Analysis
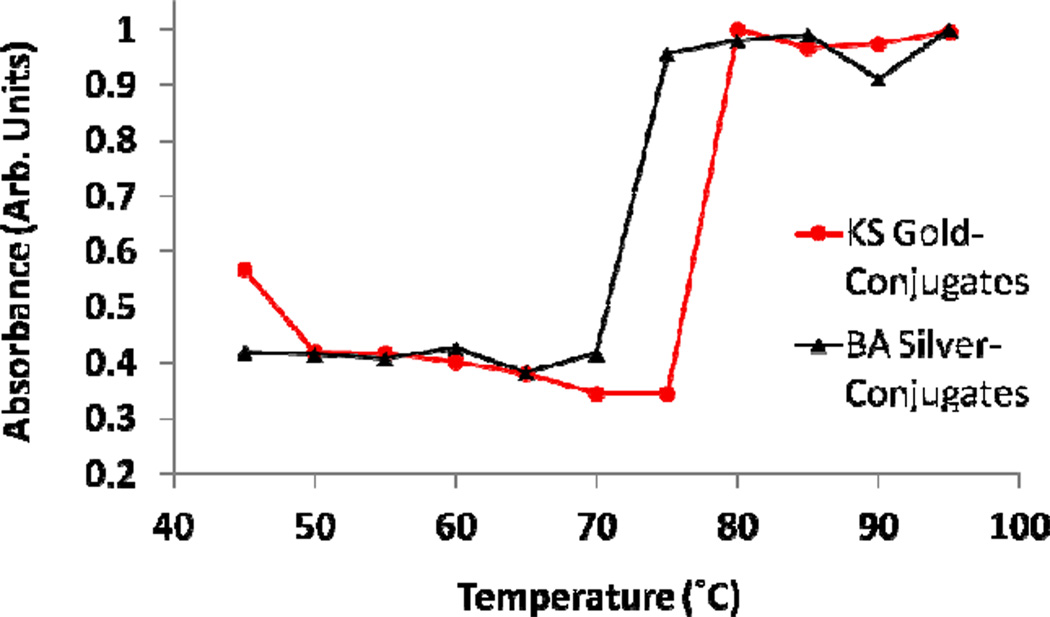
The results of the melting temperature analysis indicated that the KSHV functionalized nanoparticles disassociated between 75°C and 80 °C, and the Bartonella functionalized nanoparticles between 70 °C and 75°C, as shown in Figure 3. These results line up well with the expected melting temperatures of the oligonucleotide probes, which can be found in Table 1. Further, the lower melting temperature of the Bartonella probes agrees well with the length of the probes being 5 nucleotides shorter. These temperature results were used to choose 65 °C as the temperature that the detection and sensitivity experiments were conducted at to prevent nonspecific aggregation.
Fig. 3.
After allowing solutions of the nanoparticles to aggregate the temperature that they disassociated at was determined. For both the KS and BA a sharp increase in absorbance was seen at their melting temperatures, approximately 80 and 75 degrees, respectively.
Multiplexed KSHV and BA DNA Detection Experiments
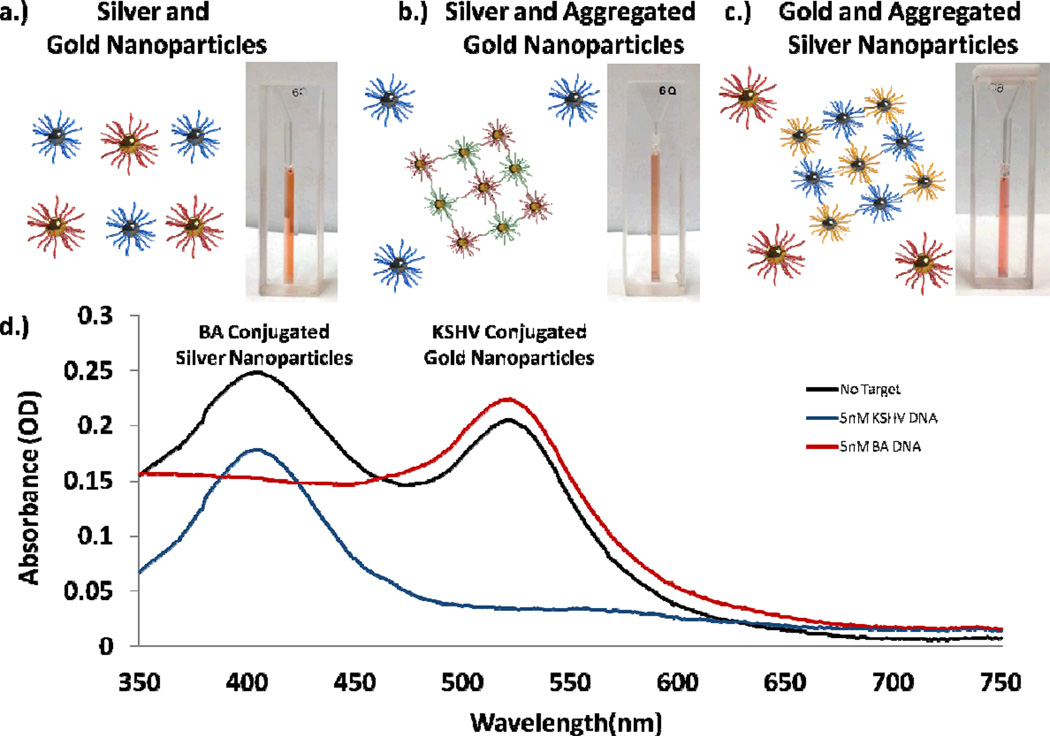
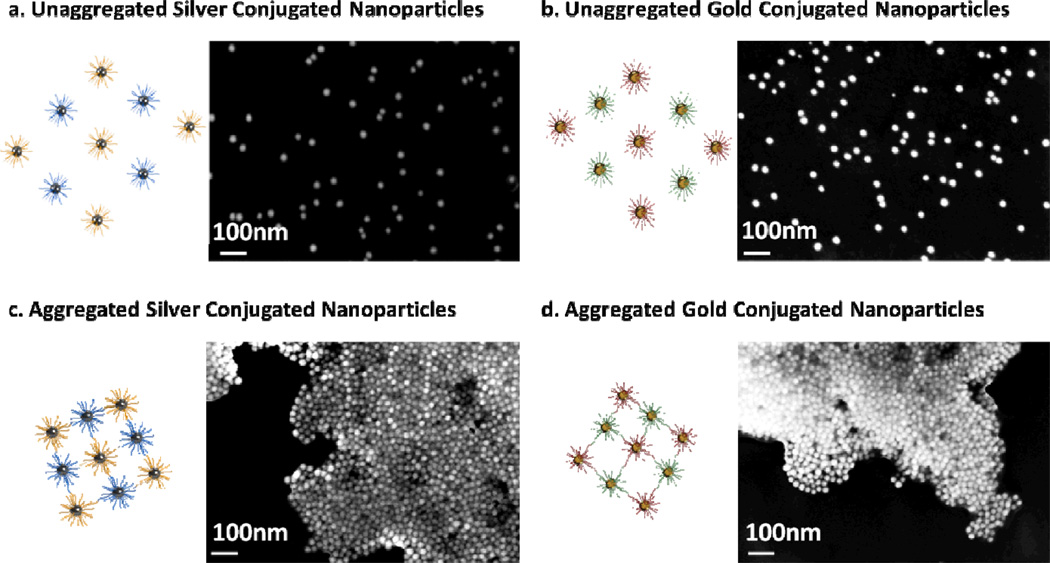
In experiments using both KSHV functionalized gold and Bartonella functionalized silver nanoparticles (Figure 4a), upon successful aggregation and detection of one target, the multiplexed solution displayed a color more similar to the non-aggregated solution. For example, when Bartonella target DNA (BA DNA) was introduced to the solution the silver nanoparticles aggregated and the solution turned to a pink color, more dependent on the surface plasmon characteristics of the unaggregated gold particles (Figure 4b). When KS DNA was introduced the gold nanoparticles aggregated and the solution changed to a murky yellow-orange color, more dependent on the silver nanoparticles (Figure 4c). Spectrophotometric analysis also revealed that only the wavelength resonant peak of the nanoparticle aggregate was affected by the detection of a single target (Figure 4d). A small change in the absorption at the non-target-corresponding resonant wavelength is observed due to a change in the corresponding resonant peak’s tail, but the resonant peaks wavelength did not change. Further, Scanning Electron Micrographs reveal that upon introduction of a target, an aggregation reaction does indeed occur (Figure 5). For the gold nanoparticles a color change could be visually observed as early as 30 minutes to 1 hour after addition of DNA and for the silver nanoparticles as early as one hour after the addition of target. Measuring the absorbance of the solutions we were able to see changes as soon as 10 to 20 minutes after the addition of target.
Fig. 4.
(a) A solution of conjugated gold and silver nanoparticles. (b) Upon introduction of KSHV DNA the gold particles aggregate and the solution turns darker orange. (c) Upon introduction of BA DNA the silver nanoparticles aggregate, and the solution becomes bright pink. (d) An optical spectrum illustrates the change in the nanoparticles resonance as they aggregate. All DNA solutions added in these experiments were 5nM.
Fig. 5.
Scanning electron micrographs of unaggregated oligonucleotide conjugated silver and gold nanoparticles on a silicon wafer. After the addition of target DNA the silver and gold nanoparticles form aggregates.
When gold nanoparticles and silver nanoparticles were mixed and stored together the silver nanoparticles would gradually and nonspecifically aggregate over the course of two to three days, even in the presence of no target. Presumably this aggregation was caused by a reaction between the thiol groups of the Bartonella probe DNA attached to the silver nanoparticles reacting with the gold nanoparticles because of thiol and gold’s greater reaction constant. However, over the time span of our reactions, no change was observed in the silver nanoparticles, allowing for multiplexed detection in one solution.
Sensitivity Experiments
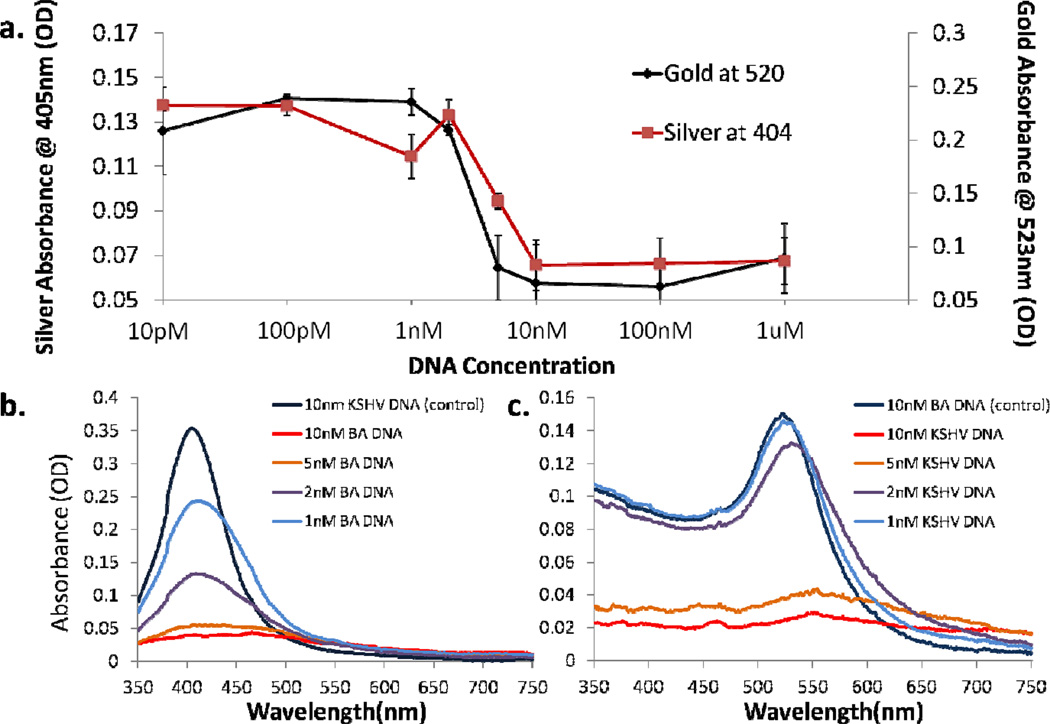
Detection reactions were carried out at various target DNA concentrations to determine the limit of detection of the system. Our results indicate that the limit of detection of the gold nanoparticles is approximately 2nM, and for the silver nanoparticles is approximately 1nM (Figure 6). The limit of detection of the silver nanoparticles is likely higher because their higher absorption cross section allows for a lower concentration of nanoparticles that can aggregate in the presence of less DNA. These results line up well with previous nanoparticle-based colorimetric detection, which shows limits of detection for gold around approximately 1nM, and for silver around approximately 100pM.32, 37
Fig. 6.
(a) Sensitivity of both gold and silver nanoparticles conjugates. A color change was observed for silver solutions at 1nM DNA, and for gold nanoparticles at 2nM. (b) and (c) show the absorbance of the two systems between 1nM and10nM, in the systems transition region. Note that this difference in sensitivity is likely because the silver nanoparticles are kept at a lower concentration while still providing a similar optical signal, a factor of the higher optical cross section of silver.
While these limits of detection are high for the detection of unamplified DNA, there are a number of techniques that we could later implement to allow our multiplexed system to directly detect extracted DNA. One example previously mentioned involves evanescently coupling light from illuminated glass slides into the nanoparticles to excite them as opposed to a broadband source. Storhoff et al. report a limit of detection of 300fM, demonstrating how this simple light source can provide an almost 1000 fold increase in sensitivity using the same nanoparticles30. Ultimately, they use their system to detect unamplified genomic DNA. A second technique which could be used to directly detect KSHVs presence involves detecting mRNA already transcribed from the genomic DNA. As explained previously vCyclin, is expressed both latently and lytically, and orders of magnitude more copies could be available for detection.
Conclusions
Here we have demonstrated a multiplexed colorimetric one-solution method of detecting KSHV and Bartonella DNA. We have shown that gold and silver nanoparticle conjugates can be used in one solution for colorimetric detection, and that both color change reactions can be seen independently of each other. Our results indicate that this sort of technique can be used to differentiate DNA from these two similarly presenting diseases with speeds on the same order of PCR based techniques (minutes to hours), and faster than immunohistochemistry based ones (hours to days).
In this work we demonstrate such a multiplexed detection using two targets, but it is possible to imagine that by using nanoparticles of other shapes, sizes, and materials, a multiplexed solution could be created capable of many colorimetric detection reactions for different targets. In addition to nanospheres like those used in this work, nano-rods49, prisms50–51, bipyramids52–53, and a number of other geometries54–56 exist with different SPR wavelengths. Depending on how much overlap is allowed between SPR peaks of different nanoparticles, anywhere from a handful to dozens of detections could be carried out within the width of the visible spectrum.
While improvements are still needed in order to detect unamplified DNA, the techniques here could be easily integrated into more complex microfluidic devices, forming diagnostics capable of solving both major challenges in KS diagnosis: disease differentiation and starting with a solid sample. While in this work our samples are most illustrative of a biopsy sample after significant processing, in future work the system could be built to accept biopsy samples directly. A number of possible solutions exist for increasing the sensitivity of colorimetric nanoparticle-based detection, including the previously mentioned examples of detecting amplified RNA targets, such as vCyclin RNA, or using evanescent coupling into the particles to measure only scattered light. Additionally, lower limit detection could be possible by using nanoparticles at concentrations that are not visible to bind to target DNA, and then concentrating any resulting aggregates using a microfluidic device.
Another interesting case where multiplexed colorimetric detection based on metal nanoparticles could be applied is the detection of HIV and syphilis in the developing world, a problem recently tackled by Chin et al.26 In this case, both diseases are treatable, but in pregnant women can become fatal to their children. Chin et al. develop a microfluidic ELISA chip to solve the problem and demonstrate amazing results with clinical samples. Here a multiplexed colorimetric solution could provide an easier readout in a similar device that could provide the patient with more confidence in the result.
Since therapeutics capable of controlling HIV, and thus in many cases KSHV, have been created the incidence rates of KS in the United States has decreased. However, in other areas of the world KSHV is still a major cause of cancer. Better diagnostics, potentially built utilizing the system described above, could be useful in diagnosing and allowing for subsequent treatment. The capability of multiplexed detections in one solution is particularly interesting in the case of differentiating between Kaposi’s sarcoma and bacillary angiomatosis, as well as pyogenic granuloma by exclusion, where added difficulties besides multiplexing will arise from having to extract a bioanalyte from solid samples. In this case because of the limited sample size single solution multiplexed detection has an important advantage.
Here we have demonstrated work towards creating such a detection reaction that could later be integrated into a diagnostic device. We have shown that it is capable of detecting multiple targets, and that its limit of detection falls in line with similar work, and could be enhanced further using other known techniques. In future work we hope to integrate the reaction with biopsy-based detection, and solve both challenges involved in KS diagnosis.
Acknowledgements
This work was funded in part by the Clinical and Translational Science Center under NIH grant UL1 RR 024996. M. Mancuso would like to acknowledge a National Science Foundation Graduate Research Fellowship under Grant No. DGE-0707428. This work was performed in part at the Cornell NanoScale Facility, a member of the National Nanotechnology Infrastructure Network, which is supported by the National Science Foundation (Grant ECS-0335765) and at the Nanobiotechnology Center (NBTC), an STC Program of the National Science Foundation under Agreement no. ECS-9876771.
Notes and References
- 1.Hymes KB, Cheung T, Greene JB, Prose NS, Marcus A, Ballard H, William DC, Laubenstein LJ. Lancet. 1981;2:598–600. doi: 10.1016/s0140-6736(81)92740-9. [DOI] [PubMed] [Google Scholar]
- 2.Friedman-Kien AE. J Am Acad Dermatol. 1981;5:468–471. doi: 10.1016/s0190-9622(81)80010-2. [DOI] [PubMed] [Google Scholar]
- 3.Pitchenik AE, Fischl MA, Dickinson GM, Becker DM, Fournier AM, O'Connell MT, Colton RM, Spira TJ. Ann Intern Med. 1983;98:277–284. doi: 10.7326/0003-4819-98-3-277. [DOI] [PubMed] [Google Scholar]
- 4.MMWR Morb Mortal Wkly Rep. 1982;31:294. 300-291. [Google Scholar]
- 5.Gallo RC, Sarin PS, Gelmann EP, Robert-Guroff M, Richardson E, Kalyanaraman VS, Mann D, Sidhu GD, Stahl RE, Zolla-Pazner S, Leibowitch J, Popovic M. Science. 1983;220:865–867. doi: 10.1126/science.6601823. [DOI] [PubMed] [Google Scholar]
- 6.Barre-Sinoussi F, Chermann JC, Rey F, Nugeyre MT, Chamaret S, Gruest J, Dauguet C, Axler-Blin C, Vezinet-Brun F, Rouzioux C, Rozenbaum W, Montagnier L. Science. 1983;220:868–871. doi: 10.1126/science.6189183. [DOI] [PubMed] [Google Scholar]
- 7.Chang Y, Cesarman E, Pessin MS, Lee F, Culpepper J, Knowles DM, Moore PS. Science. 1994;266:1865–1869. doi: 10.1126/science.7997879. [DOI] [PubMed] [Google Scholar]
- 8.Gallo RC. Science. 1998;282:1837–1839. doi: 10.1126/science.282.5395.1837. [DOI] [PubMed] [Google Scholar]
- 9.Nguyen HQ, Magaret AS, Kitahata MM, Van Rompaey SE, Wald A, Casper C. AIDS. 2008;22:937–945. doi: 10.1097/QAD.0b013e3282ff6275. [DOI] [PMC free article] [PubMed] [Google Scholar]
- 10.Eltom MA, Jemal A, Mbulaiteye SM, Devesa SS, Biggar RJ. J Natl Cancer Inst. 2002;94:1204–1210. doi: 10.1093/jnci/94.16.1204. [DOI] [PubMed] [Google Scholar]
- 11.Ferlay J, Shin HR, Bray FD, Mathers C, DM P. Cancer Incidence and Mortality Worldwide: IARC CancerBase No. 10 [Internet] 2011. [Accessed 11/15/2011]. [Google Scholar]
- 12.Jemal A, Bray F, Center MM, Ferlay J, Ward E, Forman D. CA: A Cancer Journal for Clinicians. 2011;61:69–90. doi: 10.3322/caac.20107. [DOI] [PubMed] [Google Scholar]
- 13.Mesri EA, Cesarman E, Boshoff C. Nat Rev Cancer. 2010;10:707–719. doi: 10.1038/nrc2888. [DOI] [PMC free article] [PubMed] [Google Scholar]
- 14.Butler LM, Dorsey G, Hladik W, Rosenthal PJ, Brander C, Neilands TB, Mbisa G, Whitby D, Kiepiela P, Mosam A, Mzolo S, Dollard SC, Martin JN. Journal of Infectious Diseases. 2009;200:430–438. doi: 10.1086/600103. [DOI] [PMC free article] [PubMed] [Google Scholar]
- 15.Minhas V, Crabtree KL, Chao A, M'soka TJ, Kankasa C, Bulterys M, Mitchell CD, Wood C. American Journal of Epidemiology. 2008;168:311–320. doi: 10.1093/aje/kwn125. [DOI] [PMC free article] [PubMed] [Google Scholar]
- 16.Martro E, Bulterys M, Stewart JA, Spira TJ, Cannon MJ, Thacher TD, Bruns R, Pellett PE, Dollard SC. J. Med. Virol. 2004;72:126–131. doi: 10.1002/jmv.10548. [DOI] [PubMed] [Google Scholar]
- 17.He J, Bhat G, Kankasa C, Chintu C, Mitchell C, Duan W, Wood C. J Infect Dis. 1998;178:1787–1790. doi: 10.1086/314512. [DOI] [PubMed] [Google Scholar]
- 18.Tappero JW, Koehler JE. New England Journal of Medicine. 1997;337:1888–1888. doi: 10.1056/NEJM199712253372605. [DOI] [PubMed] [Google Scholar]
- 19.Caldwell B, Kushner D, Young B. Journal of the American Podiatric Medical Association. 1996;86:260–262. doi: 10.7547/87507315-86-6-260. [DOI] [PubMed] [Google Scholar]
- 20.Berger Tg TJWKALPE. Archives of Dermatology. 1989;125:1543–1547. [PubMed] [Google Scholar]
- 21.Tappero JW, Conant MA, Wolfe SF, Berger TG. Journal of the American Academy of Dermatology. 1993;28:371–395. doi: 10.1016/0190-9622(93)70057-z. [DOI] [PubMed] [Google Scholar]
- 22.Arlett JL, Myers EB, Roukes ML. Nat Nano. 2011;6:203–215. doi: 10.1038/nnano.2011.44. [DOI] [PMC free article] [PubMed] [Google Scholar]
- 23.von Muhlen MG, Brault ND, Knudsen SM, Jiang S, Manalis SR. Analytical Chemistry. 2010;82:1905–1910. doi: 10.1021/ac9027356. [DOI] [PMC free article] [PubMed] [Google Scholar]
- 24.Zheng G, Gao XPA, Lieber CM. Nano Letters. 2010;10:3179–3183. doi: 10.1021/nl1020975. [DOI] [PMC free article] [PubMed] [Google Scholar]
- 25.Mandal S, Goddard JM, Erickson D. Lab on a Chip. 2009 doi: 10.1039/b907826f. [DOI] [PubMed] [Google Scholar]
- 26.Chin CD, Laksanasopin T, Cheung YK, Steinmiller D, Linder V, Parsa H, Wang J, Moore H, Rouse R, Umviligihozo G, Karita E, Mwambarangwe L, Braunstein SL, van de Wijgert J, Sahabo R, Justman JE, El-Sadr W, Sia SK. Nat Med. 2011;17:1015–1019. doi: 10.1038/nm.2408. [DOI] [PubMed] [Google Scholar]
- 27.Martinez AW, Phillips ST, Whitesides GM, Carrilho E. Analytical Chemistry. 2009;82:3–10. doi: 10.1021/ac9013989. [DOI] [PubMed] [Google Scholar]
- 28.Rosi NL, Mirkin CA. Chemical Reviews. 2005;105:1547–1562. doi: 10.1021/cr030067f. [DOI] [PubMed] [Google Scholar]
- 29.Yanik AA, Cetin AE, Huang M, Artar A, Mousavi SH, Khanikaev A, Connor JH, Shvets G, Altug H. Proceedings of the National Academy of Sciences. 2011 doi: 10.1073/pnas.1101910108. [DOI] [PMC free article] [PubMed] [Google Scholar]
- 30.Storhoff JJ, Lucas AD, Garimella V, Bao YP, Muller UR. Nat Biotech. 2004;22:883–887. doi: 10.1038/nbt977. [DOI] [PMC free article] [PubMed] [Google Scholar]
- 31.Elghanian R, Storhoff JJ, Mucic RC, Letsinger RL, Mirkin CA. Science. 1997;277:1078–1081. doi: 10.1126/science.277.5329.1078. [DOI] [PubMed] [Google Scholar]
- 32.Thompson DG, Enright A, Faulds K, Smith WE, Graham D. Analytical Chemistry. 2008;80:2805–2810. doi: 10.1021/ac702403w. [DOI] [PubMed] [Google Scholar]
- 33.Chen C-K, Huang C-C, Chang H-T. Biosensors and Bioelectronics. 2010;25:1922–1927. doi: 10.1016/j.bios.2010.01.005. [DOI] [PubMed] [Google Scholar]
- 34.Kalluri JR, Arbneshi T, Afrin Khan S, Neely A, Candice P, Varisli B, Washington M, McAfee S, Robinson B, Banerjee S, Singh AK, Senapati D, Ray PC. Angewandte Chemie. 2009;121:9848–9851. [Google Scholar]
- 35.Aslan K, Lakowicz JR, Geddes CD. Analytical Chemistry. 2005;77:2007–2014. doi: 10.1021/ac0484880. [DOI] [PMC free article] [PubMed] [Google Scholar]
- 36.Daniel WL, Han J-S, Lee MS, Mirkin CA. Journal of the American Chemical Society. 2009;131:6362–6363. doi: 10.1021/ja901609k. [DOI] [PubMed] [Google Scholar]
- 37.Storhoff JJ, Elghanian R, Mucic RC, Mirkin CA, Letsinger RL. Journal of the American Chemical Society. 1998;120:1959–1964. [Google Scholar]
- 38.Reynolds R, Mirkin CA, Letsinger RL. J. Am. Chem. Soc. 2000;122:3795–3796. [Google Scholar]
- 39.Taton TA, Mirkin CA, Letsinger RL. Science. 2000;289:1757–1760. doi: 10.1126/science.289.5485.1757. [DOI] [PubMed] [Google Scholar]
- 40.Nam J-M, Park S-J, Mirkin CA. Journal of the American Chemical Society. 2002;124:3820–3821. doi: 10.1021/ja0178766. [DOI] [PubMed] [Google Scholar]
- 41.Nam J-M, Thaxton CS, Mirkin CA. Science. 2003;301:1884–1886. doi: 10.1126/science.1088755. [DOI] [PubMed] [Google Scholar]
- 42.Hill HD, Mirkin CA. Nat. Protocols. 2006;1:324–336. doi: 10.1038/nprot.2006.51. [DOI] [PubMed] [Google Scholar]
- 43.Shen L, Hagen JA, Papautsky I. Lab on a Chip. 2012;12:4240–4243. doi: 10.1039/c2lc40741h. [DOI] [PubMed] [Google Scholar]
- 44.Mudanyali O, Dimitrov S, Sikora U, Padmanabhan S, Navruz I, Ozcan A. Lab on a Chip. 2012;12:2678–2686. doi: 10.1039/c2lc40235a. [DOI] [PMC free article] [PubMed] [Google Scholar]
- 45.Veigas B, Jacob JM, Costa MN, Santos DS, Viveiros M, Inacio J, Martins R, Barquinha P, Fortunato E, Baptista PV. Lab on a Chip. 2012;12:4802–4808. doi: 10.1039/c2lc40739f. [DOI] [PubMed] [Google Scholar]
- 46.Altschul SF, Madden TL, Schaffer AA, Zhang J, Zhang Z, Miller W, Lipman DJ. Nucleic Acids Res. 1997;25:3389–3402. doi: 10.1093/nar/25.17.3389. [DOI] [PMC free article] [PubMed] [Google Scholar]
- 47.Cai X, Lu S, Zhang Z, Gonzalez CM, Damania B, Cullen BR. Proc. Natl. Acad. Sci. U. S. A. 2005;102:5570–5575. doi: 10.1073/pnas.0408192102. [DOI] [PMC free article] [PubMed] [Google Scholar]
- 48.Koehler JE, Sanchez MA, Garrido CS, Whitfeld MJ, Chen FM, Berger TG, Rodriguez-Barradas MC, LeBoit PE, Tappero JW. New England Journal of Medicine. 1997;337:1876–1883. doi: 10.1056/NEJM199712253372603. [DOI] [PubMed] [Google Scholar]
- 49.Murphy CJ, Gole AM, Hunyadi SE, Orendorff CJ. Inorganic Chemistry. 2006;45:7544–7554. doi: 10.1021/ic0519382. [DOI] [PubMed] [Google Scholar]
- 50.Millstone JE, Métraux GS, Mirkin CA. Advanced Functional Materials. 2006;16:1209–1214. [Google Scholar]
- 51.Jin R, Cao Y, Mirkin CA, Kelly KL, Schatz GC, Zheng JG. Science. 2001;294:1901–1903. doi: 10.1126/science.1066541. [DOI] [PubMed] [Google Scholar]
- 52.Liu M, Guyot-Sionnest P. J Phys Chem B. 2005;109:22192–22200. doi: 10.1021/jp054808n. [DOI] [PubMed] [Google Scholar]
- 53.Zhang J, Li S, Wu J, Schatz GC, Mirkin CA. Angewandte Chemie International Edition. 2009;48:7787–7791. doi: 10.1002/anie.200903380. [DOI] [PMC free article] [PubMed] [Google Scholar]
- 54.Sun Y, Xia Y. Science. 2002;298:2176–2179. doi: 10.1126/science.1077229. [DOI] [PubMed] [Google Scholar]
- 55.Hao E, Kelly KL, Hupp JT, Schatz GC. J Am Chem Soc. 2002;124:15182–15183. doi: 10.1021/ja028336r. [DOI] [PubMed] [Google Scholar]
- 56.Zhou J, An J, Tang B, Xu S, Cao Y, Zhao B, Xu W, Chang J, Lombardi JR. Langmuir. 2008;24:10407–10413. doi: 10.1021/la800961j. [DOI] [PubMed] [Google Scholar]


