

Background: Phosphoinositides are involved in regulating TLR4 signaling.
Results: PIP5Kα knockdown in BV2 microglial cells inhibits LPS-induced inflammatory responses, PIP2 increase, and TIRAP translocation to the plasma membrane.
Conclusion: PIP5Kα-derived PIP2 facilitates TLR4-mediated microglial inflammatory responses through recruitment of TIRAP to the plasma membrane.
Significance: Regulation of PIP5Kα-dependent PIP2 pool may modulate TLR4-associated immune function in microglia.
Keywords: Inflammation; Mal TIRAP; Microglia; Phosphatidylinositol Kinase; Phosphoinositides; Toll-like Receptors (TLR); Phosphatidylinositol 4,5-Bisphosphate; Phosphatidylinositol 4-Phosphate 5-Kinase
Abstract
Phosphatidylinositol (PI) 4,5-bisphosphate (PIP2), generated by PI 4-phosphate 5-kinase (PIP5K), regulates many critical cellular events. PIP2 is also known to mediate plasma membrane localization of the Toll/IL-1 receptor domain-containing adaptor protein (TIRAP), required for the MyD88-dependent Toll-like receptor (TLR) 4 signaling pathway. Microglia are the primary immune competent cells in brain tissue, and TLR4 is important for microglial activation. However, a functional role for PIP5K and PIP2 in TLR4-dependent microglial activation remains unclear. Here, we knocked down PIP5Kα, a PIP5K isoform, in a BV2 microglial cell line using stable expression of lentiviral shRNA constructs or siRNA transfection. PIP5Kα knockdown significantly suppressed induction of inflammatory mediators, including IL-6, IL-1β, and nitric oxide, by lipopolysaccharide. PIP5Kα knockdown also attenuated signaling events downstream of TLR4 activation, including p38 MAPK and JNK phosphorylation, NF-κB p65 nuclear translocation, and IκB-α degradation. Complementation of the PIP5Kα knockdown cells with wild type but not kinase-dead PIP5Kα effectively restored the LPS-mediated inflammatory response. We found that PIP5Kα and TIRAP colocalized at the cell surface and interacted with each other, whereas kinase-dead PIP5Kα rendered TIRAP soluble. Furthermore, in LPS-stimulated control cells, plasma membrane PIP2 increased and subsequently declined, and TIRAP underwent bi-directional translocation between the membrane and cytosol, which temporally correlated with the changes in PIP2. In contrast, PIP5Kα knockdown that reduced PIP2 levels disrupted TIRAP membrane targeting by LPS. Together, our results suggest that PIP5Kα promotes TLR4-associated microglial inflammation by mediating PIP2-dependent recruitment of TIRAP to the plasma membrane.
Introduction
Microglia are the resident macrophages enriched in brain tissue that play essential roles in immune surveillance of the central nervous system (1, 2). Under various pathological conditions, such as brain injury and viral infection, these cells activate immune responses, producing soluble factors, including pro- and anti-inflammatory cytokines, reactive oxygen species, and nitric oxide (3, 4). Many signaling proteins, including MAPK family members, NADPH oxidase, and inducible nitric-oxide synthase (iNOS),3 as well as transcription factors such as nuclear factor-κB (NF-κB), are involved in the generation of the inflammatory mediators (5). Toll-like receptors (TLRs) function as primary transducers of the innate immune system against a wide range of invading microorganisms by recognizing their molecular patterns and triggering immune responses (6). Most TLRs are expressed in microglial cells and engage in inflammatory responses (7, 8). In particular, microglia activation by lipopolysaccharide (LPS), a ligand for TLR4, has been extensively studied (9–11).
TLR4 signaling is mediated by distinct recruitment of intracellular adaptor proteins containing the Toll/IL-1 receptor (TIR) domain to the cytoplasmic TIR domain of the receptor (12). The adaptor proteins include myeloid differentiation factor 88 (MyD88), TIR domain-containing adaptor protein (TIRAP, also called MyD88 adaptor-like), TIR domain-containing adaptor inducing IFN-β (TRIF), and TRIF-related adaptor molecule (TRAM). Among TLRs, only TLR4 uses all of these adaptor molecules and transmits immune signals through MyD88-dependent and -independent pathways (13). Ligation of TLR4 with LPS induces its dimerization and association with TIRAP and MyD88 in the plasma membrane (14–16). Activation of this pathway is mediated via multiple signaling cascades including IL-1 receptor-associated kinase 4 (IRAK4), IRAK1, TNF receptor-associated factor 6, inhibitor of κB (IκB), and IκB kinase (13). IκB is phosphorylated by IκB kinase and undergoes ubiquitination and proteosomal degradation, which leads to NF-κB activation and subsequent production of pro-inflammatory cytokines, such as IL-6 (13, 17). Next, activated TLR4 is internalized into early endosomes from the plasma membrane in a dynamin-dependent manner (18, 19). The endocytosed TLR4 utilizes TRAM and TRIF and induces transcriptional activation of interferon regulatory factor-3, causing production of type I IFN (20–22).
TIRAP and TRAM have been shown to bind membrane phosphoinositides, the phosphorylated derivatives of phosphatidylinositol (PI), with a broad range of binding affinities (19, 23). These lipid-protein interactions affect subcellular localization and function of the two adaptors in sequentially activated TLR4 signaling pathways. In particular, TIRAP has a higher affinity for PI 4,5-bisphosphate (PIP2) and localizes to the plasma membrane due to the interaction of its NH2-terminal 15–35 amino acid residues with PIP2 (23). Notably, TIRAP mutants that do not bind PIP2 fail to induce IL-6 production by LPS in macrophages, demonstrating a critical role of PIP2 in TIRAP-dependent TLR4 signal transduction (23). The major pathway of PIP2 synthesis in mammalian cells is phosphorylation of PI 4-phosphate by the type I PI 4-phosphate 5-kinase (PIP5K) family members including PIP5Kα, PIP5Kβ, and PIP5Kγ isoforms (24–26). However, which isoform of PIP5K is responsible for TIRAP regulation has yet to be determined.
PIP2 is relatively abundant in the plasma membrane, where this lipid critically regulates many physiological events, including phagocytosis, receptor endocytosis, lipid-mediated cell signaling, and actin cytoskeletal reorganization (25, 27–31). One explanation for such important regulatory functions of PIP2 is that it interacts with cytosolic proteins and recruits them to the plasma membrane. In fact, diverse cytosolic proteins involved in membrane events express PIP2 recognition domains, including pleckstrin homology and phox homology domains (32). Generally, the PIP2 concentration remains low under resting conditions but can be increased via PIP5K by various extracellular stimuli, such as growth factors (33, 34). Thus, the molecular aspects of PIP5K-driven PIP2 formation in specific circumstances have become the subject of much research interest (35, 36). Previously, we found enhanced expression of PIP5Kα, an isoform of PIP5K, and increased PIP2 in LPS-stimulated BV2 microglial cells and rat primary microglia, implying a functional role of PIP5Kα in microglial activation (37). In this study, we have addressed the details of direct regulatory effects of PIP5Kα-mediated PIP2 production on TIRAP localization and TLR4-mediated inflammatory responses in microglia. Here, we present evidence that PIP5Kα positively regulates TLR4-mediated microglial inflammation by recruiting TIRAP to the plasma membrane.
EXPERIMENTAL PROCEDURES
Reagents and Antibodies
Most chemicals, including LPS (a serotype of Salmonella enterica), DMEM, BSA, puromycin, Polybrene, paraformaldehyde, poly-l-ornithine, Griess reagent, staurosporine, anti-FLAG M2 affinity gels, a rabbit polyclonal antibody (pAb) to PIP5Kγ, and mouse monoclonal antibodies (mAbs) to α-tubulin and FLAG, were purchased from Sigma. FBS and penicillin/streptomycin were obtained from Hyclone (Logan, UT). Goat pAbs to PIP5Kα, PIP5Kβ, and β-actin were obtained from Santa Cruz Biotechnology (Santa Cruz, CA). Rabbit pAbs to Akt, phospho-Akt (Ser-473), p42/44 MAPK, phospho-p42/44 MAPK (Thr-202/Tyr-204), p38 MAPK, phospho-p38 MAPK (Thr-180/Tyr-182), JNK, phospho-JNK (Thr-183/Ty-r185), caspase 3, and poly(ADP-ribose) polymerase, as well as rabbit mAbs to NF-κB p65 and phospho-NF-κB p65 (Ser-536), and a mouse IκB-α mAb were purchased from Cell Signaling Technology (Beverly, MA). A rabbit pAb to iNOS and a mouse mAb to HA were obtained from Upstate Biotechnology (Lake Placid, NY) and Covance (Richmond, CA), respectively. A mouse IgM mAb to PIP2 was from Echelon Biosciences (Salt Lake City, UT). Rabbit pAbs to TIRAP were purchased from Abcam (Cambridge, MA) and Abnova (Taipei, Taiwan). Lipofectamine 2000, Lipofectamine RNAiMAX, Opti-MEM I, goat serum, Hoechst 33342, and Alexa Fluor-conjugated secondary antibodies were purchased from Invitrogen.
Expression Constructs
FLAG- or monomeric red fluorescent protein (mRFP)-tagged mouse PIP5Kα was described previously (37). HA-tagged mouse PIP5Kα was provided by Volker Haucke (Freie Universität Berlin, Germany). A kinase-dead mutant of human PIP5Kα (D309N and R427Q) was provided by Richard Anderson (University of Wisconsin, Madison), and the PIP5Kα insert was cut and ligated into the SacI-EcoRI sites of the pEGFP-C2 vector. Mouse type I PIP5Ks cloned into pcDNA3-Myc vector were used as DNA templates for quantitative real time PCR (qRT-PCR) analysis. The YFP-tagged tubby mutant (R332H) was provided by Andrew Tinker (University College London, UK) (38), and TIRAP-GFP and HA-TIRAP were gifts from Ruslan Medzhitov (Yale University). PCR-amplified inserts of Tubby or TIRAP were subcloned into the EcoRI-XhoI sites of the mRFP-pcDNA3 vector to generate mRFP-Tubby-R332H and mRFP-TIRAP. The recombinant plasmids were confirmed by DNA sequencing (Genotech, Daejeon, Korea). FLAG-MyD88 was purchased from Addgene (plasmid 13093). The reporter plasmids of thymidine kinase promoter-Renilla luciferase (pRL-TK) and 5×NF-κB-luciferase (pNF-κB-Luc) were gifts from Eun-hye Joe (Ajou University, Korea) (39). HA-endophilin 1 and FLAG-PICK1 (protein interacting with protein kinase C 1) were gifts from Pietro De Camilli (Yale University) and Young Ho Suh (Ajou University), respectively. All plasmids were purified using an EndoFree plasmid maxi kit (Qiagen, Hilden, Germany).
PIP5Kα Knockdown (KD)
Five MISSION shRNA clones of mouse PIP5Kα (NM_008847.2; a protein of 546 amino acids) inserted into pLKO.1 vector (TRCN0000024514 to TRCN0000024518) were purchased from Sigma. A nontarget (NT) shRNA sequence cloned into the pLKO.1 vector was included as a control. Each pLKO.1 shRNA construct was cotransfected with the Mission Lentiviral Packaging Mix (Sigma) into HEK293TN cells (System Biosciences, Mountain View, CA) using FuGENE 6 (Roche Applied Science), and pseudo-lentiviral particles were produced according to the manufacturer's instructions. BV2 cells were infected with the recombinant lentiviruses in the presence of Polybrene (8.0 μg/ml) for 2 days and then cultured with fresh complete media containing puromycin (2.0 μg/ml) for 3–4 weeks to select PIP5Kα KD cells. PIP5Kα expression level was routinely tested by Western blot and qRT-PCR analyses. BV2 cells stably expressing the PIP5Kα shRNA targeting the sequence CCATTACAATGACTTTCGATT (TRCN0000024515, referred to as shRNA-15) or GCCTCTGTCATGCCTGTTAAA (TRCN0000024517, referred to as shRNA-17) were chosen for further experiments. In the case of siRNA-mediated PIP5Kα KD, a pool of three PIP5Kα siRNAs or control siRNA (Santa Cruz Biotechnology) was mixed with Lipofectamine RNAiMAX in Opti-MEM I media according to the supplier's protocol. BV2 cells and RAW264.7 cells were incubated with the complexes (final concentration of siRNA = 20 nm) for 48 h.
Cell Culture and LPS Treatment
RAW264.7 (a mouse macrophage cell line), HEK293T, and HeLa cells were grown in DMEM supplemented with 10% FBS and penicillin/streptomycin. PIP5Kα KD BV2 cells were grown in DMEM supplemented with 5% FBS and antibiotics at 37 °C in a humidified atmosphere of 5% CO2 and 95% air and were routinely subcultured every day at a split ratio of 1:3 (37). For sample preparations, equal numbers of control and PIP5Kα KD cells were plated into culture dishes at a density of ∼5 × 10⁴ cells/cm2 overnight and treated with LPS (100 ng/ml) under the indicated conditions. RAW264.7 cells were treated with LPS in a similar manner.
Western Blot Analyses
Cells were harvested in cold lysis buffer (50 mm Tris, pH 7.4, 150 mm NaCl, 1 mm EDTA, 1 mm EGTA, 1 mm DTT, 1 mm Na3VO4, 5 mm NaF, and 1% Triton X-100) containing protease inhibitor mixture tablets (Roche Applied Science) and solubilized on ice for 5 min. After clearance by centrifugation (15,000 × g, 20 min, 4 °C), the protein concentration of the cell lysates was determined using bicinchoninic acid protein assay reagents (Pierce). Equal amounts of proteins in Laemmli sample buffer were loaded onto resolving gels, separated by SDS-PAGE, and transferred to nitrocellulose membranes (Schleicher & Schuell). Following blocking with 5% nonfat milk in TBS containing 0.1% Tween 20 (TBST), membrane blots were incubated with the corresponding primary antibodies for 2 h at room temperature or overnight at 4 °C, washed three times with TBST, and further incubated with HRP-conjugated secondary antibodies (Zymed Laboratories Inc.). The resulting immune complexes were detected using SuperSignal West Pico chemiluminescent substrate (Pierce). Band intensities of Western blots were measured using NIH ImageJ software (National Institutes of Health, Bethesda, MD).
qRT-PCR Analysis
Total RNA was purified with a TRIzol lysis reagent (Invitrogen), and cDNA was synthesized from 1 μg of mRNA using avian myeloblastosis virus reverse transcriptase (Takara, Japan) according to the manufacturer's instructions. qRT-PCR was performed on a Rotor-Gene 6000 thermocycler (Corbett Research, Sydney, Australia) using a KAPA SYBR FAST Universal 2× qRT-PCR Master Mix (Kapa Biosystems, Woburn, MA) according to the manufacturer's protocols. The following specific primers (Bioneer Daejeon, Korea) were used: sense, 5′-CTTGCCTCGGTCAGTCAAAA-3′, and antisense, 5′-AGCATCCAAAAATAGGCCGT-3′ for PIP5Kα; sense, 5′-AAAACGTGCCTGATGCAAAG-3′, and antisense, 5′-TGCCCATGAATAGAAGCAGC-3′ for PIP5Kβ; sense, 5′-CGTGCTCATGCAGGACTTCT-3′, and antisense, 5′-AGTAGCGGAAGGCAACAGGT-3′ for PIP5Kγ; sense, 5′-TCCTGTGTAATGAAAGACGGC-3′, and antisense, 5′-ACTCCACTTTGCTCTTGACTTC-3′ for IL-1β; sense, 5′-CCTTCCTACCCCAATTTCCA-3′, and antisense, 5′-CGCACTAGGTTTGCCGAGTA-3′ for IL-6; sense, 5′-CTTCTGTCTACTGAACTTCGGG-3′, and antisense, 5′-CAGGCTTGTCACTCGAATTTTG-3′ for TNFα; and sense, 5′-GCCTTCCGTGTTCCTACC-3′, and antisense, 5′-CCTCAGTGTAGCCCAAGATG-3′ for GAPDH. PCR parameters were as follows: 1 cycle of 95 °C for 2 min, followed by 40 cycles each, including three steps, 95 °C for 3 s, 55 °C for 15 s, and 72 °C for 15 s. Generation of a single gene-specific PCR product was confirmed by melting curve analyses. All PCR samples were prepared in triplicate for each gene. Cycle threshold (Ct) values were calculated for each gene and normalized to those of GAPDH (a housekeeping gene). The relative mRNA expression levels were determined by the 2−ΔΔCt method using Rotor-Gene 6000 software.
Cytokine ELISA
Cells were seeded in 35-mm dishes (5 × 10⁵ cells per dish) overnight and treated with LPS for the indicated times. Collected culture media (2 ml) were cleared by centrifugation, and aliquots (100 μl) of the media were assayed for mouse IL-6 and TNFα production. Amounts of each cytokine were quantified using respective OptEIA ELISA set (BD Biosciences) following the manufacturer's protocol.
NF-κB EMSA
Nuclear extracts were prepared from cells treated with LPS using a nuclear Extraction kit (Panomics) and measured for protein concentration with a DC protein assay kit (Bio-Rad) according to the manufacturers' protocols. Electrophoretic mobility shift of NF-κB was assayed using the NF-κB EMSA kit (Panomics) following the manufacturer's instructions. In brief, nuclear extracts (5 μg) were incubated with 10 ng of a biotin-labeled NF-κB oligonucleotide probe (AGTTGAGGGGACTTTCCCAGGC) for 30 min at 15 °C in a thermal cycler. The samples were separated on a 6% nondenaturing polyacrylamide gel and transferred to Biodyne B nylon membrane (Pall Life Sciences). After blocking, the membranes were blotted with streptavidin-HRP, and the resulting probe and NF-κB complexes were detected by chemiluminescent signal.
Nitric Oxide Measurement
Nitrite concentration in culture media supernatants was determined as an index of nitric oxide production as described previously (40). Culture media (0.5 ml) were collected from cells in 24-well plates and quickly spun down. Aliquots (50 μl) of media were mixed with an equal volume of Griess reagent in 96-well plates and incubated for 5 min at room temperature. Absorbance at 540 nm was measured using a microplate reader, and values were calculated over the linear range of a sodium nitrite standard curve.
Luciferase Reporter Assay
Cells were seeded in 6-well plates overnight and transfected with pNF-κB-Luc reporter (2.0 μg) diluted in Opti-MEM I media with Lipofectamine 2000 according to the supplier's protocol. pRL-TK reporter (0.2 μg) was cotransfected for 24 h to normalize transfection efficiency. After LPS stimulation, luciferase activities were measured with a Dual-Luciferase reporter assay system kit (Promega) according to the manufacturer's protocol.
Transfection and Cell Imaging
HEK293T cells were plated onto 18-mm circular coverslips coated with poly-l-ornithine ∼16 h prior to transfection. PIP5Kα expression constructs, together with Tubby, TIRAP, or MyD88, were mixed with Lipofectamine 2000 in Opti-MEM I and added to the cells. Similarly, PIP5Kα KD BV2 cells were transiently transfected with TIRAP-GFP. Twenty four hours post-transfection, cells were washed twice with 0.22-μm filtered PBS and fixed with 4% paraformaldehyde for 20 min at ambient temperature. GFP-, YFP-, or mRFP-tagged proteins were visualized by confocal microscopy as described under “Results.”
Immunocytochemistry
PIP5Kα KD BV2 cells were cultured overnight on 18-mm circular coverslips coated with poly-l-ornithine and then stimulated with LPS under the indicated conditions. After fixation as described above, cells were permeabilized with PBS containing 0.25% Triton X-100 for 15 min and blocked for 30 min with PBS containing 10% BSA and 10% goat serum. The inverted coverslips on impermeable Nesco film were stained for 1 h at 37 °C with the NF-κB p65 antibody (diluted 1:100 in the blocking buffer) in a humidified air-tight container, followed by staining for 30 min with Alexa Fluor 594-conjugated secondary antibody (1:200 dilution). Similarly, PIP2 was immunostained by sequential incubation with the PIP2 mouse IgM mAb (1:100 dilution), biotinylated goat anti-mouse IgM (1:500 dilution; Jackson ImmunoResearch Laboratories), and Alexa Fluor 594-conjugated streptavidin (1:500 dilution; Invitrogen) as described previously (37). Nuclei were stained with Hoechst 33342 diluted in PBS for 5 min. Cells were washed with PBS between each staining step, finally washed with distilled water, and then dried. Samples were mounted with Prolong Gold anti-fade reagent (Invitrogen). Likewise, HEK293T cells transfected with HA-PIP5Kα and FLAG-MyD88 were stained for 1 h with HA and FLAG (rabbit pAb, Affinity BioReagents) antibodies, followed by incubation for 1 h with Alexa Fluor 488-labeled mouse IgG and Alexa Fluor 594-labeled rabbit IgG antibodies, respectively.
Confocal Microscopy
All images were captured with a Zeiss LSM 510 confocal microscope. The settings were as follows: Plan-Apochromat 63× oil immersion objective lens was used with 405 nm diode laser at 10% output (for Hoechst 33342 excitation) and 543 nm He/Ne laser at 80% output (for PIP2 and NF-κB excitation), each of which was captured with band path 420–480-nm filter or long path 560-nm filter, respectively. The thickness of the optical slice (pinhole) was adjusted to 0.7 μm, and z-stacks were acquired at 50% overlap. When quantitative analyses were performed, the acquisition conditions related to detector sensitivity were maintained at the same level.
Immunoprecipitation
HEK293T cells were cotransfected with FLAG-PIP5Kα and HA-TIRAP for 24 h. Cell lysates (1.0 mg) were prepared as described above and were incubated for 4 h at 4 °C with 15 μl of anti-FLAG M2 affinity gel or 5 μg of the HA antibody. For HA-TIRAP affinity purification, the immune complex was incubated with 20 μl of protein G-agarose beads (Millipore) for an additional 2 h. Wild-type BV2 and HeLa cells were processed for PIP5Kα immunoprecipitation. After being precleared using 20 μl of protein G-Sepharose 4 Fast Flow beads (GE Healthcare), BV2 (1.4 mg) and HeLa (2.8 mg) cell lysates were incubated with 4 μg of anti-PIP5Kα antibody or normal goat IgG (Santa Cruz Biotechnology) overnight at 4 °C, and then were incubated with 30 μl of the protein G beads for additional 2 h. All immunoprecipitated samples were washed with cell lysis buffer five times and analyzed by SDS-PAGE and Western blotting.
PIP2 Measurement
PIP5Kα KD BV2 cells were plated in 60-mm dishes overnight before LPS stimulation. Lipid extraction samples containing PIP2 were prepared, and the amount of PIP2 was determined using the PIP2 mass ELISA kit (Echelon Biosciences) following the manufacturer's protocol. Absorbance at 450 nm was measured using a microplate reader, and PIP2 was quantified from a standard curve fitted by four-parameter nonlinear regression (SoftMax Pro, Molecular Devices).
Statistical Analyses
All experiments were performed independently at least three times with similar results. Data shown in the graphs are presented as the mean ± S.E. Statistical significance of data was determined using one-way analysis of variance with Tukey's multiple comparison test using Graphpad Software (San Diego).
RESULTS
PIP5Kα KD Suppresses LPS-induced Production of Inflammatory Mediators in Microglial Cells
Plasma membrane PIP2 is important for TIRAP- and MyD88-dependent TLR4 signaling pathway activation in macrophages (23). However, the relevant PIP5K that is responsible for PIP2 production is unknown. We evaluated relative abundance of the type I PIP5Kα, PIP5Kβ, and PIP5Kγ expressed in BV2 microglial cells according to a qRT-PCR standard curve method using known amounts of respective plasmid DNA templates and primer sets (Fig. 1A). Determination of mRNA abundance of each PIP5K isoform revealed that mRNA expression of PIP5Kα was higher than those of PIP5Kβ and PIP5Kγ (Fig. 1B). As a first step to investigate whether PIP5Kα might play a role in microglial TLR4 activation, we developed stable PIP5Kα KD cell lines of BV2 microglia. We used a lentiviral shRNA expression system and examined the effects of PIP5Kα KD on microglial inflammatory responses by LPS. PIP5Kα shRNA-15 and shRNA-17 significantly reduced PIP5Kα protein (Fig. 1, C and D) and mRNA (Fig. 1D) levels, as determined by Western blot and qRT-PCR analyses, respectively, compared with an NT shRNA as a negative control. PIP5Kβ and PIP5Kγ protein expression was unchanged with both PIP5Kα shRNAs (Fig. 1C), indicating the specificity of our KD constructs. PIP5Kα KD in BV2 microglial cells was also successfully achieved by transient transfection of siRNA. A pool of three independent siRNAs of PIP5Kα clearly reduced PIP5Kα protein and mRNA levels but not PIP5Kβ and PIP5Kγ protein levels (Fig. 1, E and F). We tested whether stable expression of NT shRNA or PIP5Kα shRNA-15 might induce apoptotic cell death by measuring cleavage of caspase 3 and poly(ADP-ribose) polymerase, which is generally considered as a marker of apoptosis, using Western blot analysis (Fig. 1G). As a control for this experiment, wild-type cells were treated with 1 μm staurosporine, a well known inducer of apoptosis, for 3 h. In contrast to the wild-type cells exposed to staurosporine, the shRNA-expressing cells did not significantly undergo apoptosis like the normal wild-type cells (Fig. 1G).
FIGURE 1.

Establishment of stable PIP5Kα KD in BV2 microglia. A, qRT-PCR standard curves of the respective PIP5K isoforms were determined using Myc-tagged mouse PIP5Kα, PIP5Kβ, and PIP5Kγ plasmids as DNA templates. qRT-PCRs were performed for serially diluted plasmids containing different DNA copy numbers. Measured Ct values were plotted in a linear logarithmic scale, and the formulas were automatically calculated using Rotor-Gene 6000 software. B, cDNA samples from wild-type BV2 cells were analyzed by qRT-PCR using the same primer sets, and Ct values of PIP5Ks were measured. The DNA copy numbers of each PIP5K were determined from the standard curves and normalized to the copy number of PIP5Kγ. **, p < 0.01. C and D, BV2 microglial cells were stably expressed with NT shRNA or PIP5Kα-specific shRNA-15 or shRNA-17 using lentiviral infection. E and F, BV2 cells were transiently transfected with control siRNA or a mixture of PIP5Kα-specific siRNAs. C and E, protein levels of PIP5Kα, PIP5Kβ, and PIP5Kγ were analyzed by Western blotting with their specific antibodies. α-Tubulin or β-actin was used as a loading control. D and F, PIP5Kα mRNA levels in PIP5Kα KD cells were measured by qRT-PCR analyses and quantified relative to those in the corresponding control cells. Changes in PIP5Kα protein expression in C and E, respectively, were quantified in the same manner. G, wild-type BV2 cells untreated or treated with 1 μm staurosporine for 3 h and BV2 cells stably expressing NT shRNA or PIP5Kα shRNA-15 were assayed for cleavage of poly(ADP-ribose) polymerase (PARP) and caspase 3. Cell lysates prepared from the indicated conditions were subject to Western blot analysis of both proteins. Arrows indicate intact and cleaved forms of them. α-Tubulin was included as a loading control.
We next examined whether PIP5Kα KD could influence transcriptional induction of representative pro-inflammatory cytokines by LPS. Although IL-6 and IL-1β mRNA levels were increased 1 and 3 h after LPS stimulation in control cells, they were significantly decreased in PIP5Kα shRNA-15 or shRNA-17 KD cells (Fig. 2A). Similarly, LPS-induced transcriptional activations of IL-6, IL-1β, and TNFα were much lower in PIP5Kα siRNA-treated cells than in control cells (Fig. 2B). We measured LPS-induced pro-inflammatory cytokines that were released into the culture media. IL-6 ELISA showed relatively low levels of IL-6 production 3 and 6 h after LPS stimulation in PIP5Kα KD cells compared with the corresponding control cells (Fig. 2C), which agreed with the changes in IL-6 mRNA levels (Fig. 2, A and B). Similarly, the remarkable TNFα production observed in control cells 3 h after LPS stimulation was diminished in PIP5Kα siRNA-treated cells (Fig. 2D). In PIP5Kα siRNA-treated RAW264.7 macrophage cells, PIP5Kα expression (Fig. 2E) and IL-6 production by LPS (Fig. 2F) were also decreased. Induction of iNOS expression, and the consequent increase in nitric oxide production, is a hallmark of chronic brain inflammation by activated microglia (41, 42). PIP5Kα shRNA-15 KD cells were less effective inducing iNOS protein expression (Fig. 2G) and nitric oxide production (Fig. 2H) after LPS stimulation overnight and for 24 h, respectively, compared with control cells. These results indicate that PIP5Kα can act as a positive regulator of TLR4-mediated inflammatory responses of microglial cells.
FIGURE 2.

Effect of PIP5Kα KD on LPS-induced cytokine and nitric oxide production. PIP5Kα KD BV2 cells by shRNA-15 (A, C, G, and H), shRNA-17 (A) or siRNA (B--D), PIP5Kα KD RAW264.7 cells by siRNA (E and F), and their corresponding control KD cells were treated with or without LPS (100 ng/ml) for the indicated times. A and B, mRNA levels of IL-6, IL-1β, or TNFα were measured by qRT-PCR analyses and quantified as fold induction over the levels in unstimulated control KD cells. All transcriptional levels were normalized to GAPDH mRNA levels and determined by the 2−ΔΔCt method. Cell culture media were collected, and amounts of IL-6 (C and F) and TNFα (D) released into the culture media were measured by ELISA. E, PIP5Kα protein expression was analyzed by Western blotting with anti-PIP5Kα antibody. G, after overnight incubation, iNOS protein levels were measured by Western blotting. iNOS protein expression was quantified as fold changes over the levels in unstimulated NT shRNA. α-Tubulin (E and G) was included as a loading control. H, concentration of nitrite converted from nitric oxide released into the culture media was determined using the Griess reagent 24 h after LPS stimulation. Values in the bar graphs are presented as mean ± S.E. **, p < 0.01; *, p < 0.05.
PIP5Kα KD Interferes with LPS-induced Activation of NF-κB Signaling
NF-κB is a major transcription factor mediating pro-inflammatory gene expression in the MyD88-dependent TLR4 signaling pathway (14–16, 43). Because PIP5Kα KD reduced LPS-mediated expression of inflammatory mediators, we examined possible alterations in NF-κB signaling by PIP5Kα KD in BV2 microglia. First, we analyzed IκB kinase β phosphorylation of the p65 subunit of NF-κB at Ser-536 as well as protein degradation of IκB-α, signal transduction events leading to NF-κB activation (17, 44, 45). Phospho-p65 was observed as early as 10–15 min after LPS stimulation in control cells, it but was barely detectable in PIP5Kα KD cells for up to 20 min after stimulation (Fig. 3, A and B). The IκB-α protein level declined rapidly within 15 min in LPS-stimulated control cells, but PIP5Kα shRNA-15 and shRNA-17 resulted in limited protein degradation during the 30-min period (Fig. 3C). Following IκB-α degradation, NF-κB is released from the physical restriction imposed by IκB-α and translocates to the nucleus. NF-κB p65 and nuclei were visualized by immunostaining and Hoechst 33342 staining, respectively. NF-κB p65 in control and PIP5Kα shRNA-15 KD cells remained mainly in the cytoplasm under basal (unstimulated) conditions (Fig. 3E). Upon LPS stimulation, nuclear translocation of NF-κB p65 occurred in control cells but was less significant in the PIP5Kα KD cells (Fig. 3E). PIP5Kα KD by siRNA also interfered with the LPS-induced NF-κB p65 phosphorylation and IκB-α degradation (Fig. 3D) and NF-κB p65 nuclear translocation (Fig. 3F) in RAW264.7 cells.
FIGURE 3.

Effect of PIP5Kα KD on LPS-induced activation and nuclear translocation of NF-κB. PIP5Kα KD BV2 cells by shRNA-15 (A, E, G, and H), shRNA-17 (A and C) or siRNA (B), PIP5Kα KD RAW264.7 cells by siRNA (D and F), and their corresponding control cells were treated with or without LPS (100 ng/ml) for the indicated times (A and C), 15 min (B) or 1 h (D--F). Protein levels of phosphorylated (P, Ser-536) and total (T) NF-κB p65 (A, B, and D) and IκB-α and α-tubulin (a loading control) (C and D) were measured by Western blot analyses. E and F, cells were immunostained with a primary antibody against NF-κB p65, followed by an Alexa Fluor 594-conjugated secondary antibody. The nuclei were visualized by Hoechst 33342 staining. Cell images were obtained using a confocal microscopy. Scale bars, 20 μm. G, nuclear extracts were prepared and processed for chemiluminescence-based NF-κB EMSA experiments. Nuclear extracts were incubated with a biotin-labeled NF-κB-specific oligonucleotide (10 ng) in the absence or presence of cold NF-κB-specific oligonucleotide (660 ng) and further probed with streptavidin-HRP. The arrow indicated shifted DNA probe for NF-κB. H, control (NT shRNA) and PIP5Kα shRNA-15 KD cells were cotransfected with a plasmid of 5×NF-κB-Luc reporter and a pRL-TK reporter and then treated with or without LPS (100 ng/ml) for 24 h. NF-κB activities were measured by luciferase assay, normalized to luciferase activities of pRL-TK, and quantified as fold changes over the control (unstimulated NT shRNA). Values in the bar graph are presented as mean ± S.E. **, p < 0.01; *, p < 0.05.
We next evaluated the DNA binding activity of NF-κB using a chemiluminescence-based EMSA experiment. Nuclear extracts were prepared 1 h after LPS stimulation from control and PIP5Kα shRNA-15 KD cells and compared for binding to a biotin-labeled DNA probe specific for NF-κB, resulting in a gel shift. The increase in DNA-protein complex formation was less prominent in the PIP5Kα KD cells (Fig. 3G). As expected, the presence of excess amounts of NF-κB cold (without biotin-labeled) probe blocked the binding of biotin-labeled DNA probe to NF-κB (Fig. 3G). Finally, we evaluated NF-κB transcriptional activity using luciferase reporter assays. pNF-κB-Luc containing five tandem repeats of a NF-κB consensus binding site, together with pRL-TK as a normalization control, were transiently expressed before LPS stimulation for 24 h. Measurements of luminescent intensity showed that PIP5Kα shRNA-15 KD exerted an inhibitory effect on LPS-induced NF-κB activation (Fig. 3H). Together, these results suggest that PIP5Kα is actively involved in the regulation of TLR4-mediated NF-κB signaling.
PIP5Kα KD Attenuates LPS-mediated Activation of p38 MAPK and JNK
Members of the MAPK family, such as p38 MAPK, p42/44 MAPK, and JNK, are important downstream effector molecules that participate in the MyD88-dependent TLR4 signaling, which can lead to NF-κB activation (14, 16, 43, 46). As NF-κB signaling pathways were inhibited by PIP5Kα KD (Fig. 3), we examined whether PIP5Kα shRNA-15 KD might also perturb MAPK signaling. We assessed activation of each MAPK by measuring their phosphorylated levels using Western blot analyses after LPS stimulation at different time points. Phosphorylation of p38 MAPK and JNK increased significantly in a time-dependent manner after 15 min of LPS stimulation in both control and PIP5Kα KD cells (Fig. 4, A–C). However, LPS-induced phosphorylation of both kinases was relatively attenuated in PIP5Kα KD cells after 30–60 min compared with control cells (Fig. 4, A–C). Treatment of RAW264.7 macrophages with PIP5Kα siRNA also decreased LPS-induced p38 MAPK and JNK phosphorylation (Fig. 4D). LPS slightly increased p42/44 MAPK phosphorylation for up to 30 min in control cells (Fig. 4A). In PIP5Kα KD cells, the phospho-p42/44 MAPK level was relatively high under basal conditions and modestly increased during the 60 min of LPS stimulation (Fig. 4A). We included the PI3K activation in these experiments because PI3K is also involved in the MyD88-dependent TLR4 signaling cascades (47, 48) by measuring phosphorylation of its downstream effector Akt. LPS stimulation rapidly increased phospho-Akt levels to maximal levels within 15 min, followed by dephosphorylation to the basal level within 60 min in control cells (Fig. 4A). The basal phospho-Akt level was higher in PIP5Kα KD cells than in control cells, somewhat similar to the phospho-p42/44 MAPK levels (Fig. 4A). However, differences in LPS-induced phosphorylation of p42/44 MAPK and Akt between control and PIP5Kα KD cells were less remarkable when compared with those of p38 MAPK and JNK. Together, these results suggest an engagement of PIP5Kα in TLR4-mediated activation of p38 MAPK and JNK.
FIGURE 4.
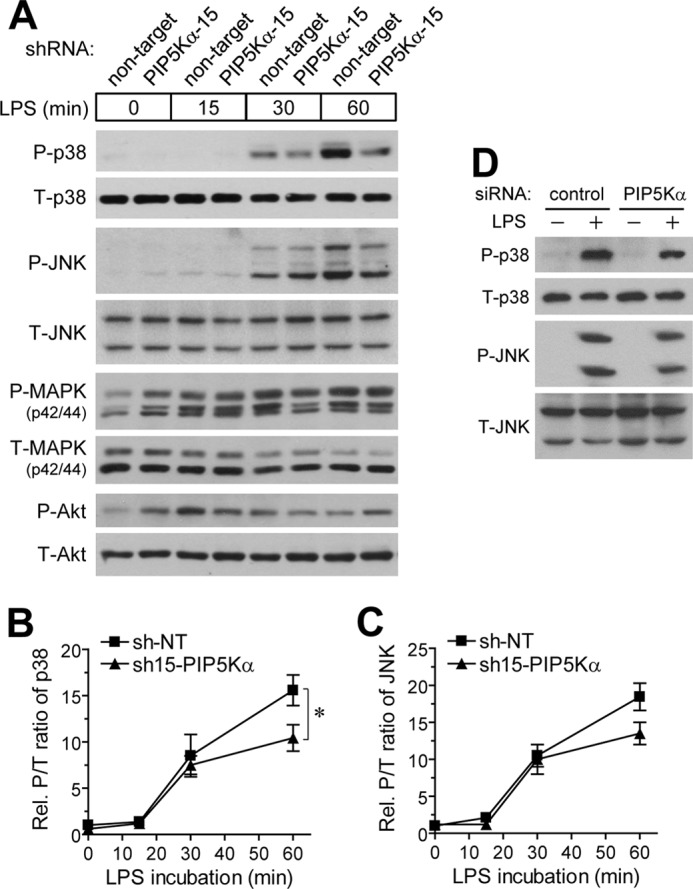
Effect of PIP5Kα KD on LPS-mediated phosphorylation of p38 and p42/44 MAPKs, JNK, and Akt. PIP5Kα shRNA-15 KD BV2 cells (A), PIP5Kα siRNA KD RAW264.7 cells (D), and their corresponding control cells were incubated in the presence and absence of LPS (100 ng/ml) for the indicated times (A) or 15 min (D). Cell lysates were analyzed for the phosphorylated (P) levels of p38 MAPK (Thr-180/Tyr-182), JNK (Thr-183/Tyr-185) (A and D), p42/44 MAPK (Thr-202/Tyr-204), and Akt (Ser-473) (A), and their total (T) levels by Western blotting with the respective specific antibodies. The P/T ratios of p38 MAPK (B) and JNK (C) in A were determined by measurements of band intensities of each protein kinase and quantified as fold changes over the control (NT shRNA at the zero time point). Values in the line graphs are presented as mean ± S.E. *, p < 0.05.
Complementation of PIP5Kα KD Cells with PIP5Kα Restores TLR4-mediated Inflammatory Responses to LPS in a PIP2-dependent Manner
Next, we examined whether adding PIP5Kα back to the PIP5Kα shRNA-15 KD cells could potentiate LPS-induced TLR4 signaling and inflammatory responses. To test this, we transiently transfected PIP5Kα shRNA-15 KD cells with empty vector or FLAG-PIP5Kα and measured changes in TLR4 downstream signaling events, in the absence or presence of LPS, by Western blot analyses. Overexpression of FLAG-PIP5Kα was confirmed by FLAG immunoreactivity (Fig. 5A). The magnitude of LPS-induced increased NF-κB p65, p38 MAPK, and JNK phosphorylation, as well as the degree of IκB-α degradation, was significantly higher in the FLAG-PIP5Kα-transfected cells than in vector-transfected control cells (Fig. 5, A and B). Consistent with these observations, ELISA measurements of IL-6 showed that upon LPS stimulation, FLAG-PIP5Kα-transfected cells produced greater amounts of IL-6 compared with vector-transfected cells (Fig. 5C).
FIGURE 5.

Effect of reconstituted wild-type or kinase-dead PIP5Kα expression in PIP5Kα KD cells on LPS-induced inflammatory responses. PIP5Kα shRNA-15 KD BV2 cells were transiently transfected with empty vector, FLAG-tagged wild-type (WT) PIP5Kα (A, C, D, F, I, and J), or a kinase-dead mutant (kd-mut) of PIP5Kα (D, F, I, and J) for 24 h and then treated with or without LPS (100 ng/ml) for 30 min (A and F), overnight (C), or 3 h (I and J). Overexpression of WT or kinase-dead mutant PIP5Kα was tested by Western blot analyses with anti-FLAG (A) or anti-PIP5Kα (D) antibody. A, protein levels of phosphorylated (P) and total (T) NF-κB p65, p38 MAPK, and JNK and of IκB-α and α-tubulin (a loading control) were measured by Western blot analyses. B, band intensities in the blots (A) were determined. The ratios of P/T NF-κB p65 and IκB-α/α-tubulin and the P/T ratios of p38 MAPK and JNK were quantified as fold changes over those in unstimulated vector condition and LPS-stimulated vector condition, respectively. C, concentration of IL-6 in the culture media was measured by ELISA. E, PIP5Kα shRNA-15 KD BV2 cells were transiently transfected with mRFP-PIP5Kα (wild-type) or GFP-PIP5Kα (kinase-dead) for 24 h. The fluorescent images were obtained using fluorescent microscopy for estimation of transection efficiency. Scale bar, 50 μm. IκB-α degradation (F and G) and NF-κB p65 phosphorylation (F and H) were assessed in the same manner as described in A and B. Transcriptional levels of IL-1β (I) and IL-6 (J) were measured by qRT-PCR analysis and quantified as fold induction over the levels in unstimulated vector condition. Values in the bar graphs are presented as mean ± S.E. *, p < 0.05.
We next addressed whether the PIP2-producing activity of PIP5Kα was involved in restoring NF-κB signaling and cytokine induction by LPS. For this, we compared the effect of a kinase-dead mutant (D309N and R427Q) of PIP5Kα that cannot synthesize PIP2 with wild-type PIP5Kα in functional rescue experiments (49). PIP5Kα shRNA-15 KD cells transiently transfected with either wild-type or kinase-dead PIP5Kα showed overexpression of their respective proteins at a similar level compared with the control vector-transfected cells, as confirmed by PIP5Kα immunoblotting (Fig. 5D). Wild-type (mRFP-tagged) or kinase-dead (GFP-tagged) PIP5Kα was transiently expressed in the PIP5Kα shRNA-15 KD cells for quantitatively evaluating the PIP5Kα reconstitution. Transfection efficiency, assessed by observing mRFP- or GFP-expressing cells, was determined to be ∼50–60% (Fig. 5E). Overexpression of the kinase-dead PIP5Kα had much less impact on IκB-α degradation (Fig. 5, F and G) and NF-κB p65 phosphorylation (Fig. 5, F and H) by LPS, compared with wild-type PIP5Kα. Likewise, LPS-induced increases in IL-1β and IL-6 transcription were potentiated in the PIP5Kα KD cells complemented with wild-type PIP5Kα but were not significantly restored by the kinase-dead PIP5Kα (Fig. 5, I and J). These results suggest that PIP5Kα-driven PIP2 production is required for activation of TLR4-mediated inflammatory responses.
PIP5Kα Mediates Recruitment of TIRAP to the Plasma Membrane through PIP2 Production and Colocalizes and Interacts with TIRAP
We sought to delineate the molecular mechanisms by which PIP5Kα and its product PIP2 facilitated LPS-induced microglial inflammation. PIP2-mediated plasma membrane targeting of TIRAP is necessary for MyD88-dependent TLR4 signaling pathways (23). Thus, we asked whether PIP5Kα-derived PIP2 could induce plasma membrane localization of TIRAP. To test this, we transfected HEK293T cells with fluorescent protein- tagged constructs and visualized their expression and localization by confocal microscopy. First, changes in PIP2 levels resulting from transfection of wild-type (mRFP-tagged) or kinase-dead (GFP-tagged) PIP5Kα were assessed by cotransfected YFP- or mRFP-tagged tubby mutant (R332H), respectively, as a specific probe for PIP2. Tubby selectively binds plasma membrane PIP2 and undergoes membrane-to-cytosol translocation according to alterations in lipid concentration (38, 50, 51). The tubby mutant was previously demonstrated to reflect such PIP2 changes more sensitively (38). As expected, the Tubby protein localized exclusively to the plasma membrane and cytoplasm in the wild-type and kinase-dead PIP5Kα-expressing cells, respectively, confirming the difference in their PIP2-producing activities (Fig. 6A). TIRAP-GFP coexpressed with wild-type PIP5Kα showed prominent plasma membrane localization. However, in contrast, mRFP-TIRAP coexpressed with kinase-dead PIP5Kα showed more cytoplasmic localization (Fig. 6B). These observations support that PIP2 produced by PIP5Kα induces TIRAP membrane translocation.
FIGURE 6.

Effect of PIP5Kα activity on plasma membrane targeting of TIRAP and their colocalization and interaction. HEK293T cells were transfected for 24 h with mRFP-tagged wild-type (WT) PIP5Kα or GFP-tagged kinase-dead mutant (kd-mut) of PIP5Kα (A and B) together with YFP- or mRFP-tagged tubby R332H (A) or with GFP- or mRFP-tagged TIRAP (B), as indicated in the cell images. After fixation, fluorescent fusion proteins were visualized under the corresponding channels. C, HA-PIP5Kα WT or GFP-PIP5Kα kinase-dead mutant was coexpressed with FLAG-MyD88 in HEK293T cells for 24 h. Cells were immunostained with HA and/or FLAG antibodies, followed by Alexa Fluor 488- and 594-labeled secondary antibodies, respectively. A–C, the fluorescent images were obtained using confocal microscopy. Scale bars, 20 μm. D and E, HEK293T cells were transfected for 24 h with FLAG-PIP5Kα and/or HA-TIRAP as indicated. Cell lysates were immunoprecipitated (IP) using anti-FLAG antibody-conjugated beads (D) or using anti-HA antibody and protein G-agarose beads (E). As a negative control, HA-tagged endophilin 1 (Endo1) (D) and FLAG-tagged PICK1 (E) were cotransfected with FLAG-PIP5Kα and HA-TIRAP, respectively. Then the immunoprecipitates (IP) and starting lysates (input) were analyzed by Western blotting with anti-FLAG and anti-HA antibodies. The arrow in E indicated IgG heavy chain. Precleared wild-type BV2 (F) and HeLa (G) cell lysates were subject to immunoprecipitation with anti-PIP5Kα antibody or normal goat IgG. The resulting immunoprecipitation and input samples were analyzed by Western blotting using antibodies against PIP5Kα, mouse TIRAP (F, Abcam), and human TIRAP (G, Abnova). Bar graphs in F and G represented relative band intensities of PIP5Kα and TIRAP in the PIP5Kα IP samples normalized to those in input samples. TIRAP band intensities in the control IgG IP were subtracted from those in the PIP5Kα IP.
We tested whether PIP5Kα might also affect MyD88 subcellular localization by cotransfecting FLAG-MyD88 and either wild-type (HA-tagged) PIP5Kα or kinase-dead (GFP-tagged) PIP5Kα. MyD88 was distinct from TIRAP because it localized in the cytoplasm as aggregate-like forms (52), irrespective of coexpression of wild-type or kinase-dead PIP5Kα (Fig. 6C). This implies that recruitment of MyD88 to the plasma membrane is not directly mediated by PIP2. In addition, unlike MyD88, TIRAP was found to significantly colocalize with wild-type PIP5Kα (Fig. 6B), leading us to test a possible interaction between the two proteins. HEK293T cells transfected with FLAG-PIP5Kα and/or HA-TIRAP were evaluated by FLAG or HA immunoprecipitation. Interestingly, the FLAG and HA immunoprecipitates from the cotransfected samples retained HA and FLAG immunoreactivity, respectively (Fig. 6, D and E). In contrast, cotransfected HA-endophilin 1 (Fig. 6D) and FLAG-PICK1 (Fig. 6E) were not detected in the FLAG and HA immunoprecipitates, respectively, suggesting a specificity of PIP5Kα-TIRAP interaction. Then, we further examined interaction of the endogenous proteins. PIP5Kα was immunoprecipitated from BV2 (Fig. 6F) and HeLa (Fig. 6G) cell lysates, and the starting lysates and the resulting pellets were analyzed for the presence of TIRAP. The Western blots and quantification results showed that TIRAP coprecipitated with PIP5Kα, suggesting an in vivo interaction between PIP5Kα and TIRAP.
LPS Stimulation Induces Dynamic Changes in PIP2 and Translocation of TIRAP to the Plasma Membrane, Which Is Impaired by PIP5Kα KD Cells
Based on the results presented above, we examined the possibility that plasma membrane translocation of TIRAP could occur in LPS-stimulated BV2 microglial cells through PIP5Kα-mediated PIP2 production. To test this, we first measured changes in PIP2 by LPS in control or PIP5Kα siRNA KD cells using PIP2 immunostaining and confocal microscopy. PIP2 imaging was performed while viewing Hoechst 33342 channel images to ensure random selection of cells. PIP2 fluorescence intensities in LPS-stimulated control cells increased up to 30 min but then subsequently declined toward base-line levels for the additional 1 h (Fig. 7A). In contrast, PIP5Kα siRNA KD severely impaired the LPS-mediated PIP2 increase (Fig. 7B). We also determined the time-dependent effect of LPS on PIP2 levels in PIP5Kα shRNA-15 or shRNA-17 KD cells stimulated by LPS and obtained similar results by quantitative image analyses of PIP2 fluorescence intensities (Fig. 7C). In a separate experiment, we determined PIP2 amounts using an ELISA method. Consistent with the results of PIP2 immunofluorescence, increased PIP2 after 30 min of LPS stimulation was much greater in control cells compared with PIP5Kα shRNA KD cells (Fig. 7D). These results suggest that PIP2 levels are enhanced by PIP5Kα following TLR4 activation and decreased through metabolic pathways that mediate PIP2 hydrolysis.
FIGURE 7.

Time-dependent effect of LPS on PIP2 concentration between control and PIP5Kα KD cells. PIP5Kα KD BV2 cells (A and B) and RAW264.7 cells (E) by control or PIP5Kα siRNA were treated with LPS (100 ng/ml) for the indicated times (A and B) or 30 min (E), then fixed, and permeabilized. PIP2 was visualized by immunocytochemical staining of cells with PIP2-specific primary antibody, biotinylated secondary antibody, and then Alexa Fluor 594-conjugated streptavidin. PIP2 fluorescent images (z-stacks) were obtained using confocal microscopy. Cells were outlined by nuclear Hoechst 33342 staining. Scale bars, 20 μm. Control (NT shRNA), PIP5Kα shRNA-15, or shRNA-17 KD BV2 cells were treated with LPS (100 ng/ml) for the indicated times (C) or 30 min (D). C, cells were processed for PIP2 immunofluorescence in the same manner as described in A and B. PIP2 fluorescent intensities from more than 50 individual cells were quantified using ImageJ software (National Institutes of Health) at each time point. Values in the line graph represent mean fluorescent intensity normalized to the mean intensity in NT shRNA at the zero time point. D, cellular PIP2 levels from extracted acidic lipids were measured using the PIP2 mass ELISA kit and determined from the PIP2 standard curve. Values in the bar graph are presented as mean ± S.E. **, p < 0.01; *, p < 0.05.
Next, we transfected control and PIP5Kα KD cells with TIRAP-GFP and stimulated with LPS under the same conditions described above. TIRAP translocated to the plasma membrane within 30 min and returned to the cytoplasm during the time course of LPS stimulation in control cells (Fig. 8, A and C), which was consistent with the kinetics of PIP2 concentration by LPS (Fig. 7A). However, in PIP5Kα siRNA KD cells, TIRAP resided mainly in the cytoplasm throughout the 90-min LPS stimulation periods (Fig. 8A). Similarly, we observed a casual correlation between the changes in PIP2 level (Fig. 7, C and D) and TIRAP membrane translocation when control and PIP5Kα shRNA-15 KD cells transfected with TIRAP-GFP were exposed to LPS. TIRAP membrane translocation mediated by LPS was hardly detectable in PIP5Kα shRNA-15 KD cells, although it occurred in control cells (Fig. 8, B and D). Similarly, PIP5Kα siRNA KD cells blocked LPS-induced increase in PIP2 (Fig. 7E) and plasma membrane translocation of TIRAP (Fig. 8, E and F) in RAW264.7 macrophages. Together, these results suggest that LPS-induced changes in the PIP5Kα-dependent PIP2 pool can control recruitment of TIRAP to the plasma membrane.
FIGURE 8.
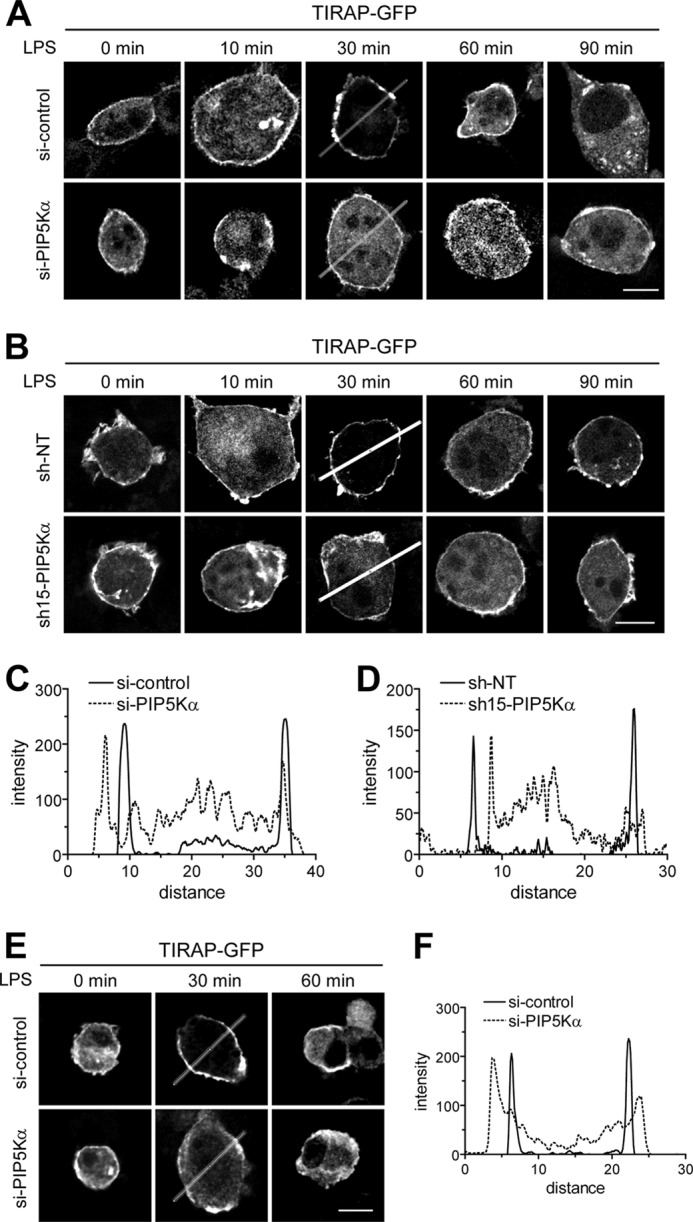
Effect of PIP5Kα KD on LPS-induced recruitment of TIRAP to the plasma membrane. PIP5Kα KD BV2 cells by siRNA (A) or shRNA-15 (B), PIP5Kα KD RAW264.7 cells by siRNA (E), and their corresponding control KD cells were transiently transfected with TIRAP-GFP for 24 h. After treatment with LPS (100 ng/ml) for the indicated times, cells were fixed, and then fluorescent images of TIRAP-GFP fusion protein were captured using confocal microscopy. Scale bars, 10 μm. C, D, and F, GFP fluorescent intensities were quantified from the images obtained 30 min after LPS stimulation in A, B, and E, respectively, with the Zeiss ZEN imaging software. The graphs represent the intensity profiles along the lines, indicating a differential cytoplasm/plasma membrane distribution of TIRAP between the control and PIP5Kα KD cells.
DISCUSSION
The aim of this study was to identify the functional roles of PIP5Kα in microglial inflammatory responses induced by LPS, a potent activator of TLR4. Previously, PIP2 was demonstrated to be critical for membrane localization of TIRAP, an essential adaptor for TLR4 signaling (23). Thus, we also tried to determine whether PIP5Kα and its lipid product PIP2 could have a significant role in TLR4-mediated microglial inflammation via regulation of TIRAP. Therefore, we introduced a PIP5Kα KD system into a BV2 microglial cell model and monitored changes in inflammatory responses, PIP2 amounts, TIRAP localization, and TLR4 downstream signaling molecules before and after LPS stimulation. Altogether, our results suggest that enhanced PIP2 production by PIP5Kα induces pro-inflammatory responses through TIRAP membrane translocation and subsequent activation of MyD88-dependent TLR4 signaling in LPS-stimulated BV2 microglia.
One of the major findings of this study was to reveal that PIP5Kα is a significant mediator of LPS-induced inflammatory responses in microglia. The effect of PIP5Kα was dependent on its catalytic activity, as demonstrated by the defects in triggering inflammatory responses by the PIP5Kα kinase-dead mutant. Our results clearly show that PIP5Kα potentiated LPS-induced activation of NF-κB signaling and phosphorylation of p38 MAPK and JNK. Many studies have shown that NF-κB, p38 MAPK, and JNK mediate inflammatory responses to LPS. These observations indicate that the increased generation of pro-inflammatory cytokines by PIP5Kα in LPS-stimulated BV2 cells is mediated via NF-κB, p38 MAPK, and JNK. PIP2 produced by PIP5Kα also turned out to be a determining factor for the activation of the intracellular signaling players by LPS. However, because PIP2 is distributed primarily along the plasma membrane (25), it is unlikely that PIP5Kα individually activates each of the signaling molecules. Rather, it is reasonable that PIP5Kα and PIP2 affect a convergent event at the cell surface that is upstream of their signaling cascades. TIRAP is indispensable for activation of MyD88-dependent TLR4 signaling pathways in which NF-κB, p38 MAPK, and JNK are activated (13–16, 43). Our results indicate that PIP5Kα directs TIRAP to the plasma membrane in a PIP2-dependent way. Therefore, a plausible interpretation of our results is that PIP5Kα-derived PIP2 activates signaling molecules by mediating plasma membrane targeting of TIRAP, thereby contributing to microglial inflammatory responses.
TIRAP and MyD88 are responsible for the early phase of TLR4 activation. It has been shown that TIRAP functions as a sorting adaptor that links MyD88 to activated TLR4 in the plasma membrane, and translocation of the cytosolic protein MyD88 to the plasma membrane requires its interaction with TIRAP (23). Consistently, we found that PIP5Kα-derived PIP2 mediated plasma membrane localization of TIRAP but not of MyD88, indicating a specific action of PIP5Kα on TIRAP membrane localization. In this regard, it is worthwhile to note that Drosophila MyD88 contains a PIP2-binding site at the C terminus and localizes to the plasma membrane, similar to mammalian TIRAP (53). This study demonstrates an evolutionarily conserved sorting adaptor function in innate immunity and the important roles for PIP2 in the regulation of the Toll signaling at the plasma membrane. However, our results showed interaction of TIRAP with PIP5Kα, raising the possibility that TIRAP binds PIP2 as well as PIP5Kα. The significant colocalization between TIRAP with PIP5Kα further implies that PIP5Kα is closely located to PIP2-enriched membranes, where TIRAP is also concentrated. Interestingly, when TIRAP was directed to the plasma membrane in a PIP2-independent manner, it did not display functional activity (23). Efficient redistribution of TIRAP to a PIP2-specific membrane region is required for TIRAP-mediated TLR4 signaling. Although TIRAP has a preferential binding affinity for PIP2, it also retains broad binding affinities for other phosphoinositides (23). Therefore, we hypothesize that PIP5Kα may help place TIRAP into PIP2-specific membranes via physical interaction.
A critical issue we wanted to address in this study was whether PIP5Kα-dependent PIP2 formation could be enhanced by LPS stimulation. In fact, a previous study already presented several lines of evidence that β2 integrin CD11b and ARF6 were involved in activation of a certain PIP5K upon LPS stimulation, causing increased PIP2 (23). However, a direct effect of LPS on PIP2 levels in the intact plasma membrane was not well established. In addition, which isoform of PIP5K mediates PIP2 synthesis was still largely unknown. Our results reveal that indeed the concentration of PIP2 increases in response to LPS. The type I PIP5K isoforms, PIP5Kα, PIP5Kβ, and PIP5Kγ, were expressed in BV2 microglial cells and thus could potentially mediate PIP2 production. The results that PIP5Kα KD remarkably abrogated the LPS-induced increase in PIP2 support the notion that PIP5Kα plays a major role in the initial increase in PIP2 by LPS. However, we cannot completely exclude the possible involvement of PIP5Kβ or PIP5Kγ. The increased PIP2 level by LPS also decreased during the time course of LPS stimulation. Although PIP2 synthesis depends mainly on the type I PIP5K, multiple enzymatic pathways, including phospholipase C, class I PI3K, and PIP2-specific 5-phosphatases such as synaptojanin and oculocerebrorenal syndrome of Lowe that use PIP2 as a substrate, are available for its degradation (54). Thus, we suggest that such PIP2 degradation pathways would account for the observed decrease in PIP2. Importantly, under LPS-stimulated conditions, we found bi-directional movement of TIRAP between membrane and cytosol depending on dynamic changes in PIP2 levels, and a disrupting effect of PIP5Kα KD. These results further corroborate a physiological relevance of PIP5Kα as a main route of PIP2 production in recruitment of TIRAP to the plasma membrane. PIP2 degradation is likely to attenuate MyD88-dependent TLR4 signaling by promoting dissociation of TIRAP from the plasma membrane.
TLR4 in the microglial cells recognizes exogenous toxins as well as endogenous factors, including heat shock proteins and aggregated proteins such as β-amyloid peptides (55, 56). Microglia activate inflammatory responses against harmful environmental substances and also activate phagocytosis that is responsible for their clearance (57–59). TLR4 is associated with such immune functions of microglia, and thus this receptor signaling is important for the neuroprotective roles of microglia. However, TLR4-mediated microglial activation has been observed in several neurodegenerative disorders such as Alzheimer disease, indicating that it could also be a risk factor for neurotoxicity (4, 60, 61). Therefore, the extent and duration of microglial TLR4 signaling should be tightly regulated. Our results provide an insight into the importance of PIP2-metabolizing enzymes and the regulatory mechanisms of their catalytic activities in TLR4-mediated microglial activation. In conclusion, we reveal that PIP5Kα facilitates LPS-induced production of pro-inflammatory cytokines in microglial cells by activating NF-κB, p38 MAPK, and JNK signaling. Such functions of PIP5Kα are mediated at least in part by PIP2-dependent plasma membrane localization of TIRAP. Therefore, PIP5Kα can be considered a novel player participating in TLR4 signaling in microglial cells.
Acknowledgments
We thank Drs. Ruslan Medzhitov, Eun-hye Joe, Volker Haucke, Andrew Tinker, Richard Anderson, Pietro De Camilli, and Young Ho Suh for providing the expression constructs.
This work was supported by Research Grant 2011-0013962 from Basic Science Research Program through the National Research Foundation of Korea funded by the Ministry of Education, Science, and Technology (to S. Y. L.) and Grant 2012048183 from Korea Science and Engineering Foundation through the Chronic Inflammatory Disease Research Center at Ajou University.
- iNOS
- inducible nitric-oxide synthase
- IκB
- inhibitor of κB
- KD
- knockdown
- LPS
- lipopolysaccharide
- mRFP
- monomeric red fluorescent protein
- MyD88
- myeloid differentiation factor 88
- NT
- nontarget
- PI
- phosphatidylinositol
- PIP2
- PI 4,5-bisphosphate
- PIP5K
- PI 4-phosphate 5-kinase
- qRT-PCR
- quantitative real time PCR
- TIR
- Toll/IL-1 receptor
- TIRAP
- TIR domain-containing adaptor protein
- TLR
- Toll-like receptor
- pAb
- polyclonal antibody.
REFERENCES
- 1. Aloisi F. (2001) Immune function of microglia. Glia 36, 165–179 [DOI] [PubMed] [Google Scholar]
- 2. Hanisch U. K., Kettenmann H. (2007) Microglia. Active sensor and versatile effector cells in the normal and pathologic brain. Nat. Neurosci. 10, 1387–1394 [DOI] [PubMed] [Google Scholar]
- 3. Kim S. U., de Vellis J. (2005) Microglia in health and disease. J. Neurosci. Res. 81, 302–313 [DOI] [PubMed] [Google Scholar]
- 4. Block M. L., Zecca L., Hong J. S. (2007) Microglia-mediated neurotoxicity. Uncovering the molecular mechanisms. Nat. Rev. Neurosci. 8, 57–69 [DOI] [PubMed] [Google Scholar]
- 5. Yang M. S., Min K. J., Joe E. (2007) Multiple mechanisms that prevent excessive brain inflammation. J. Neurosci. Res. 85, 2298–2305 [DOI] [PubMed] [Google Scholar]
- 6. Akira S., Uematsu S., Takeuchi O. (2006) Pathogen recognition and innate immunity. Cell 124, 783–801 [DOI] [PubMed] [Google Scholar]
- 7. Olson J. K., Miller S. D. (2004) Microglia initiate central nervous system innate and adaptive immune responses through multiple TLRs. J. Immunol. 173, 3916–3924 [DOI] [PubMed] [Google Scholar]
- 8. Jack C. S., Arbour N., Manusow J., Montgrain V., Blain M., McCrea E., Shapiro A., Antel J. P. (2005) TLR signaling tailors innate immune responses in human microglia and astrocytes. J. Immunol. 175, 4320–4330 [DOI] [PubMed] [Google Scholar]
- 9. Jou I., Lee J. H., Park S. Y., Yoon H. J., Joe E. H., Park E. J. (2006) Gangliosides trigger inflammatory responses via TLR4 in brain glia. Am. J. Pathol. 168, 1619–1630 [DOI] [PMC free article] [PubMed] [Google Scholar]
- 10. Qin L., Liu Y., Wang T., Wei S. J., Block M. L., Wilson B., Liu B., Hong J. S. (2004) NADPH oxidase mediates lipopolysaccharide-induced neurotoxicity and proinflammatory gene expression in activated microglia. J. Biol. Chem. 279, 1415–1421 [DOI] [PubMed] [Google Scholar]
- 11. Lund S., Christensen K. V., Hedtjärn M., Mortensen A. L., Hagberg H., Falsig J., Hasseldam H., Schrattenholz A., Pörzgen P., Leist M. (2006) The dynamics of the LPS triggered inflammatory response of murine microglia under different culture and in vivo conditions. J. Neuroimmunol. 180, 71–87 [DOI] [PubMed] [Google Scholar]
- 12. O'Neill L. A., Bowie A. G. (2007) The family of five. TIR-domain-containing adaptors in Toll-like receptor signaling. Nat. Rev. Immunol. 7, 353–364 [DOI] [PubMed] [Google Scholar]
- 13. Akira S., Takeda K. (2004) Toll-like receptor signaling. Nat. Rev. Immunol. 4, 499–511 [DOI] [PubMed] [Google Scholar]
- 14. Yamamoto M., Sato S., Hemmi H., Sanjo H., Uematsu S., Kaisho T., Hoshino K., Takeuchi O., Kobayashi M., Fujita T., Takeda K., Akira S. (2002) Essential role for TIRAP in activation of the signaling cascade shared by TLR2 and TLR4. Nature 420, 324–329 [DOI] [PubMed] [Google Scholar]
- 15. Fitzgerald K. A., Palsson-McDermott E. M., Bowie A. G., Jefferies C. A., Mansell A. S., Brady G., Brint E., Dunne A., Gray P., Harte M. T., McMurray D., Smith D. E., Sims J. E., Bird T. A., O'Neill L. A. (2001) Mal (MyD88-adapter-like) is required for Toll-like receptor-4 signal transduction. Nature 413, 78–83 [DOI] [PubMed] [Google Scholar]
- 16. Horng T., Barton G. M., Flavell R. A., Medzhitov R. (2002) The adaptor molecule TIRAP provides signaling specificity for Toll-like receptors. Nature 420, 329–333 [DOI] [PubMed] [Google Scholar]
- 17. Li Q., Verma I. M. (2002) NF-κB regulation in the immune system. Nat. Rev. Immunol. 2, 725–734 [DOI] [PubMed] [Google Scholar]
- 18. Husebye H., Halaas Ø., Stenmark H., Tunheim G., Sandanger Ø., Bogen B., Brech A., Latz E., Espevik T. (2006) Endocytic pathways regulate Toll-like receptor 4 signaling and link innate and adaptive immunity. EMBO J. 25, 683–692 [DOI] [PMC free article] [PubMed] [Google Scholar]
- 19. Kagan J. C., Su T., Horng T., Chow A., Akira S., Medzhitov R. (2008) TRAM couples endocytosis of Toll-like receptor 4 to the induction of interferon-β. Nat. Immunol. 9, 361–368 [DOI] [PMC free article] [PubMed] [Google Scholar]
- 20. Yamamoto M., Sato S., Hemmi H., Hoshino K., Kaisho T., Sanjo H., Takeuchi O., Sugiyama M., Okabe M., Takeda K., Akira S. (2003) Role of adaptor TRIF in the MyD88-independent toll-like receptor signaling pathway. Science 301, 640–643 [DOI] [PubMed] [Google Scholar]
- 21. Yamamoto M., Sato S., Hemmi H., Uematsu S., Hoshino K., Kaisho T., Takeuchi O., Takeda K., Akira S. (2003) TRAM is specifically involved in the Toll-like receptor 4-mediated MyD88-independent signaling pathway. Nat. Immunol. 4, 1144–1150 [DOI] [PubMed] [Google Scholar]
- 22. Fitzgerald K. A., Rowe D. C., Barnes B. J., Caffrey D. R., Visintin A., Latz E., Monks B., Pitha P. M., Golenbock D. T. (2003) LPS-TLR4 signaling to IRF-3/7 and NF-κB involves the toll adapters TRAM and TRIF. J. Exp. Med. 198, 1043–1055 [DOI] [PMC free article] [PubMed] [Google Scholar]
- 23. Kagan J. C., Medzhitov R. (2006) Phosphoinositide-mediated adaptor recruitment controls Toll-like receptor signaling. Cell 125, 943–955 [DOI] [PubMed] [Google Scholar]
- 24. Ishihara H., Shibasaki Y., Kizuki N., Katagiri H., Yazaki Y., Asano T., Oka Y. (1996) Cloning of cDNAs encoding two isoforms of 68-kDa type I phosphatidylinositol-4-phosphate 5-kinase. J. Biol. Chem. 271, 23611–23614 [DOI] [PubMed] [Google Scholar]
- 25. Di Paolo G., De Camilli P. (2006) Phosphoinositides in cell regulation and membrane dynamics. Nature 443, 651–657 [DOI] [PubMed] [Google Scholar]
- 26. Doughman R. L., Firestone A. J., Anderson R. A. (2003) Phosphatidylinositol phosphate kinases put PI4,5P2 in its place. J. Membr. Biol. 194, 77–89 [DOI] [PubMed] [Google Scholar]
- 27. Botelho R. J., Teruel M., Dierckman R., Anderson R., Wells A., York J. D., Meyer T., Grinstein S. (2000) Localized biphasic changes in phosphatidylinositol-4,5-bisphosphate at sites of phagocytosis. J. Cell Biol. 151, 1353–1368 [DOI] [PMC free article] [PubMed] [Google Scholar]
- 28. Barbieri M. A., Heath C. M., Peters E. M., Wells A., Davis J. N., Stahl P. D. (2001) Phosphatidylinositol-4-phosphate 5-kinase-1β is essential for epidermal growth factor receptor-mediated endocytosis. J. Biol. Chem. 276, 47212–47216 [DOI] [PubMed] [Google Scholar]
- 29. Weernink P. A., Meletiadis K., Hommeltenberg S., Hinz M., Ishihara H., Schmidt M., Jakobs K. H. (2004) Activation of type I phosphatidylinositol 4-phosphate 5-kinase isoforms by the Rho GTPases, RhoA, Rac1, and Cdc42. J. Biol. Chem. 279, 7840–7849 [DOI] [PubMed] [Google Scholar]
- 30. Payrastre B., Missy K., Giuriato S., Bodin S., Plantavid M., Gratacap M. (2001) Phosphoinositides. Key players in cell signaling, in time and space. Cell. Signal. 13, 377–387 [DOI] [PubMed] [Google Scholar]
- 31. Yin H. L., Janmey P. A. (2003) Phosphoinositide regulation of the actin cytoskeleton. Annu. Rev. Physiol. 65, 761–789 [DOI] [PubMed] [Google Scholar]
- 32. Balla T. (2005) Inositol-lipid binding motifs. Signal integrators through protein-lipid and protein-protein interactions. J. Cell Sci. 118, 2093–2104 [DOI] [PubMed] [Google Scholar]
- 33. Kanaho Y., Kobayashi-Nakano A., Yokozeki T. (2007) The phosphoinositide kinase PIP5K that produces the versatile signaling phospholipid PI4,5P2. Biol. Pharm. Bull. 30, 1605–1609 [DOI] [PubMed] [Google Scholar]
- 34. Park S. J., Itoh T., Takenawa T. (2001) Phosphatidylinositol 4-phosphate 5-kinase type I is regulated through phosphorylation response by extracellular stimuli. J. Biol. Chem. 276, 4781–4787 [DOI] [PubMed] [Google Scholar]
- 35. van den Bout I., Divecha N. (2009) PIP5K-driven PtdIns(4,5)P2 synthesis. Regulation and cellular functions. J. Cell Sci. 122, 3837–3850 [DOI] [PubMed] [Google Scholar]
- 36. Krauss M., Haucke V. (2007) Phosphoinositide-metabolizing enzymes at the interface between membrane traffic and cell signaling. EMBO Rep. 8, 241–246 [DOI] [PMC free article] [PubMed] [Google Scholar]
- 37. Lee S. Y., Kim B., Jeong H. K., Min K. J., Liu T., Park J. Y., Joe E. H., Jou I. (2010) Enhanced phosphatidylinositol 4-phosphate 5-kinase α expression and PI(4,5)P2 production in LPS-stimulated microglia. Neurochem. Int. 57, 600–607 [DOI] [PubMed] [Google Scholar]
- 38. Quinn K. V., Behe P., Tinker A. (2008) Monitoring changes in membrane phosphatidylinositol 4,5-bisphosphate in living cells using a domain from the transcription factor tubby. J. Physiol. 586, 2855–2871 [DOI] [PMC free article] [PubMed] [Google Scholar]
- 39. Kim B., Yang M. S., Choi D., Kim J. H., Kim H. S., Seol W., Choi S., Jou I., Kim E. Y., Joe E. H. (2012) Impaired inflammatory responses in murine Lrrk2-knockdown brain microglia. PLoS ONE 7, e34693. [DOI] [PMC free article] [PubMed] [Google Scholar]
- 40. Min K. J., Pyo H. K., Yang M. S., Ji K. A., Jou I., Joe E. H. (2004) Gangliosides activate microglia via protein kinase C and NADPH oxidase. Glia 48, 197–206 [DOI] [PubMed] [Google Scholar]
- 41. Liu B., Gao H. M., Wang J. Y., Jeohn G. H., Cooper C. L., Hong J. S. (2002) Role of nitric oxide in inflammation-mediated neurodegeneration. Ann. N.Y. Acad. Sci. 962, 318–331 [DOI] [PubMed] [Google Scholar]
- 42. Pawate S., Shen Q., Fan F., Bhat N. R. (2004) Redox regulation of glial inflammatory response to lipopolysaccharide and interferonγ. J. Neurosci. Res. 77, 540–551 [DOI] [PubMed] [Google Scholar]
- 43. Huang Q., Yang J., Lin Y., Walker C., Cheng J., Liu Z. G., Su B. (2004) Differential regulation of interleukin 1 receptor and Toll-like receptor signaling by MEKK3. Nat. Immunol. 5, 98–103 [DOI] [PubMed] [Google Scholar]
- 44. Sakurai H., Chiba H., Miyoshi H., Sugita T., Toriumi W. (1999) IκB kinases phosphorylate NF-κB p65 subunit on serine 536 in the transactivation domain. J. Biol. Chem. 274, 30353–30356 [DOI] [PubMed] [Google Scholar]
- 45. Yang F., Tang E., Guan K., Wang C. Y. (2003) IKKβ plays an essential role in the phosphorylation of RelA/p65 on serine 536 induced by lipopolysaccharide. J. Immunol. 170, 5630–5635 [DOI] [PubMed] [Google Scholar]
- 46. O'Neill L. A., Dunne A., Edjeback M., Gray P., Jefferies C., Wietek C. (2003) Mal and MyD88: adapter proteins involved in signal transduction by Toll-like receptors. J. Endotoxin Res. 9, 55–59 [DOI] [PubMed] [Google Scholar]
- 47. Ojaniemi M., Glumoff V., Harju K., Liljeroos M., Vuori K., Hallman M. (2003) Phosphatidylinositol 3-kinase is involved in Toll-like receptor 4-mediated cytokine expression in mouse macrophages. Eur. J. Immunol. 33, 597–605 [DOI] [PubMed] [Google Scholar]
- 48. Laird M. H., Rhee S. H., Perkins D. J., Medvedev A. E., Piao W., Fenton M. J., Vogel S. N. (2009) TLR4/MyD88/PI3K interactions regulate TLR4 signaling. J. Leukocyte Biol. 85, 966–977 [DOI] [PMC free article] [PubMed] [Google Scholar]
- 49. Coppolino M. G., Dierckman R., Loijens J., Collins R. F., Pouladi M., Jongstra-Bilen J., Schreiber A. D., Trimble W. S., Anderson R., Grinstein S. (2002) Inhibition of phosphatidylinositol-4-phosphate 5-kinase Iα impairs localized actin remodeling and suppresses phagocytosis. J. Biol. Chem. 277, 43849–43857 [DOI] [PubMed] [Google Scholar]
- 50. Santagata S., Boggon T. J., Baird C. L., Gomez C. A., Zhao J., Shan W. S., Myszka D. G., Shapiro L. (2001) G-protein signaling through tubby proteins. Science 292, 2041–2050 [DOI] [PubMed] [Google Scholar]
- 51. Szentpetery Z., Balla A., Kim Y. J., Lemmon M. A., Balla T. (2009) Live cell imaging with protein domains capable of recognizing phosphatidylinositol 4,5-bisphosphate; a comparative study. BMC Cell Biol. 10, 67. [DOI] [PMC free article] [PubMed] [Google Scholar]
- 52. Nishiya T., Kajita E., Horinouchi T., Nishimoto A., Miwa S. (2007) Distinct roles of TIR and non-TIR regions in the subcellular localization and signaling properties of MyD88. FEBS Lett. 581, 3223–3229 [DOI] [PubMed] [Google Scholar]
- 53. Marek L. R., Kagan J. C. (2012) Phosphoinositide binding by the Toll adaptor dMyD88 controls antibacterial responses in Drosophila. Immunity 36, 612–622 [DOI] [PMC free article] [PubMed] [Google Scholar]
- 54. Vicinanza M., D'Angelo G., Di Campli A., De Matteis M. A. (2008) Phosphoinositides as regulators of membrane trafficking in health and disease. Cell. Mol. Life Sci. 65, 2833–2841 [DOI] [PMC free article] [PubMed] [Google Scholar]
- 55. Lehnardt S., Schott E., Trimbuch T., Laubisch D., Krueger C., Wulczyn G., Nitsch R., Weber J. R. (2008) A vicious cycle involving release of heat shock protein 60 from injured cells and activation of toll-like receptor 4 mediates neurodegeneration in the CNS. J. Neurosci. 28, 2320–2331 [DOI] [PMC free article] [PubMed] [Google Scholar]
- 56. Lehnardt S. (2010) Innate immunity and neuroinflammation in the CNS. The role of microglia in Toll-like receptor-mediated neuronal injury. Glia 58, 253–263 [DOI] [PubMed] [Google Scholar]
- 57. Kielian T. (2006) Toll-like receptors in central nervous system glial inflammation and homeostasis. J. Neurosci. Res. 83, 711–730 [DOI] [PMC free article] [PubMed] [Google Scholar]
- 58. Ribes S., Ebert S., Regen T., Agarwal A., Tauber S. C., Czesnik D., Spreer A., Bunkowski S., Eiffert H., Hanisch U. K., Hammerschmidt S., Nau R. (2010) Toll-like receptor stimulation enhances phagocytosis and intracellular killing of nonencapsulated and encapsulated Streptococcus pneumoniae by murine microglia. Infect. Immun. 78, 865–871 [DOI] [PMC free article] [PubMed] [Google Scholar]
- 59. Lee C. Y., Landreth G. E. (2010) The role of microglia in amyloid clearance from the AD brain. J. Neural Transm. 117, 949–960 [DOI] [PMC free article] [PubMed] [Google Scholar]
- 60. Walter S., Letiembre M., Liu Y., Heine H., Penke B., Hao W., Bode B., Manietta N., Walter J., Schulz-Schuffer W., Fassbender K. (2007) Role of the toll-like receptor 4 in neuroinflammation in Alzheimer's disease. Cell. Physiol. Biochem. 20, 947–956 [DOI] [PubMed] [Google Scholar]
- 61. Jin J. J., Kim H. D., Maxwell J. A., Li L., Fukuchi K. (2008) Toll-like receptor 4-dependent up-regulation of cytokines in a transgenic mouse model of Alzheimer's disease. J. Neuroinflammation 5, 23. [DOI] [PMC free article] [PubMed] [Google Scholar]