Abstract
Changes in the enantiomer fraction of chiral polychlorinated biphenyls (PCBs) are a powerful tool to investigate the movement of PCBs in the environment, for example as part of source apportionment and ecological studies. Environmental studies typically employ a series of cyclodextrin-based gas chromatography columns to separate all environmentally relevant PCB congeners. The elution order of most PCB atropisomers has not been established on different enantioselective columns due to the unavailability of analytical standards. To overcome this limitation, the current study generated atropisomerically enriched fractions of chiral PCBs with rat liver microsomes. Subsequently, the enrichment profile of the enriched PCB fractions was used to determine the elution order of PCB atropisomers on selected enantioselective gas chromatography columns. While the elution order of PCB 95, 131, 132, 136, 149 and 176 atropisomers was identical on all enantioselective columns investigated, an inversion of the elution order was observed for PCB 45, 84, 91 and 174 atropisomers on a few columns. These results demonstrate that atropisomerically enriched fractions obtained from microsomal metabolism can be used to unambiguously establish the relative elution order of the atropisomers of PCBs and potentially other environmental pollutant, especially if pure enantiomers are not available.
Keywords: Polychlorinated biphenyls, microsomes, atropisomeric enrichment, gas chromatography
1. Introduction
Chirality is a characteristic of many small biological molecules and also of a large number of manmade chemicals. For example, 25% of all pesticides currently on the market are chiral [1], which has implications for environmental health. The two enantiomers of a chiral compound may be able to interact differently with biological macromolecules, such as enzymes or receptors. As a result, chiral compounds can undergo enantiomeric enrichment in the environment and display enantioselective biological effects [2]. The enantiomeric enrichment of chiral environmental pollutants is a powerful tool to study the transport and transformation of chiral pollutants in the environment. At the same time, the enantiomeric enrichment of pollutants in the environment represents a potential environmental and human health concern, especially if the more toxic enantiomer is enriched in the food chain.
PCBs are one important group of chiral environmental pollutants. Nineteen out of the 209 possible PCB congeners exist as rotational enantiomers, called atropisomers, which are stable at room temperature and during gas chromatographic analysis [3–5]. Gas chromatographic separation of PCB atropisomers is possible on different chiral stationary phases. Over the years, considerable effort has been devoted to in-house synthesis of cyclodextrin-based gas chromatography columns and studies of the effect of cyclodextrin derivatization on separation of PCB atropisomers [6,7]. However, to this day no commercially available enantioselective gas chromatography column can resolve the atropisomers of all chiral PCBs [8], which represents a major challenge when studying the atropisomeric enrichment of PCBs in environmental samples. Consequently, the atropisomeric enrichment of PCBs is typically assessed using several different enantioselective columns. Unfortunately, the elution order of enantiomers can vary on diametrically different gas chromatographic phases [9,10]. It is therefore crucial to unambiguously establish the elution order of PCB atropisomers on different enantioselective columns.
The elution order of enantiomers on different enantioselective stationary phases can be easily established using pure enantiomers. Pure atropisomers of several PCB congeners have been isolated using enantioselective HPLC [3,11–13]. Unfortunately, the isolation of PCB atropisomers by HPLC so far proved to be tedious and time consuming. Furthermore, the atropisomers of several environmentally important congeners, such as PCBs 91, 95 and 149, cannot be readily separated using this approach. Alternatively, the elution order of PCB atropisomers can be established by comparing the enrichment patterns of environmental PCB samples on different columns [14–16]. This approach has the disadvantage that environmental PCB samples may not display a characteristic atropisomeric enrichment. Moreover, co-eluting impurities may suggest a wrong elution order [17], a problem that can be overcome by application of two dimensional gas chromatography [16,18].
Cytochrome P450 (CYP) enzymes are the major family of enzymes responsible for the oxidative metabolism of PCBs and many other environmental contaminants [19]. CYPs atropselectively oxidize individual PCB congeners to hydroxylated metabolites. As a result, both the parent PCBs and the corresponding hydroxylated PCB metabolites display significant atropisomeric enrichment [20–23]. Since PCBs and their hydroxylated metabolites can be easily separated from each other, CYP-mediated metabolism represents a straightforward approach to generate atropisomerically enriched samples of individual PCB congeners. Furthermore, CYPs are readily available as recombinant enzymes or microsomes. Microsomes are subcellular fractions obtained by differential centrifugation from liver or other tissues, and contain complex CYP mixtures. Therefore, microsomes are an inexpensive tool for laboratory studies involving the metabolism of PCBs and other environmental contaminants.
The present study employed liver microsomes as an alternative approach to prepare atropisomerically enriched fractions of fourteen environmentally relevant PCBs. These PCB fractions were subsequently employed as analytical standards to establish the elution order of PCB atropisomers on six commonly used enantioselective gas chromatography columns.
2. Materials and methods
2.1. Chemicals
The chemical structures of the chiral PCB congeners investigated are shown in Fig. 1. Racemic PCB 45 (2,2′,3,6-tetrachlorobiphenyl, purity 99.9%), PCB 84 (2,2′,3,3′,6-pentachlorobiphenyl), PCB 88 (2,2′,3,4,6-pentachlorobiphenyl, purity 99.6%), PCB 91 (2,2′,3,4′,6-pentachlorobiphenyl, purity 100%), PCB 95 (2,2′,3,5′,6-pentachlorobiphenyl, purity 99.7%), PCB 131 (2,2′,3,3′,4,6-hexachlorobiphenyl, purity 100%), PCB 132 (2,2′,3,3′,4,6′-hexachlorobiphenyl, purity 99.8%), PCB 135 (2,2′,3,3′,5,6′-hexachlorobiphenyl, purity 99.7%), PCB 139 (2,2′,3,4,4′,6-hexachlorobiphenyl, purity 99.4%) and PCB 149 (2,2′,3,4′,5′,6-hexachlorobiphenyl, purity 100%), PCB 174 (2,2′,3,3′,4,5,6′-heptachlorobiphenyl, purity 100%), PCB 176 (2,2′,3,3′,4,6,6′-heptachlorobiphenyl, purity 100%), PCB 183 (2,2′,3,4,4′,5′,6-heptachlorobiphenyl, purity 99%) were purchased from Accustandard (New Haven, CT). Racemic PCB 136 (2,2′,3,3′,6,6′-hexachlorobiphenyl) was synthesized as described previously [24].
Fig. 1.
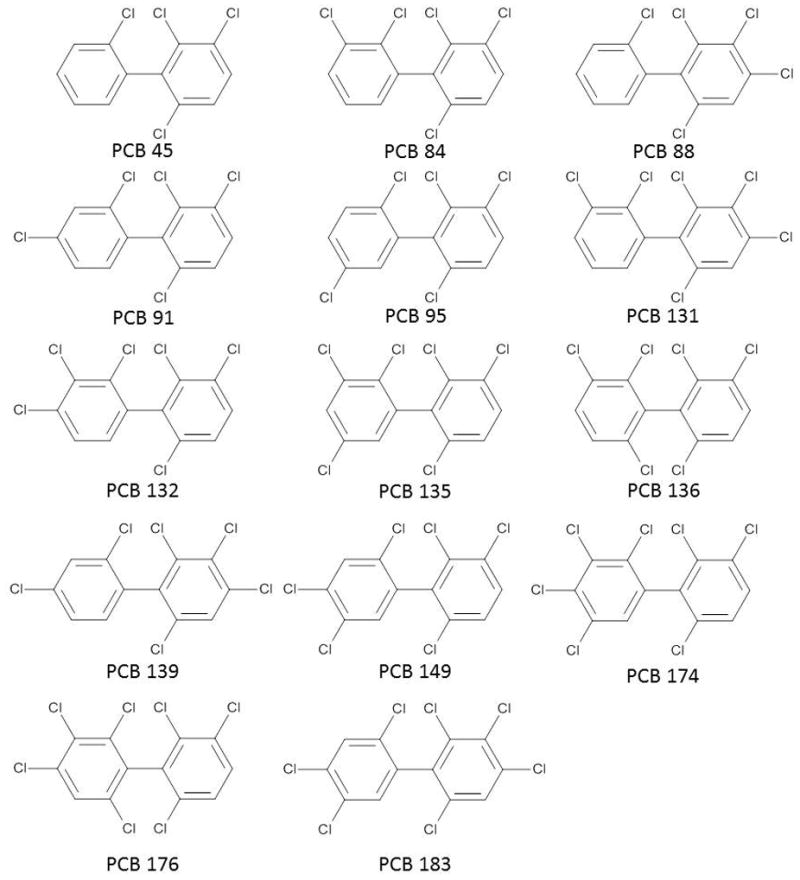
Chemical structure of the chiral PCBs used in the current study.
2.2. Enantioselective columns
HP-Chiral-20B (20B; 20% β-cyclodextrin in in (35%-phenyl)-methylpolysiloxane, 30 m x 250 μm x 0.25 μm), Cyclosil-B (CB; 30% hepatkis (2,3-di-O-methyl-6-O-tert-butyl dimethyl-silyl)-β-cyclodextrin, 30 m x 250 μm x 0.25 μm) and Chirasil-Dex columns (CD; 2,3,6-tri-O-methyl-β-cyclodextrin, 30 m x 250 μm x 0.39 μm) were purchased from Agilent (Santa Clara, CA). The BGB-172 column (BGB; 20% tert-butyldimethyl-silyl-β-cyclodextrin, 30 m x 250 μm x 0.25 μm) was obtained from BGB Analytics, Boecten, Switzerland. ChiralDex B-DM (BDM; 2,3-di-O-methyl-6-tert-butyl-silyl-β-cyclodextrin, 30 m x 250 μm x 0.12 μm) and ChiralDex B-PM columns (BPM; 2,3,6-tri-O-methyl-silyl-β-cyclodextrin, 30 m x 250 μm x 0.12 μm) were acquired from Supelco (St. Louis, MO).
2.3. Preparation of atropisomerically enriched PCBs using rat liver microsomes
Polychlorinated biphenyl congeners were incubated with liver microsomes prepared from phenobarbital-treated rats as describe previously [20]. The microsomal incubation mixture consisted of 0.1 M phosphate buffer (pH 7.4), 3 mM magnesium chloride, 0.5 mM NADPH and 0.77 mg/mL of microsomal protein in a final volume of 16 mL. The samples were pre-incubated for 5 min before 80μL of a 10 mM PCB solution in DMSO was added followed by incubation for 30 min at 37 ± 1°C in shaking water bath. The reaction was stopped by adding 10 mL of ice cold sodium hydroxide (0.5 M), followed by heating samples at 90°C for 10 min. Samples were then acidified with hydrochloric acid (1 mL, 6 M) and proteins were further denaturated with 2-propanol (2 mL) before extraction with hexane-methyl-tert-butyl ether (5 mL, 1:1) [20,25]. Hydroxylated metabolites were separated before subjecting the PCB fractions to clean-up with sulfuric acid as described previously [24,25].
2.4. Enantioselective analysis
PCB containing fractions from the microsomal incubations and the corresponding racemic standards were analyzed on different enantioselective columns. An Agilent 7890A gas chromatograph equipped with an micro electron capture detector (μ-63Ni-ECD) was used for the enantioselective analyses. The following temperature program was used: 50°C for 1 min, 10°C/min to 140°C, hold for X min, 10°C/min to Y, hold for 20 min. Time X varied from 250 to 500 min to allow the elution of all PCB congeners during the isothermal part of the temperature program. Temperature Y varied from 180°C to 250°C, depending on the maximum column temperature recommended by the manufacturer. The flow was 3 mL/min and the injector and detector temperatures were 250°C. All chromatograms were integrated using the valley drop method [26].
The atropisomeric enrichment was expressed as enantiomeric fraction, defined as EF = E1/(E1+E2) where E1 and E2 are the area of the first and second eluting peak, respectively [27]. In addition, the deviation from racemic (DFR) was calculated to simplify the comparison of the atropisomeric enrichment determined with different enantioselective columns for different PCB congeners. The DFR uses the enriched and not a pre-defined atropisomer (i.e., the first eluting atropisomer) in the nominator and was calculated as |0.50-EF| [28]. The EF of the racemic standard was used to calculate the DFR because the racemic standard on some columns had EFs ≠ 0.50 (Table S1, Supplementary Material). The DFR can vary from 0.00 (no enrichment, racemic mixture) to 0.50 (pure atropisomer).
3. Results and discussion
3.1. Separation of PCB atropisomers
The determination of the elution orders of enantiomers on different stationary phases represents a major challenge for laboratory and environmental studies involving chiral environmental pollutants, such as PCBs, because pure atropisomers or atropisomerically enriched standards are not readily available. We and others have shown that oxidation of racemic PCB congeners by rat liver microsomes or recombinant cytochrome P450 enzymes results in a pronounced atropisomeric enrichment of the parent PCB [20,22,23]. Building on this finding, the present study employed microsomal incubations to generate atropisomerically enriched samples of fourteen environmentally relevant, chiral PCB congeners. Subsequently, the atropisomer profile was used to determine the elution order of the respective atropisomers on different, commercially available enantioselective gas chromatography columns. This approach offers the advantage of using pure, racemic PCB congeners for the preparation of atropisomerically enriched standards, thus avoiding the problem of co-eluting impurities inevitably present in environmental samples. A disadvantage of this approach is that some chiral PCB congeners are not readily metabolized by cytochrome P450 enzymes; however, most of these congeners are of limited environmental and/or toxicological relevance [5].
The six enantioselective gas chromatography columns investigated in this study contained differently modified β-cyclodextrin on polysiloxane stationary phases (Table 1). The 20B column contained 20% unmodified β-cyclodextrin. All remaining columns contained methylated cyclodextrins or, in the case of the BGB, BDM and CB columns, methylated and tert-butylated cyclodextrins. Two of the columns investigated—the BGB and CD columns—are the most versatile columns for enantioselective PCB separations and are frequently used to determine the EFs of PCBs in environmental samples (for examples see: [16,29–31]). The other columns were included in this study because they may represent an alternative for enantioselective analyses of selected PCB congeners of environmental or toxicological relevance [32–35]. In our study, an isothermal temperature program was used for the enantioselective PCB analysis to maximize the resolution of the PCB atropisomers [36].
Table 1.
Resolution of the chiral PCBs on set of enantioselective gas chromatography columns at 140 °C. The retention time of the first eluting peak is given in parentheses.
| PCB congener | 20B | BDM | BGB | BPM | CB | CD |
|---|---|---|---|---|---|---|
| PCB 45 | nr | 1.1 (47.1) | 0.70 (112.5) | nr | 0.97 (83.2) | nr |
| PCB 84 | nr | nr | 0.75 (249.9) | nr | 0.42 (212.3) | 0.53 (99.7) |
| PCB 88 | nr | nr | nr | nr | nr | nr |
| PCB 91 | 0.43 (264.9) | 1.7 (109.9) | 0.69 (227.5) | nr | 1.6 (186.6) | 0.65 (90.2) |
| PCB 95 | 0.52 (245.8) | 1.2 (97.8) | nr | nr | 0.97 (166.8) | 0.57 (82.4) |
| PCB 131 | nr | 0.84 (217.0) | 0.65 (428.4) | nr | nr | nr |
| PCB 132 | 0.76 (537.6) | nr | 0.77 (515.3) | 0.71 (218.5) | nr | 1.1 (225.4) |
| PCB 135 | nr | nr | 1.0 (330.5) | nr | nr | 0.80 (201.9) |
| PCB 136 | 0.32 (402.0) | 0.84 (136.8) | nr | nr | 1.5 (255.2) | 1.1 (166.4) |
| PCB 139 | nr | nr | nr | nr | nr | nr |
| PCB 149 | 0.48 (466.6) | 0.92 (207.1) | 0.81 (392.2) | 0.20 (156.7) | 0.77 (354.4) | 0.70 (162.5) |
| PCB 174 | nr | 0.60 (448.3) | 0.48 (534.8) | nr | 0.61 (449.4) | 0.69 (338.5) |
| PCB 176 | nr | 0.71 (254.4) | nr | nr | 0.89 (457.4) | 1.0 (291.0) |
| PCB 183 | nr | nr | 0.86 (534.1) | nr | nr | nr |
Resolution was defined as Rs=(tR2-tR1)/0.5(BW1+BW2), where TR1 and TR2 are the retention times and BW1 and BW2 are the baseline peak widths of the first and the second eluting atropisomers, respectively. The resolutions of PCBs on most of the columns were reported previously by Wong and Garrison [8]. Samples were analyzed at 140°C. nr –not resolving.
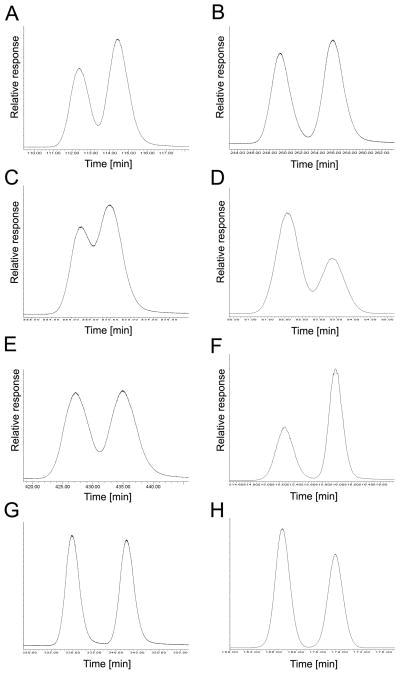
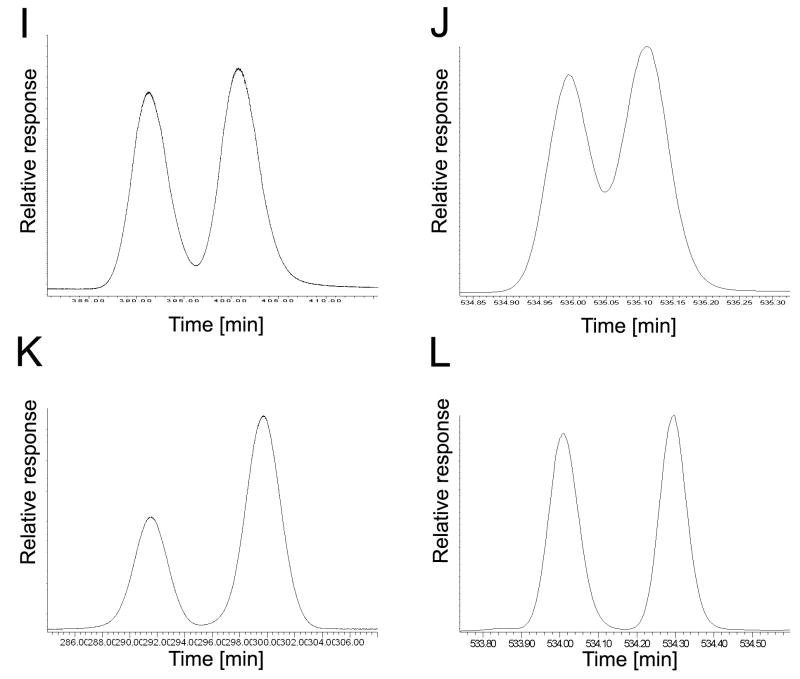
Representative chromatograms of the atropisomerically enriched fractions for the microsomal incubations are shown in Fig. 1. No single column separated the atropisomers of all fourteen chiral PCBs investigated (Fig. 1, Table 1), as noted previously by Wong and Garrison [8]. The BGB and CD columns resolved the atropisomers of nine out of the fourteen PCB congeners used in this study; however, only PCB 135 was baseline separated on the BGB column (Rs = 1.0). The resolution of the remaining congeners on the BGB column was < 1.0. Baseline separation was achieved for PCBs 132, 136 and 176 on the CD column. The CB column resolved the atropisomers of eight congeners, with PCBs 45, 91, 95 and 136 being baseline separated. Similarly, the BDM column resolved the atropisomers of eight congeners, with baseline separation of PCBs 45, 91, 95 and 149. The least versatile columns were the B20 column, which separated the atropisomers of five PCB congeners, and the BPM column, which separated the atropisomers of PCBs 132 and 149 with a resolution < 1.0.
A comparison of the resolution of the atropisomers revealed that some PCB congeners are more readily separated on cyclodextrin-based columns than others (Table 1). Specifically, the atropisomers of PCB 149 were resolved on all six enantioselective columns. The best resolution for PCB 149 was achieved on the BDM column. PCB 91 atropisomers were resolved on all columns investigated, with the exception of the BPM column. Baseline separation of PCB 91 atropisomers was achieved on the BDM and CB columns (Rs= 1.7 and 1.6, respectively). Most other congeners were resolved on three or four of the columns investigated, with at least one of columns providing baseline separation. In our study, the resolution of PCBs 95 and 149 on the CD column was lower (Rs = 0.65 and 0.57, respectively) compared to the resolution reported previously by Wong and Garrison (Rs = 0.9 and 1.3, respectively) [8]. PCBs 84 and 174 atropisomers were partially resolved on CB column in our study (Rs = 0.42 and 0.61, respectively), whereas both congeners were not resolved in the study by Wong and Garrison. Atropisomers of PCBs 88 and 139 were not resolved on any enantioselective column used in our study and, therefore, were not further studied. In contrast, the GTA column resolved the atropisomers of both congeners in the study by Wong and Garrison (Rs =1.2 and 1.0, respectively). The differences in the resolution of different PCB atropisomers in our study and the study by Wong and Garrison are likely due to the differences in the temperature programs.
The results presented in Table 1 suggest structural features associated with the resolution of PCB atropisomers on cyclodextrin-based columns. Most PCB congeners with a 2,3,4,6 chlorination pattern in the higher chlorinated phenyl ring (i.e., PCBs 88, 131, 139, 176 and 183) were more difficult to resolve on the enantioselective columns investigated, with PCB 176 being the only exception. Similarly, Haglund and co-workers reported that the separation of PCB atropisomers with a 2,3,4,6-substitution pattern is unfavorable on the CD column, with PCB 176 being a notable exception [37].
Congeners with a 2,3,6 substitution pattern in one phenyl ring tended to resolve better on the cyclodextrin-based columns used in this study. Likewise, Haglund et al. reported that a 2,3,6 substitution pattern is favorable for the PCB atropisomer separation on CD column [37]. As a general rule, the present study suggests that the structure-resolution relationships described by Haglund for the CD column also apply to other cyclodextrin-based columns, with a 2,3,6 substitution pattern being favorable and a 2,3,4,6 substitution pattern being unfavorable for the separation of PCB atropisomers.
3.2. Enrichment of PCB atropisomers in microsomal incubations
The present study used rat liver microsomes to prepare atropisomerically enriched PCB samples as analytical standards for gas chromatographic analysis. Since multiple ortho substituted PCBs are metabolized by CYP2B enzymes [22,38,39], microsomes were prepared from phenobarbital-treated rats to induce CYP2B activity and, thus, maximize the biotransformation of PCB atropisomers. The microsomes used in this study indeed showed a 100-fold increase in benzyloxyresorufin-O-dealkylase activity, a measure of CYP2B activity, compared to microsomes from vehicle-treated animals [20]. The deviation from racemic (DFR) for the each PCB sample was determined after extraction from the microsomal incubation using different enantioselective columns (Table 2). All PCB congeners displayed a clear, congener specific atropisomeric enrichment. Most importantly, there was excellent agreement between the DFRs obtained on different columns, independent of the resolution. The only notable exception was PCB 136, which appeared to be racemic on the BDM column, but showed clear enrichment of the second eluting atropisomer of PCB 136 on the B20, CB and CD columns. It is currently unclear if this discrepancy is due to co-eluting impurities, the use of the valley drop integration method [26] or other factors.
Table 2.
Deviation from racemic (DFR, see detailed description in the text) for chiral PCBs determined on different enantioselective columns. The last column shows the average of all values ± standard deviation.
| compound | 20B | BDM | BGB | BPM | CB | CD | average |
|---|---|---|---|---|---|---|---|
| PCB 45 | nr | 0.08 | 0.07 | nr | 0.09 | nr | 0.08±0.01 |
| PCB 84 | nr | nr | 0.04 | nr | 0.08 | 0.06 | 0.06±0.02 |
| PCB 91 | 0.13 | 0.07 | 0.10 | nr | 0.06 | 0.07 | 0.09±0.03 |
| PCB 95 | 0.16 | 0.15 | nr | nr | 0.15 | 0.15 | 0.15±0.01 |
| PCB 131 | nr | 0.01 | 0.02 | nr | nr | nr | 0.02±0.01 |
| PCB 132 | 0.14 | nr | 0.12 | 0.11 | nr | 0.11 | 0.12±0.01 |
| PCB 135 | nr | nr | 0.02 | nr | nr | 0.00 | 0.01±0.01 |
| PCB 136 | 0.08 | 0.001 | nr | nr | 0.04 | 0.04 | 0.04±0.03 |
| PCB 149 | 0.09 | 0.06 | 0.03 | 0.07 | 0.03 | 0.03 | 0.05±0.03 |
| PCB 174 | nr | 0.04 | 0.03 | nr | 0.03 | 0.03 | 0.03±0.01 |
| PCB 176 | nr | 0.21 | nr | nr | 0.17 | 0.16 | 0.18±0.03 |
| PCB 183 | nr | nr | 0.03 | nr | nr | nr | 0.03 |
The EF=0.5 for PCB 136 on BDM column was not included in the calculation of average EF value for this congener.
It is interesting to note that the PCB congeners showing the most pronounced atropisomeric enrichment in this study were congeners with different degrees of chlorination. For example, the most distinct atropisomeric enrichment was observed for the heptachlorinated PCB 176 (DFR = 0.18). A slightly less pronounced atropisomeric enrichment was observed for the pentachlorinated PCB 95 (DFR = 0.15) and the hexachlorinated PCB 132 (DFR = 0.12). At the same time, tetrachlorinated PCB 45, the lowest chlorinated chiral PCB congener investigated, showed only a moderate enrichment (DFR = 0.08).
Analysis of the DFR values also suggests some structural features that are associated with a more pronounced atropisomeric enrichment in metabolism studies using microsomes from phenobarbital-treated rat. Typically, PCB congeners containing a 2,3,6 substitution pattern in one phenyl ring displayed the larges DFR values. This can be explained with the availability of unsubstituted 4,5-vicinal positions, which are favorable for PCB metabolism by cytochrome P450 enzymes [40]. However, PCB 135, which also possesses a 2,3,6-substituted phenyl ring, displayed a near racemic signature (DFR = 0.01). At the same time, an atropisomeric enrichment was observed for PCB 183, one of the most persistent PCB congeners [41], with a DFR of 0.03. These findings demonstrate that the atropisomeric enrichment of PCBs in rat liver microsomes prepared from phenobarbital-treated rats is governed by more complex rules than expected based on established structure-activity relationships for the metabolism of PCBs [40].
3.3. Comparison of PCB atropisomer elution order on different columns
Only few studies have reported the elution orders of selected PCB atropisomers on enantioselective gas chromatography columns. The most comprehensive work was performed by Haglund and co-workers, who used pure atropisomers to establish the elution order of PCB atropisomers on the CD column [3,37]. Elution orders were also reported by Konwick et al. for PCB 84, 132 and 174 atropisomers on the BGB column [42] and by Wong et al. for PCB 136 atropisomers on the CB column [43]. Unfortunately, both studies provide no experimental details regarding the determination of the elution order. In the present study, the atropisomerically enriched PCB fractions obtained from microsomal incubations were used to establish the relative elution order of PCB atropisomers on six commonly used chiral gas chromatography columns.
The atropisomer profiles of PCBs 95, 131, 132, 136, 149 and 176 shown in Fig. 1 are representative of the profiles observed on all enantioselective columns resolving the atropisomers of the respective PCB congeners (see also Figs. S1–S3 and S5–S7, Supplementary Material). Consequently, the relative elution orders of these congeners are identical on the different enantioselective columns. A determination of the relative elution order was not possible for PCBs 135 and 183. For PCB 135, a slight atropisomeric enrichment of the first eluting PCB 135 atropisomer was observed on the BGB column, whereas no enrichment relative to the racemic standard was observed on the CD column (Fig. S4, Supplementary Material). PCB 183 was only resolved on the BGB column (Fig. S8, Supplementary Material).
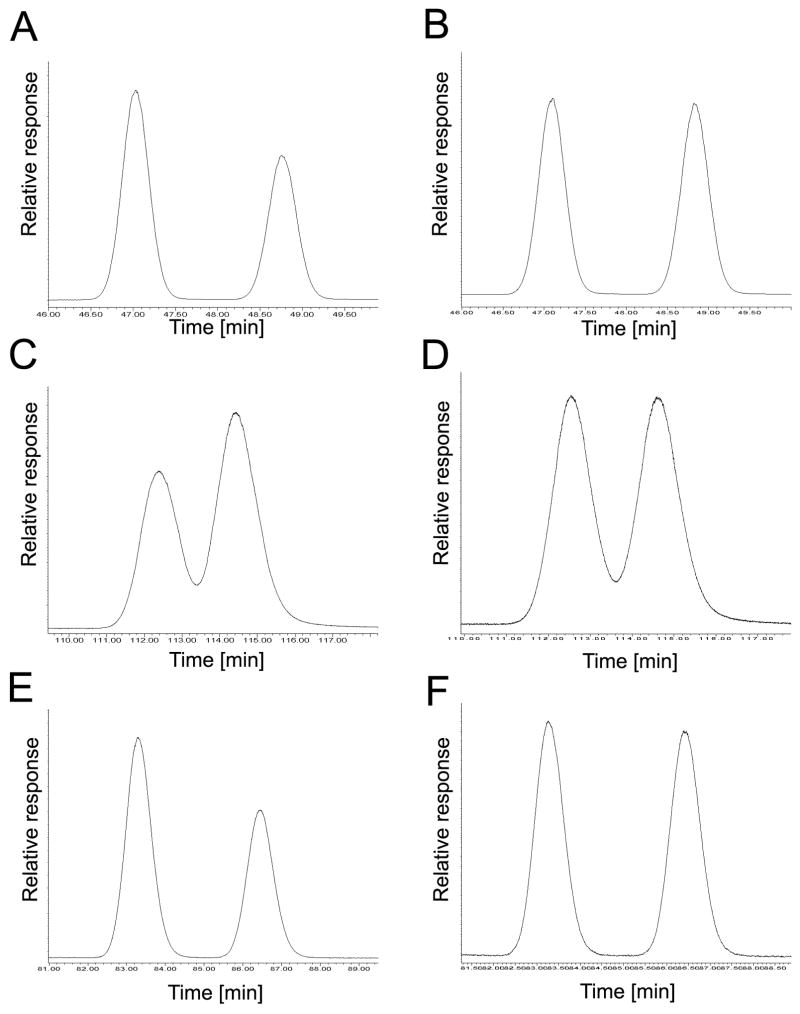
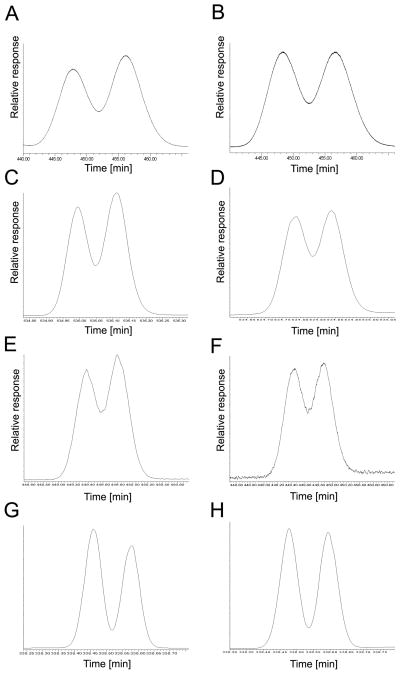
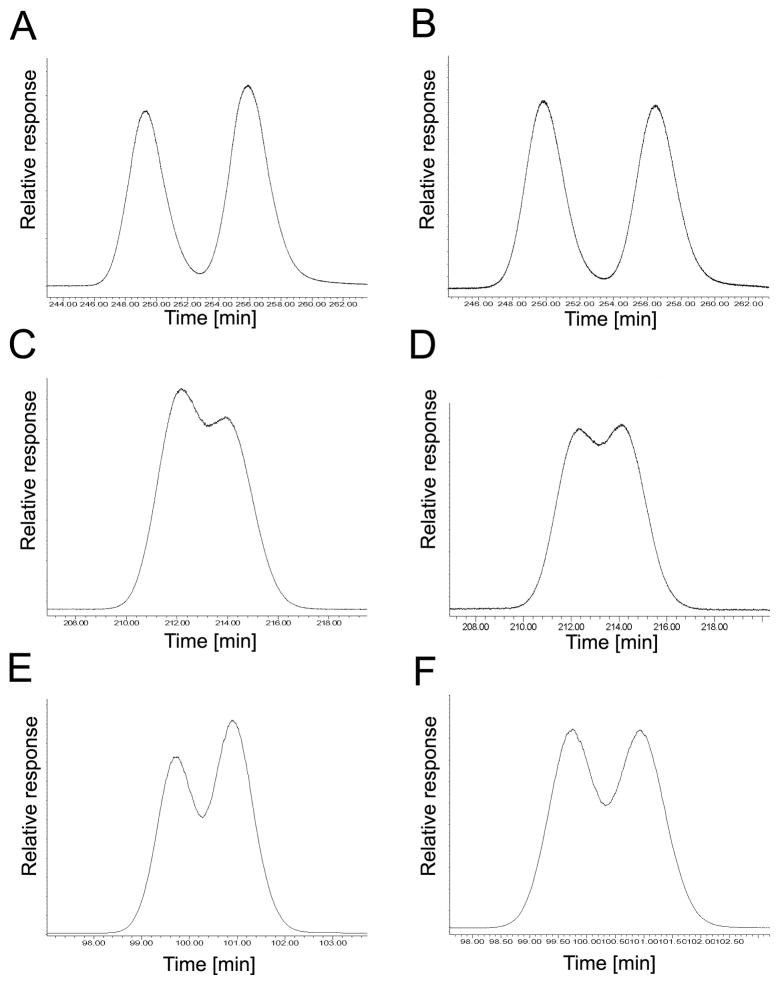
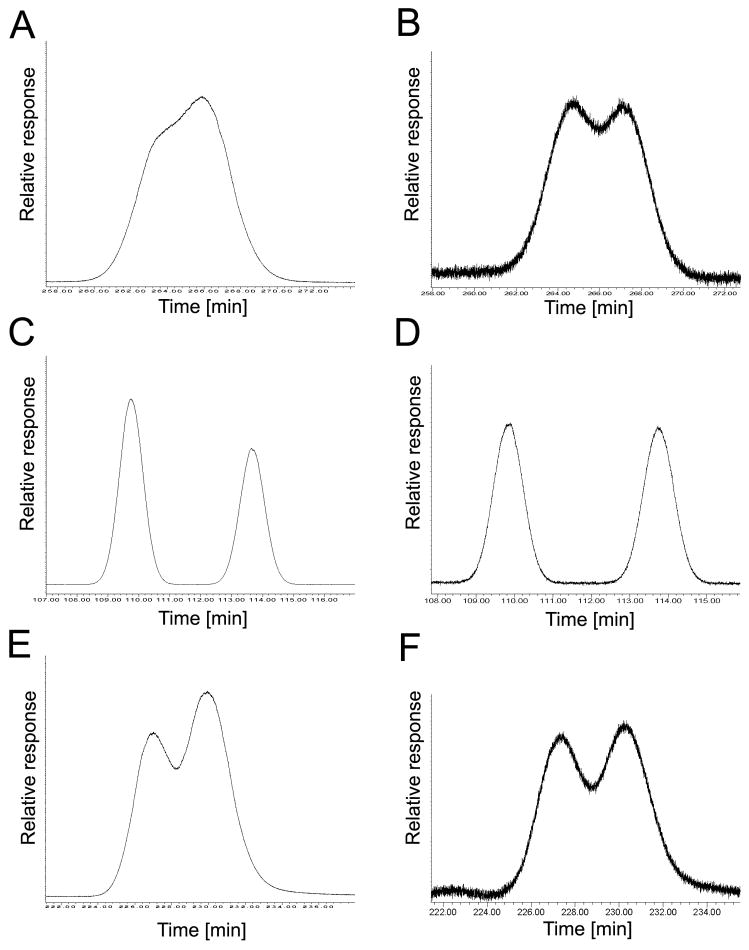
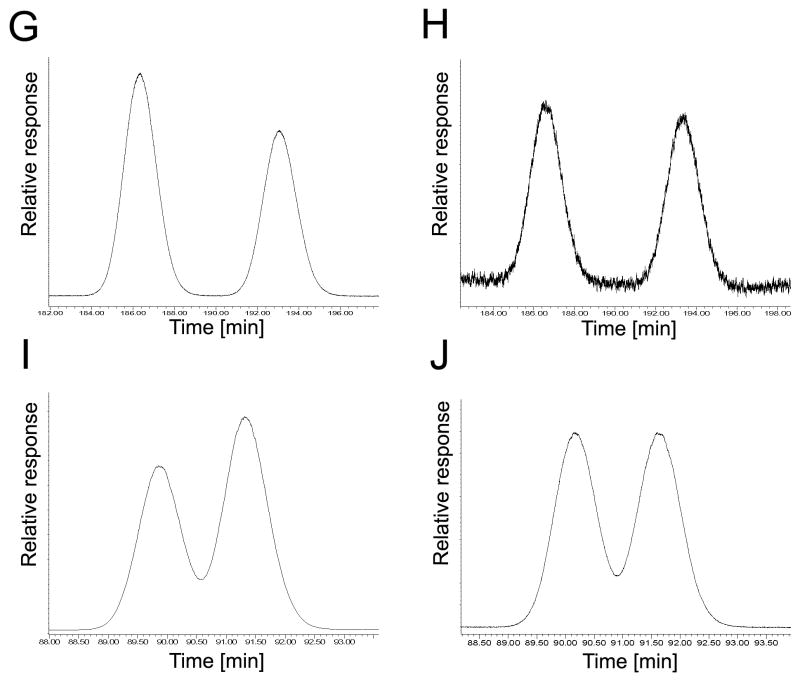
More complex, column-dependent atropisomer profiles were observed for PCBs 45, 84, 91 and 174 (Fig. 3–6). PCB 45, the lowest chlorinated PCB congener investigated, displayed an enantiomeric enrichment of the first eluting atropisomer on the BGM and CB columns (Fig. 3). An inversion of the elution order was observed on the BDM column, as indicated by an enrichment of the second eluting atropisomer. PCB 84 displayed an enrichment of the second eluting atropisomer of the BGB and CD columns (Fig. 4). An inversion of the elution order of PCB 84 atropisomers was observed on the CB column. For PCB 91, the second eluting atropisomer was enriched on the 20B and the BDM columns, with an inversion of the elution order observed on the BGB column (Fig. 5). An inversion of the elution order on the CD column compared to the BDM, BGB and CB column for PCB 174 (Fig. 6). Similarly, inversions of the elution of enantiomers on different enantioselective columns were previously observed for various organochlorine pesticides [44,45], as well as for PCBs [8,16] and their metabolites [20].
Fig. 3.
The elution order of PCB 45 atropisomers on the BDM, BGB and CB columns reveals an inversion in the elution of the atropisomers on the BDM and CB columns compared to the BGB column. (A) Incubation, BDM column, EF = 0.58; (B) racemic standard, BDM column, EF = 0.50; (C) incubation, BGB column, EF = 0.41; (D) racemic standard, BGB column, EF = 0.48; (E) incubation, CB column, EF = 0.59; (F) racemic standard, CB column, EF = 0.50.
Fig. 6.
The elution order of PCB 174 atropisomers on the BDM, BGB, CB and CD columns reveals an inversion in the elution of the atropisomers on the CD column compared to BDM, BGB and CB columns. (A) Incubation, BDM column, EF = 0.44; (B) racemic standard, BDM column, EF = 0.48; (C) incubation, BGB column, EF = 0.45; (D) racemic standard, BGB column, EF = 0.48 (E) incubation, CB column, EF = 0.45; (F) racemic standard, CB column, EF = 0.48; (G) incubation, CD column, EF = 0.55; (H) racemic standard, CD column, EF = 0.50.
Fig. 4.
The elution order of PCB 84 atropisomers on the BGB, CB and CD columns reveals an inversion in the elution of the atropisomers on the CB column compared to BGB and CD columns. (A) Incubation, BGB column, EF = 0.45; (B) racemic standard, BGB column, EF = 0.49; (C) incubation, CB column, EF = 0.54; (D) racemic standard, CB column, EF = 0.46; (E) incubation, CD column, EF = 0.43; (F) racemic standard, CD column, EF = 0.49.
Fig. 5.
The elution order of PCB 91 atropisomers on the 20B, BDM, BGB, CB and CD columns reveals an inversion in the elution of the atropisomers on the BDM and CB columns compared to 20B, BGB and CD. (A) Incubation, 20B column, EF = 0.37; (B) racemic standard, 20B column, EF = 0.50; (C) incubation, BDM column, EF = 0.57; (D) racemic standard, BDM column, EF = 0.50; (E) incubation, BGB column, EF = 0.38; (F) racemic standard, BGB column, EF = 0.48; (G) incubation, CB column, EF = 0.56; (H) racemic standard, CB column, EF = 0.50; (I) incubation, CD column, EF = 0.43; (J) racemic standard, CD column, EF = 0.50.
3.4. Elution order of (+)- and (−)-PCB atropisomers
Another common way to define the elution order of PCB atropisomers is the elution order of the (+)- and (−)-atropisomers. Unfortunately, this approach is limited to congeners for which pure atropisomers have either been isolated [3,37,46] or for which the elution order has been defined otherwise [42,43]. A summary of the respective elution orders determined in the present study is shown in Table 3. Typically, the (−)-PCB atropisomers eluted first on the various enantioselective columns. However, (+)-PCB 84 eluted first on the CB column and (+)-PCB 174 eluted first on the BGB and CD columns. The later finding is in contrast to the elution order of (+)- and (−)-PCB 174 described by Konwick and co-workers [42], who report no inversion of the elution order on the BGB compared to the CD column. Since the authors provide no description of the elution order determination for PCB 174 atropisomers, it is difficult to explain the discrepancy between the present study and the study by Konwick and co-workers.
Table 3.
Elution order of (+)- and (−)-atropisomers of PCBs on different enantioselective gas chromatography columns. Atropisomers shown in bold indicate an inversion in elution order of the atropisomers compared to the CD column.
| Compound | 20B | BDM | BGB | BPM | CB | CD |
|---|---|---|---|---|---|---|
| PCB 84 | nr | nr | (−)/(+)3 | nr | (+)/(−) | (−)/(+)1 |
| PCB 132 | (−)/(+) | nr | (−)/(+)3 | (−)/(+) | nr | (−)/(+)1 |
| PCB 136 | (−)/(+) | unknown | nr | nr | (−)/(+)4 | (−)/(+)1 |
| PCB 149 | (−)/(+) | (−)/(+) | (−)/(+) | (−)/(+) | (−)/(+) | (−)/(+)2 |
| PCB 174 | nr | (−)/(+) | (+)/(−)3,? | nr | (−)/(+) | (+)/(−)1 |
| PCB 176 | nr | (−)/(+) | nr | nr | (−)/(+) | (−)/(+)1 |
| PCB183 | nr | nr | (−)/(+)5 | nr | nr | nr |
Elution order of (+)- and (−)-PCB atropisomers according to Haglund and Wieberg [37].
Elution order of atropisomers of PCB 149 according to Harju and Haglund [3].
Elution order of atropisomers according to Konwick et al. [42]
Elution order of atropisomers of PCB 136 according to Wong et al. [43].
Elution order of atropisomers of PCB 183 according to Toda et al [46].
Previously reported elution of (+)-PCB 174 as first eluting atropisomer does not agree with findings in the current study.
nr = not resolved.
4. Conclusions
It is currently impossible to predict the absolute elution order of PCB atropisomers on enantioselective columns based on their molecular structure because mechanism governing chiral separations on cyclodextrin-based columns are poorly understood. Therefore, the elution order of PCB atropisomers on different columns still needs to be determined experimentally. Unfortunately, pure PCB atropisomer standards are not readily available and, with exception of a few congeners [11,46,47], their absolute configuration has not been established, which makes it challenging to determine both the absolute and relative elution order of PCB atropisomers. Consequently, the elution order of different PCB atropisomers on commonly used enantioselective gas chromatography columns is mostly unknown, which makes it difficult to compare the atropisomeric enrichment reported in different studies.
The present study generated atropisomerically enriched extracts of chiral PCBs using rat liver microsomes to partially overcome these limitations. The enrichment profile of the respective PCB fractions on different columns was then used to establish the relative atropisomer elution order of twelve environmental relevant PCB congeners. Since liver microsomes are readily available, this approach provides a straightforward access to analytical standards useful for the assignment of the relative elution order of PCB atropisomers on different enantioselective columns. Since many chiral environmental contaminants are enantioselectively metabolized by cytochrome P450 enzymes, our approach can be used to establish the relative elution orders of a broad range of compounds. However, future studies need to determine the absolute elution order of PCB atropisomers based on their absolute configuration and establish the molecular basis for enantioselective separations of PCB atropisomers on cyclodextrin-based stationary phases.
Supplementary Material
Fig. 2.
Separation of atropisomers of selected chiral PCBs requires more than one enantioselective gas chromatography column. Representative chromatograms showing the separation of (A) PCB 45 atropisomers on the BGB column; (B) PCB 84 atropisomers on the BGB column; (C) PCB 91 atropisomers on the BGB column; (D) PCB 95 atropisomers on the CD column; (E) PCB 131 atropisomers on the BGB column; (F) PCB 132 atropisomers on the BGB column; (G) PCB 135 atropisomers on the BGB column; (H) PCB 136 atropisomers on the CD column; (I) PCB 149 atropisomers on the BGB column; (J) PCB 174 atropisomers on the BGB column; (K) PCB 176 atropisomers on the CD column; and (L) PCB 183 atropisomers on the BGB column.
Highlights.
Several enantioselective column are needed to separate PCB atropisomers
Elution order of atropisomers changes on different enantioselective phases
Microsomal metabolism can generate atropisomerically enriched PCB fractions
Atropisomer profile can be used to establish elution order of PCB atropisomers
Acknowledgments
We thank Ananya Pramanik for help with the analytical work. The project described was supported by grants ES05605, ES013661 and ES017425 from the National Institute of Environmental Health Sciences/National Institutes of Health.
Role of the funding source
The funding source had no involvement in study design; in the collection, analysis and interpretation of data; in the writing of the report; and in the decision to submit the article for publication.
Footnotes
Publisher's Disclaimer: This is a PDF file of an unedited manuscript that has been accepted for publication. As a service to our customers we are providing this early version of the manuscript. The manuscript will undergo copyediting, typesetting, and review of the resulting proof before it is published in its final citable form. Please note that during the production process errors may be discovered which could affect the content, and all legal disclaimers that apply to the journal pertain.
References
- 1.Garrison AW. Environ Sci Technol. 2006;40:16. doi: 10.1021/es063022f. [DOI] [PubMed] [Google Scholar]
- 2.Kallenborn R, Hühnerfuss H. Chiral environmental pollutants. Springer Verlag; 2001. [Google Scholar]
- 3.Harju MT, Haglund P. Fres J Anal Chem. 1999;364:219. [Google Scholar]
- 4.Schurig V, Reich S. Chirality. 1998;10:316. [Google Scholar]
- 5.Lehmler HJ, Harrad SJ, Hühnerfuss H, Kania-Korwel I, Lee CM, Lu Z, Wong CS. Environ Sci Technol. 2009;44:2757. doi: 10.1021/es902208u. [DOI] [PMC free article] [PubMed] [Google Scholar]
- 6.Magnusson J, Blomberg L, Claude S, Tabacchi R, Saxer A, Schürch S. J Sep Sci. 2000;23:619. [Google Scholar]
- 7.Jaus A, Oehme M. J Chromatogr A. 2001;905:59. doi: 10.1016/s0021-9673(00)00975-4. [DOI] [PubMed] [Google Scholar]
- 8.Wong CS, Garrison AW. J Chromatogr A. 2000;866:213. doi: 10.1016/s0021-9673(99)01104-8. [DOI] [PubMed] [Google Scholar]
- 9.Armstrong DW, Li WY, Pitha J. Anal Chem. 1990;62:214. doi: 10.1021/ac00201a023. [DOI] [PubMed] [Google Scholar]
- 10.Vetter W, Lehnert K, Hottinger G. J Chromatogr Sci. 2006;44:596. doi: 10.1093/chromsci/44.10.596. [DOI] [PubMed] [Google Scholar]
- 11.Haglund P. Chemosphere. 1996;32:2133. [Google Scholar]
- 12.Haglund P. J Chromatogr. 1996;724:219. [Google Scholar]
- 13.Reich S, Schurig V. GIT Special Separation. 1999;14:14. [Google Scholar]
- 14.Buser HR, Muller M. Environ Sci Technol. 1993;27:1211. [Google Scholar]
- 15.Muller M, Buser HR. Anal Chem. 1994;66:2155. [Google Scholar]
- 16.Bordajandi LR, Ramos L, Gonzalez MJ. J Chromatogr A. 2005;1078:128. doi: 10.1016/j.chroma.2005.04.090. [DOI] [PubMed] [Google Scholar]
- 17.Vetter W, Schurig V. J Chromatogr. 1997;774:143. doi: 10.1016/s0021-9673(97)00296-3. [DOI] [PubMed] [Google Scholar]
- 18.Harju A, Bergman A, Olsson M, Roos A, Haglund P. J Chromatogr A. 2003;1019:127. doi: 10.1016/j.chroma.2003.08.102. [DOI] [PubMed] [Google Scholar]
- 19.James MO. In: PCBs: Recent Advances in Environmental Toxicology and Health Effects. Larry LGH, Robertson W, editors. The University Press of Kentucky; Lexington, KY: 2001. p. 35. [Google Scholar]
- 20.Kania-Korwel I, Duffel MW, Lehmler HJ. Environ Sci Technol. 2011;45:9590. doi: 10.1021/es2014727. [DOI] [PMC free article] [PubMed] [Google Scholar]
- 21.Wu X, Pramanik A, Duffel MW, Hrycay EG, Bandiera SM, Lehmler HJ, Kania-Korwel I. Chem Res Toxicol. 2011;24:2249. doi: 10.1021/tx200360m. [DOI] [PMC free article] [PubMed] [Google Scholar]
- 22.Warner NA, Martin JW, Wong CS. Environ Sci Technol. 2009;43:114. doi: 10.1021/es802237u. [DOI] [PubMed] [Google Scholar]
- 23.Lu Z, Wong CS. Environ Sci Technol. 2011;45:8298. doi: 10.1021/es200673q. [DOI] [PubMed] [Google Scholar]
- 24.Kania-Korwel I, Shaikh N, Hornbuckle KC, Robertson LW, Lehmler H-J. Chirality. 2007;19:56. doi: 10.1002/chir.20342. [DOI] [PubMed] [Google Scholar]
- 25.Kania-Korwel I, El-Komy MHME, Veng-Pedersen P, Lehmler HJ. Environ Sci Technol. 2010;44:2828. doi: 10.1021/es901781p. [DOI] [PMC free article] [PubMed] [Google Scholar]
- 26.Asher BJ, D’Agostino LA, Way JD, Wong CS, Harynuk JJ. Chemosphere. 2009;75:1042. doi: 10.1016/j.chemosphere.2009.01.041. [DOI] [PubMed] [Google Scholar]
- 27.Harner T, Wiberg K, Norstrom R. Environ Sci Technol. 2000;34:218. [Google Scholar]
- 28.Jamshidi A, Hunter S, Hazrati S, Harrad S. Environ Sci Technol. 2007;41:2153. doi: 10.1021/es062218c. [DOI] [PubMed] [Google Scholar]
- 29.Reich S, Jimenez B, Marsili L, Hernandez LM, Schurig V, Gonzales MJ. Environ Sci Technol. 1999;33:1787. [Google Scholar]
- 30.Chu S, Covaci A, Schepens P. Environ Res. 2003;93:167. doi: 10.1016/s0013-9351(03)00016-1. [DOI] [PubMed] [Google Scholar]
- 31.Wong CS, Mabury SA, Whittle DM, Backus SM, Teixeira C, Devault DS, Bronte CR, Muir DCG. Environ Sci Technol. 2004;38:84. doi: 10.1021/es0346983. [DOI] [PubMed] [Google Scholar]
- 32.Hu D, Lehmler HJ, Martinez A, Wang A, Hornbuckle KC. Atmos Environ. 2012;44:1550. doi: 10.1016/j.atmosenv.2010.01.006. [DOI] [PMC free article] [PubMed] [Google Scholar]
- 33.Wayman GA, Bose DD, Yang D, Lesiak A, Bruun D, Impey S, Ledoux V, Pessah IN, Lein PJ. Environ Health Perspect. 2012;120:1003. doi: 10.1289/ehp.1104833. [DOI] [PMC free article] [PubMed] [Google Scholar]
- 34.Wayman GA, Yang D, Bose DD, Lesiak A, Ledoux V, Bruun DA, Pessah IN, Lein PJ. Environ Health Perspect. 2012;120:997. doi: 10.1289/ehp.1104832. [DOI] [PMC free article] [PubMed] [Google Scholar]
- 35.Kania-Korwel I, Barnhart CD, Stamou M, Truong KM, El-Komy MH, Lein PJ, Veng-Pedersen P, Lehmler HJ. Environ Sci Technol. 2012;46:11393. doi: 10.1021/es302810t. [DOI] [PMC free article] [PubMed] [Google Scholar]
- 36.Vetter W. Food Rev Int. 2001;17:113. [Google Scholar]
- 37.Haglund P, Wiberg K. J High Resol Chromatogr. 1996;19:373. [Google Scholar]
- 38.Duignan D, Sipes I, Leonard T, Halpert J. Arch Biochem Biophys. 1987;255:290. doi: 10.1016/0003-9861(87)90396-1. [DOI] [PubMed] [Google Scholar]
- 39.Waller SC, He YA, Harlow GR, He YQ, Mash EA, Halpert JR. Chem Res Toxicol. 1999;12:690. doi: 10.1021/tx990030j. [DOI] [PubMed] [Google Scholar]
- 40.Schnellmann RG, Vickers AEM, Sipes IG. In: Reviews in Biochemical Toxicology. Hodgson BJRE, Philpot RM, editors. Elsevier; New York, Asterdam, Oxford: 1985. p. 247. [Google Scholar]
- 41.Hansen LG. In: PCBs Recent advances in environmental toxicology and heath effects. Robertson HLGLW, editor. University Press of Kentucky; Lexington: 2001. [Google Scholar]
- 42.Konwick BJ, Garrison AW, Blanck MC, Avants JK, Fisk AT. Environ Sci Technol. 2006;40:2930. doi: 10.1021/es0600678. [DOI] [PubMed] [Google Scholar]
- 43.Wong CS, Garrison AW, Foreman WT. Environ Sci Technol. 2001;35:33. doi: 10.1021/es0012570. [DOI] [PubMed] [Google Scholar]
- 44.Jantunen LM, Bidleman TF. Arch Environ Contam Toxicol. 1998;35:218. doi: 10.1007/s002449900370. [DOI] [PubMed] [Google Scholar]
- 45.Ulrich EM, Hites RA. Environ Sci Technol. 1998;32:1870. [Google Scholar]
- 46.Toda M, Matsumura C, Tsurukawa M, Okuno T, Nakano T, Inoue Y, Mori T. J Phys Chem A. 2012:9340–9346. doi: 10.1021/jp306363n. [DOI] [PubMed] [Google Scholar]
- 47.Kania-Korwel I, Hrycay EG, Bandiera S, Lehmler HJ. Chem Res Toxicol. 2008;21:1295. doi: 10.1021/tx800059j. [DOI] [PMC free article] [PubMed] [Google Scholar]
Associated Data
This section collects any data citations, data availability statements, or supplementary materials included in this article.


