Abstract
Müller cells are mainly involved in controlling extracellular homeostasis in the retina, where intense neural activity alters ion concentrations and osmotic gradients, thus favoring cell swelling. This increase in cell volume is followed by a regulatory volume decrease response (RVD), which is known to be partially mediated by the activation of K+ and anion channels. However, the precise mechanisms underlying osmotic swelling and subsequent cell volume regulation in Müller cells have been evaluated by only a few studies. Although the activation of ion channels during the RVD response may alter transmembrane potential (Vm), no studies have actually addressed this issue in Müller cells. The aim of the present work is to evaluate RVD using a retinal Müller cell line (MIO-M1) under different extracellular ionic conditions, and to study a possible association between RVD and changes in Vm. Cell volume and Vm changes were evaluated using fluorescent probe techniques and a mathematical model. Results show that cell swelling and subsequent RVD were accompanied by Vm depolarization followed by repolarization. This response depended on the composition of extracellular media. Cells exposed to a hypoosmotic solution with reduced ionic strength underwent maximum RVD and had a larger repolarization. Both of these responses were reduced by K+ or Cl− channel blockers. In contrast, cells facing a hypoosmotic solution with the same ionic strength as the isoosmotic solution showed a lower RVD and a smaller repolarization and were not affected by blockers. Together, experimental and simulated data led us to propose that the efficiency of the RVD process in Müller glia depends not only on the activation of ion channels, but is also strongly modulated by concurrent changes in the membrane potential. The relationship between ionic fluxes, changes in ion permeabilities and ion concentrations –all leading to changes in Vm– define the success of RVD.
Introduction
Glial cells in the sensory retina (Müller cells) are mainly involved in controlling osmotic and ionic homeostasis [1], [2]. During intense neuronal activity, retinal cells can be surrounded by a hypoosmotic environment, since light-evoked changes in the ionic composition of the extracellular fluid cause a decrease in osmolarity, thus favoring glial swelling [3]. In most cell types this increase in cell volume is followed by a regulatory volume decrease response (RVD) partially mediated by the activation of K+ and anion channels [4], [5], [6]. However, only a few studies have evaluated the mechanisms underlying cell volume regulation in Müller cells [7], [8]. It has been reported that Müller cells in situ show an effective control of cell volume, that prevents cell swelling, probably due to the presence of K+ channels Kir 4.1. The expression of these channels is altered in different pathologies such as retinal ischemia, ocular inflammation and diabetes, as well as in organ cultures [9], [10], [11], [12].
Changes in the extracellular ion composition of the retina during neural activity also cause changes in transmembrane potential (Vm) and in the chemical gradients of most of the ions that determine RVD. In addition, the activation of ion channels during RVD may also alter Vm. However, to our knowledge, no studies have investigated the putative link between cell volume regulation and Vm in these cells.
The channels involved in the RVD response have been studied in different cell types, usually by evaluating changes in cell volume with and without blockers. The identification and characterization of these channels is typically performed through excised or whole cell patch clamp studies [13], [14], [15]. Though these methods undeniably offer important and reliable information on conductance changes during cell swelling, they fail to do so during cell volume regulation, since they do not preserve cell membrane integrity nor intracellular medium composition. This could explain the reason why only a few reports have been able to evaluate the RVD response in a more physiological context [16], [17], [18].
The aim of the present work is to characterize, for the first time, the RVD response in a retinal Müller cell line (MIO-M1) under different extracellular ionic conditions and to evaluate a possible association between RVD and changes in Vm. Cell volume and Vm changes were measured using fluorescent probe techniques. We also developed a mathematical model that provides information on electrochemical ion gradients and solutes fluxes during the RVD response.
Our results show that cell swelling and subsequent RVD is accompanied by Vm depolarization followed by repolarization. However, this RVD response depends closely on the composition of extracellular media. Although K+ and Cl− channels do play an important role in the RVD response of these cells, their contribution is evident only if a significant driving force for KCl efflux is present.
Materials and Methods
Cell Cultures
The MIO-M1 cell line (kindly provided by Dr. Astrid Limb, University College London, London, UK) is a spontaneously immortalized retinal Müller glial cell line, originated from human retina, that retained many characteristics of Müller cells [19]. Cells were grown as monolayers in the presence of Dulbecco’s Modified Eagle Medium (DMEM)/glutamax supplemented with 10% fetal calf serum (FCS), containing 5 µg/ml streptomycin and 5 U/ml penicillin at 37°C in a humidified atmosphere containing 5% CO2. Cells were routinely subcultured every week, and those to be studied were grown on coverslips during 3–4 days before recording.
Solutions and Chemicals
Two different isoosmotic solutions were employed: 1- NaCl solution (ISONaCl) and 2- Mannitol solution (ISOMannitol), in which 50 mM NaCl were replaced with 100 mM Mannitol (Table 1). Hypoosmotic solutions were prepared from each isoosmotic solution by the removal of either NaCl (HYPONaCl) or Mannitol (HYPOMannitol), thus varying ion composition in the first case, or keeping it constant in the second (Table 1). Cells were set in an external isoosmotic solution for at least 10 minutes, and then a hypoosmotic shock was induced. All solutions were titrated to pH 7.40 using NaOH (Sigma-Aldrich), and osmolalities were routinely measured by a pressure vapor osmometer (Wescor).
Table 1. Ionic composition of experimental external solutions.
| Composition | ISONaCl | HYPONaCl | ISOMannitol | HYPOMannitol |
| NaCl (mM) | 126 | 76 | 70 | 70 |
| KCl (mM) | 5.5 | 5.5 | 5.5 | 5.5 |
| CaCl2 (mM) | 2.5 | 2.5 | 2.5 | 2.5 |
| MgCl2 (mM) | 1.25 | 1.25 | 1.25 | 1.25 |
| Hepes (mM) | 20 | 20 | 20 | 20 |
| Glucose (mM) | 10 | 10 | 10 | 10 |
| Mannitol (mM) | 0 | 0 | 100 | 0 |
Osmolarity (mOsM,  ±SEM) ±SEM) |
299±2 | 200±2 | 293±2 | 195±1 |
In some experiments 10−3 M BaCl2 (vehicle: water) or 10−4 M 5-Nitro-2-(3-phenylpropylamino) benzoic acid (NPPB; vehicle: DMSO) were added to iso- and hypoosmotic solutions, and cells were pre-incubated in isoosmotic extracellular solutions containing blockers or vehicles for 10 minutes.
2′,7′-Bis(2-carboxyethyl)-5(6)-carboxyfluorescein-acetoxymethylester (BCECF-AM, 3.2 mM, Molecular Probes) and bis-(1,3-dibutylbarbituric acid)trimethine oxonol (DIBAC4(3), 0.6 mM, Molecular Probes) stock solutions were dissolved in DMSO and stored at −20°C until used.
Measurement of Cell Volume Changes and RVD Response
MIO-M1 cells grown on coverslips were mounted on a chamber and loaded with 6 µM BCECF-AM for 30 minutes at 20°C. The chamber was then placed on the stage of a Nikon TE-200 epifluorescence inverted microscope (Nikon Planfluor 40X oil immersion objective lens) as previously described [20]. Fluorescence intensity was recorded by exciting BCECF at the isosbestic point (440 nm), where the fluorochrome is pH insensitive. Fluorescence data were acquired every 10 seconds using a charge coupled device camera (Hamamatsu C4742-95) connected to a computer with the Metafluor acquisition program (Universal Imaging Corporation, PA). The procedure used to estimate cell water volume was similar to the one previously described [20], [21]. Changes in cell volume can be calculated as follows:
 |
(1) |
where V is cell volume at time t; V0 is cell volume at t = 0; F0 represents the signal obtained from a small region of the cell (pinhole), when placed in equilibrium with an isoosmotic medium with an osmolality OsM0; Ft is the fluorescence from the same region at time t, when placed in equilibrium with a solution with an osmolality of OsMt and fb is the relative background. This parameter corresponds to the y intercept of a plot of Ft/F0 versus OsM0/OsMt, which represents relative fluorescence in the absence of osmolality changes.
RVD after cell exposure to a hypoosmotic medium was calculated by the following equation:
 |
(2) |
where (V/V0)max is the maximal value of V/V0 attained during hypoosmotic swelling (peak), and (V/V0)t represents the value of V/V0 observed at time t. RVDt thus denotes the magnitude of volume regulation at time t, with 100% RVD indicating complete volume regulation and 0% RVD indicating no volume regulation.
Measurement of Membrane Voltage Changes
Transmembrane potential was measured using DIBAC4(3), a slow response anionic dye which emission has previously been shown to be independent of cell volume changes [22]. The intracellular concentration of DIBAC4(3) depends on Vm following a Nernstian distribution [23], [24]. Cells were loaded with 2.5 µM DIBAC4(3) for 15 minutes at 20°C and placed on the stage of the same microscope described in the previous section. Excitation wavelength was 490 nm. Emitted light (above 520 nm) was recorded at 10 second intervals. Fluorescence intensity was monitored until it reached a stable value before starting the experiments. Fluorescence intensity changes after interventions were relativized to stationary values (Ft/F0) and data were corrected for background noise and drift. Calibration was made by adding 5 µM gramicidin and 2.5 µM DIBAC4(3) to solutions containing different concentrations of NaCl replaced with N-Methyl-D-glucamine chloride (NMDGCl) (Figure 1). Vm was calculated as:
| (3) |
Figure 1. Calibration of voltage sensitive dye DIBAC4(3) in MIO-M1 cells.
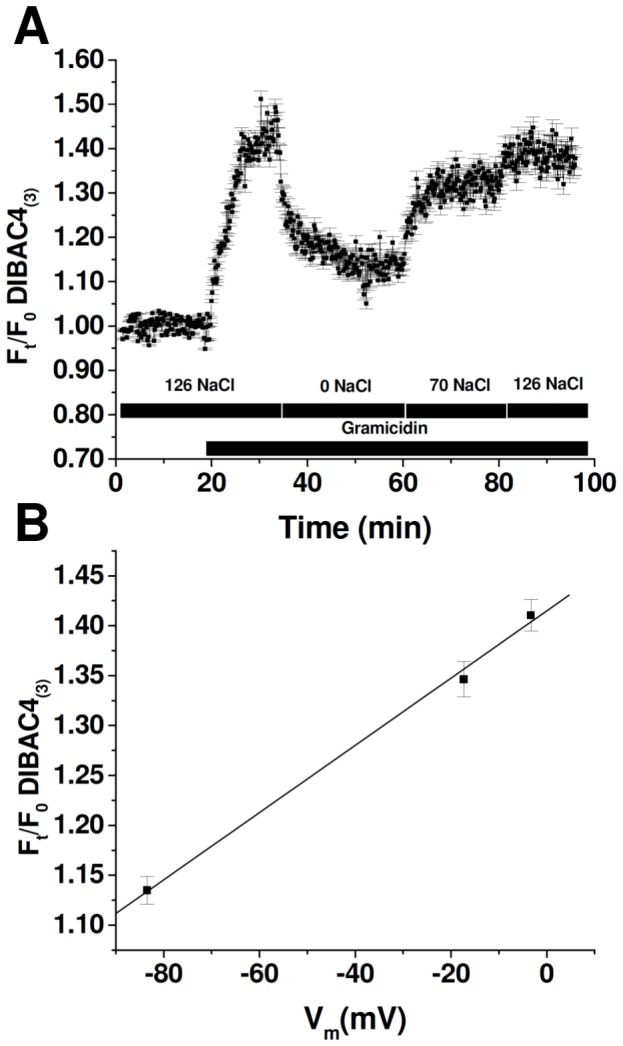
A- Representative experiment showing the response of cells previously loaded with 2.5 µM DIBAC4(3) for 15 minutes, exposed to different extracellular concentrations of NaCl. Points represent changes in fluorescence intensity relativized to the stationary values, in the absence of gramicidin (Ft/F0 DIBAC4(3)). When a stable signal was registered, control solution was replaced by a solution containing 5 µM gramicidin. Afterwards, extracellular NaCl concentration was replaced (0 mM, 70 mM and 126 mM). B- Relation between relative changes in fluorescence and membrane potential calculated from Equation 3.
Intracellular concentrations of Na+ and K+ where assumed to be 18 mM and 132 mM, respectively. Three extracellular NaCl concentrations were tested, 126 mM, 70 mM and 0 mM, corresponding to membrane potentials of −3.32 mV, −17.33 mV and −83.47 mV, respectively. A 1% change in fluorescence corresponds to a Vm variation of 2.2 mV, as calculated from the mean calibration curve (0.0045±0.002,  ±SD, n = 58).
Osmotic Swelling and RVD Response Modeling
Cell volume and Vm changes were simulated by using a mathematical model that implies the following assumptions:
Cells are non-polarized and cell membrane surface area available for solute and water transport (Ac) remains constant, regardless of cell volume changes.
The composition of extracellular solution remains constant, unless the solution is changed to induce an osmotic shock. Cell swelling occurs due to transmembrane water flux driven by osmotic gradients across the membrane.
Intracellular osmolarity is determined by the sum of Na+, K+, Cl−, and impermeant anions (Xi) concentrations. The value of the mean charge (z) of Xi is assumed to be the one that fulfils the electroneutral condition (≅−1).
The membrane contains channels that allow the diffusive flux of ions (Na+, K+, and Cl− channels) and water (Aquaporins). To achieve a stationary condition, passive ion fluxes are assumed to be compensated by opposing active fluxes that do not balance those generated during RVD. Active fluxes were assumed to be constant since several previous reports demonstrated that short-term volume regulation is not affected by them [25], [26].
RVD response is achieved by an increase in K+ and/or Cl− permeabilities with a latency (τ) that was arbitrarily determined to be 20 s after the initiation of swelling. Increases in ion permeabilities develop in a time-dependent exponential manner according to:
| (4) |
Where Piont is ion permeability at time t, Pionmax is the maximum permeability achieved during RVD and Pioninit is the initial permeability (Table 2). tinit is the time at which permeability changes start and τp is a time constant (90 s) [27].
Table 2. Values of parameters used in simulations.
| Parameter | NaCl | Mannitol | Units |
| Cell Parameters | |||
| Vcell | 1×10⁻⁸ | 0.945×10⁻⁸ | cm3 |
| Ac | 2×10⁻⁵ | 2×10⁻⁵ | cm2 |
| PNa | 1××10−7 | 1×10⁻⁷ | cm.s−1 |
| PK | 2×10⁻⁶ | 2×10⁻⁶ | cm.s−1 |
| PKmax | 6×10⁻⁶ | 6×10⁻⁶ | cm.s−1 |
| PCl | 5×10⁻⁷ | 5×10⁻⁷ | cm.s−1 |
| PClmax | 5×10⁻⁶ | 5×10⁻⁶ | cm.s−1 |
| Pf | 1.5×10⁻² | 1.5×10⁻² | cm.s−1 |
| [Na]i | 0.184×10⁻⁴ | 0.195×10⁻⁴ | mol.cm−3 |
| [K] i | 1.32×10⁻⁴ | 1.31×10⁻⁴ | mol.cm−3 |
| [Cl] i | 0.291×10⁻⁴ | 0.226×10⁻⁴ | mol.cm−3 |
| [X] i | 1.10×10⁻⁴ | 1.16×10⁻⁴ | mol.cm−3 |
| Vm | −6.31×10⁻² | −6.71×10⁻² | Volts |
| τ | 20 | 20 | s (post-shock) |
| Isosmotic Solution | |||
| [Na]o | 1.26×10⁻⁴ | 0.76×10⁻⁴ | mol.cm−3 |
| [K]o | 0.055×10⁻⁴ | 0.055×10⁻⁴ | mol.cm−3 |
| [Cl]o | 1.315×10⁻⁴ | 0.815×10⁻⁴ | mol.cm−3 |
| [X]o | 0.27×10⁻⁴ | 1.27×10⁻⁴ | mol.cm−3 |
| Hyposmotic Solution | |||
| [Na]o | 0.76×10⁻⁴ | 0.76×10⁻⁴ | mol.cm−3 |
| [K]o | 0.055×10⁻⁴ | 0.055×10⁻⁴ | mol.cm−3 |
| [Cl]o | 0.82×10⁻⁴ | 0.815×10⁻⁴ | mol.cm−3 |
| [X]o | 0.27×10⁻⁴ | 0.27×10⁻⁴ | mol.cm−3 |
Data were obtained either from our own measurements in MIO-M1 cells or from literature, as follows: i- Vcell and Ac in isotonic conditions were estimated from confocal images as previously reported [43]; ii- Pf was obtained from the measured cell volume changes during a hypoosmotic challenge using a modification of the Fick’s law [20]; iii- Vm corresponds to the value recorded using sharp electrode patch clamp technique by Limb et al [19]; iv- intracellular Na+, K+ and Cl− concentration are the typical values for most cell types; v- extracellular Na+, K+ and Cl− concentrations are the same as in experimental solutions; vi- ion permeabilities were chosen in order to obtain the Vm value of MIO-M1 cells; vii- the initial parameters presented for the Mannitol condition were obtained by simulating an extracellular solution change, from ISONaCl to ISOMannitol (see Materials and Methods section).
Mathematical model
Considering the assumptions indicated above, and given the initial values detailed in Table 2, the values for intracellular Na+ mass (mNa), K+ mass (mK), Cl− mass (mCl), osmotically active cell volume (Vcell) and Vm were computed at each iteration step (0.1 seconds). Equilibrium potentials (Eq) were calculated by using the Nernst equation:
| (5) |
Where R is the gas constant, T is the absolute temperature in Kelvin, F is the Faraday constant and [Ion]o is the external concentration of the ion in question.
Vm was determined by the Goldman-Hodgkin-Katz equation:
| (6) |
Diffusive fluxes (Jion) were given by [28], [29]:
| (7) |
Where  , and
, and  , and a negative value of J
ion indicates an outward flux. Furthermore, the time courses of mNa, mK and mCl were given by:
| (8) |
And from Fick’s law of diffusion, the variation rate of Vcell is:
| (9) |
Where Vw is the partial molar volume of water, Pf is the osmotic water permeability of the membrane and [X]o is the concentration of external impermeable solutes.
Numerical methods and simulation conditions
Equations 8 and 9 were integrated numerically by the Euler method with a time step of 0.1 seconds. Total simulated time was 2,400 seconds. At each iteration step, Vm and Eq for Na+, K+, and Cl− were calculated by equations 6 and 5, respectively. External osmolarity was made hypoosmotic by two different approaches: 1- Reducing NaCl concentration (HYPONaCl), or 2- Reducing the concentration of external impermeable solutes (Xo, e.g. Mannitol, HYPOMannitol). Afterwards, both conditions were simulated (Table 2):
NaCl: External isoosmotic solution contains 1.26×10⁻⁴ mol.cm−3 NaCl (290 mOsM). Hypoosmotic shock was achieved by reducing external NaCl concentration to 0.76×10⁻⁴ mol.cm−3 (190 mOsM).
Mannitol: Initial parameters were obtained by simulating the change of extracellular solutions, from ISONaCl to ISOMannitol. In this condition, external isoosmotic solution contains 0.76×10⁻⁴ mol.cm−3 NaCl and 1.27×10⁻⁴ mol.cm−3 of an impermeable non-charged solute (Xo) (290 mOsM). Hypoosmotic shock was achieved by reducing external Xo concentration to 0.27×10⁻⁴ mol.cm−3 (190 mOsM).
Once external solutions were changed, cells were subjected to RVD activation after a latency (τ) of 20 seconds (post solution change).
Statistics
Values are reported as mean ± SEM, and n is the number of cells evaluated in each condition. Student’s t Test for unpaired data was used according to the protocol; p<0.05 was considered a significant difference.
Results
Effect of Extracellular Media Composition on RVD Response in MIO-M1 Cells
We first characterized RVD response in MIO-M1 cells exposed to a hypoosmotic shock, generated, either varying or keeping constant ion composition (HYPONaCl or HYPOMannitol, respectively). Figure 2 shows the time course of relative cell volume changes (V/V0) in response to these hypoosmotic gradients (ΔOsM = 100 mOsM). Though in both conditions cells respond to the hypoosmotic challenge with rapid swelling and thereafter exhibit RVD, kinetics were quite different in each case. In cells faced with HYPONaCl, cell volume is restored more rapidly, as compared to HYPOMannitol experiments. Indeed, the percentage of RVD at 10 minutes (% RVD10) is significantly higher with the HYPONaCl solution (Figure 2 insert). These results indicate that although MIO-M1 cells respond to cell swelling by triggering RVD, the magnitude of this response depends on extracellular media composition.
Figure 2. Effects of extracellular media composition on RVD in MIO-M1 Cells.
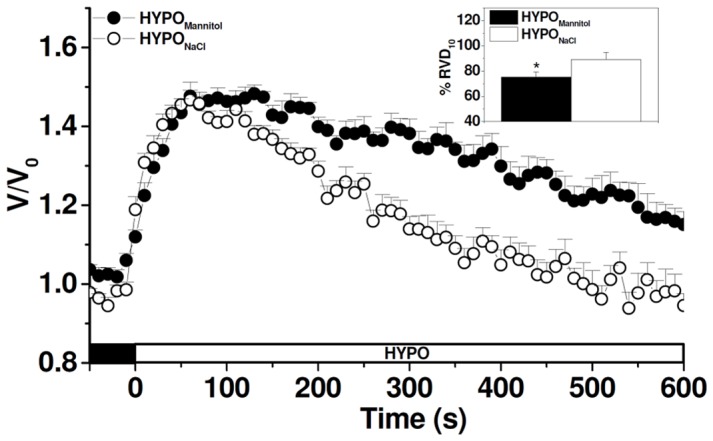
Representative kinetics of cell volume changes measured in BCECF-loaded MIO-M1 cells in response to hypoosmotic shock (ΔOsM = 100 mOsM) generated either by varying (HYPONaCl) or keeping constant extracellular ion composition (HYPOMannitol). Insert: Percentage of cell volume recovery at 10 minutes (% RVD10) in both conditions. Values are mean ± SEM for 42–55 cells from 15 experiments, *p<0.05, HYPOMannitol vs. HYPONaCl.
Since RVD is known to be attained by the activation of K+ and Cl− conductances in most mammalian cell types [30], we further investigated RVD response in the presence of volume-sensitive Cl− channels blockers (NPPB) or K+ channels blockers (Ba2+), using cells exposed alternatively to either external media. Figure 3 illustrates that, in the presence of Ba2+, the time course of relative cell volume changes is not affected in MIO-M1 cells exposed to HYPOMannitol (A) while it is significantly retarded in cells faced with HYPONaCl (B). Thus, RVD is significantly decreased by Ba2+ only when external NaCl concentration varies (HYPONaCl) (C). Similar results are observed in the presence of the volume-sensitive Cl− channels blocker NPPB (Figure 4A–C). These results clearly indicate that K+ and Cl− channels are involved in the RVD response of MIO-M1 cells; however, their participation is evident only under certain experimental conditions.
Figure 3. Role of Ba2+- sensitive K+ channels on RVD in MIO-M1 Müller cells.
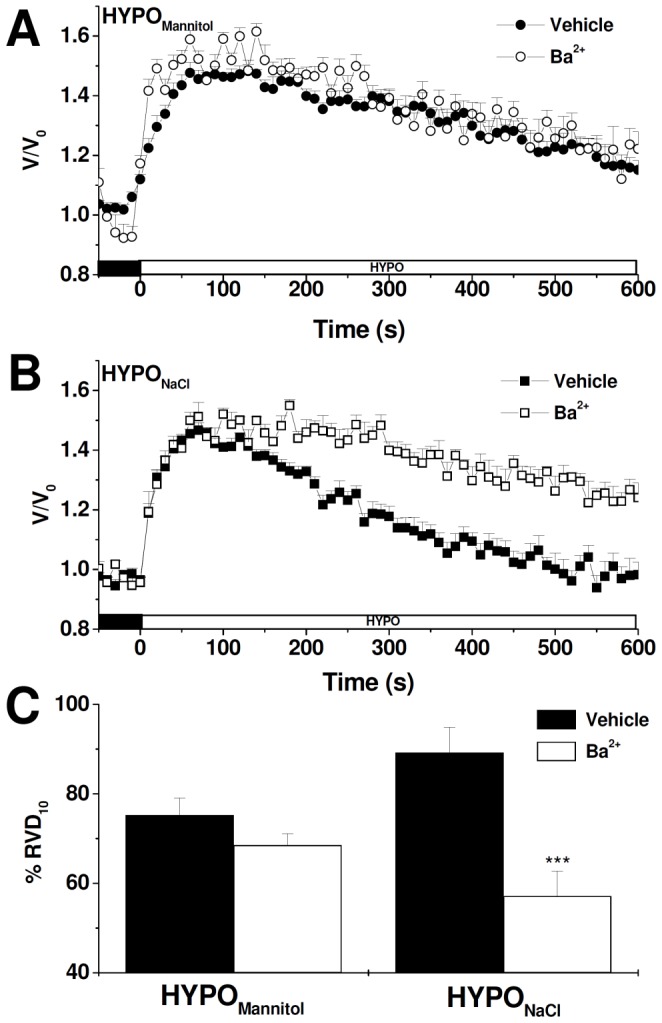
Representative cell volume changes measured in BCECF-loaded MIO-M1 cells in response to a hypoosmotic shock (ΔOsM = 100 mOsM) generated either keeping constant (HYPOMannitol) (A) or varying ion composition (HYPONaCl) (B). In all the experiments 10−3 M Ba2+ or vehicle (water) was added to ISONaCl or ISOMannitol 10 minutes before the hypoosmotic shock and maintained during the entire experiment. C- % RVD10 after the hypoosmotic challenge in vehicle or Ba2+ treated cells. Values are mean ± SEM for 21–80 cells from 5–9 experiments, ***p<0.001, Vehicle vs. Ba2+.
Figure 4. Role of NPPB-sensitive Cl− channels on RVD in MIO-M1 cells.
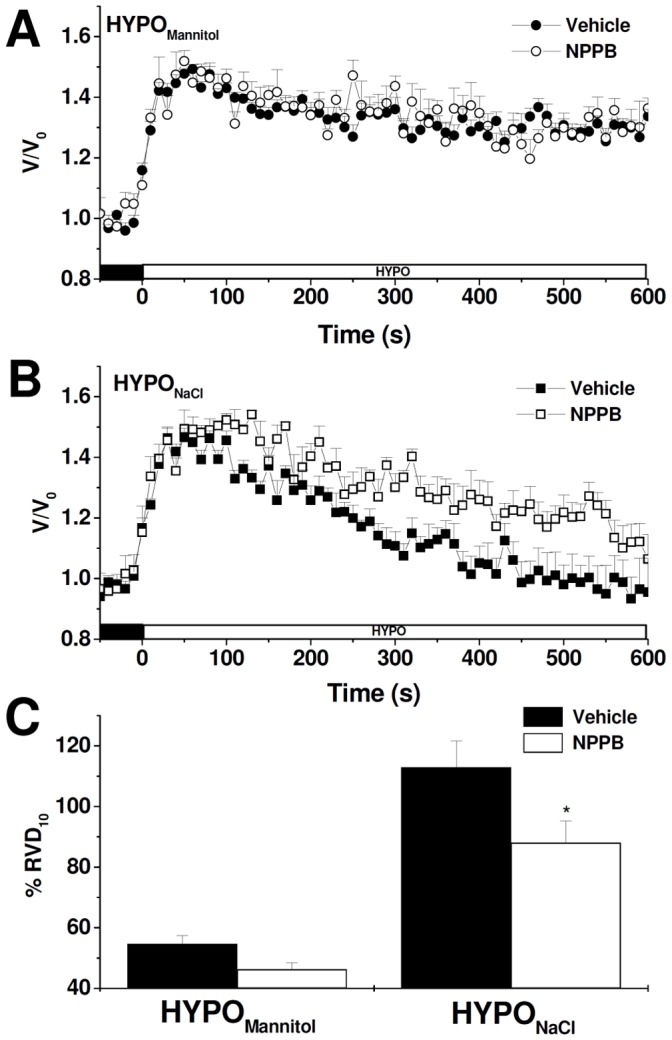
Representative cell volume changes measured in BCECF-loaded MIO-M1 cells in response to a hypoosmotic shock (ΔOsM = 100 mOsM) generated either keeping constant (HYPOMannitol) (A) or varying ion composition (HYPONaCl) (B). In all the experiments 10−4 M NPPB or vehicle (DMSO) was added to ISONaCl or ISOMannitol 10 minutes before the hypoosmotic shock and maintained during the entire experiment. C- % RVD10 after the hyposmotic challenge in DMSO or NPPB treated cells. Values are mean ± SEM for 28–76 cells from 5–13 experiments, *p<0.05, Vehicle vs. NPPB.
Effect of Extracellular Medium Composition on Vm during a Hypoosmotic Challenge in MIO-M1 Cells
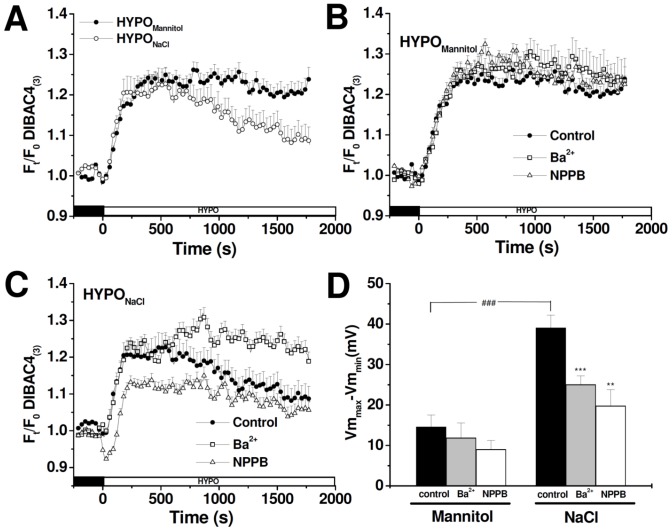
In this set of experiments, we evaluated Vm after a hypoosmotic shock (ΔOsM = 100 mOsM) generated either varying or keeping a constant extracellular ion composition, and using the potentiometric dye DIBAC4(3). Figure 5A shows the time course of fluorescence changes (Ft/F0). The response in both conditions consists of an initial depolarization followed by a partial repolarization. The magnitude of this repolarization is assessed as the difference between peak maximum Vm and Vm 30 minutes after exposure to a hypoosmotic media (Vmmax−Vmmin). As seen in Figure 5D, repolarization is significantly larger in the HYPONaCl condition than in the HYPOMannitol condition.
Figure 5. Vm evolution after a hypoosmotic shock in MIO-M1 cells.
Vm was monitored using DIBAC4(3) under different experimental conditions. A–Vm changes measured in response to a hypoosmotic shock (ΔOsM = 100 mOsM) generated either by varying (HYPONaCl) or keeping constant ion composition (HYPOMannitol). Effect of 10−3 M Ba2+ and 10−4 M NPPB on Vm changes under HYPOMannitol (B) or under HYPONaCl conditions (C). D- Bars indicating the difference between the peak maximum Vm and the Vm 30 minutes after being exposed to a hypoosmotic media (Vmmax−Vmmin) obtained after the hypoosmotic shock under each experimental condition. This value indicates the degree of repolarization after the initial swelling-induced depolarization. Values are mean ± SEM for 21–46 cells from 3–7 experiments, ###p<0.001, NaCl vs. Mannitol; ***p<0.001, Ba2+ vs. Control, **p<0.01, NPPB vs. Control.
We then evaluated whether Ba2+ or NPPB treatments affect Vm before and after the hypoosmotic shock. When Ba2+ is added to cells exposed to isoosmotic solutions (Mannitol or NaCl), Vm depolarizes (ΔVm = 50±3 mV, n = 57), thus indicating that EqK is negative in relation to Vm. In contrast, the addition of NPPB induces hiperpolarization of Vm (ΔVm = −53±1.4 mV, n = 128), thus indicating that EqCl is positive in relation to Vm. These changes in resting Vm suggest that Ba+2-sensitive K+ channels and NPPB-sensitive Cl− channels contribute to resting potential. Interestingly, after the osmotic shock, the presence of Ba2+ or NPPB does not affect the magnitude of repolarization in HYPOMannitol, but does significantly reduce Vm repolarization in the HYPONaCl condition (Figure 5B–D).
These results, together with those from the previous section, suggest that there may be an interplay between RVD and Vm repolarization, and that both depend on extracellular media composition.
Simulation of Cell Volume and Vm Changes under Different Extracellular Ion Composition
A mathematical model was designed to investigate why RVD and Vm changes differ between cells exposed to a hypoosmotic challenge (ΔOsM = 100mOsM) by varying NaCl composition or by removing mannitol (and thus unchanging NaCl composition). The model considers two different conditions: one in which cells face the HYPONaCl extracellular solution and another in which cells are exposed to the HYPOMannitol extracellular solution (Table 2). We calculated Vcell changes, Vm and Eq as well as net ionic flux (Jnet) under both conditions. Since RVD depends on the activation of K+ and Cl− channels, a regulatory response was simulated by increasing both ion permeabilities at t = 20 s.
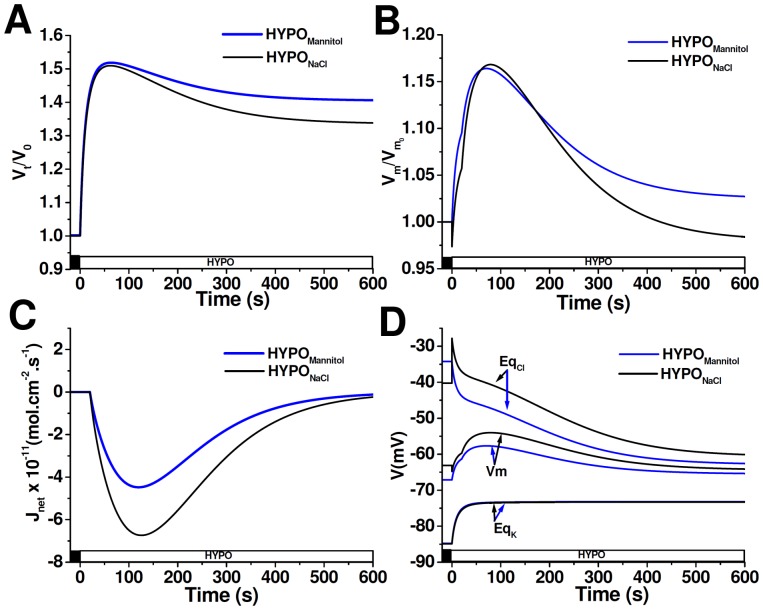
Figure 6A shows that after the hypoosmotic challenge, cells exposed to HYPONaCl initially swell and then partially restore their original volume reaching a new steady-state (%RVD10 34%). A similar response is observed in cells exposed to HYPOMannitol, but their volume is re-established to a lesser extent (24%, Figure 6A). Simulated relative changes in Vm show that the difference in %RVD10 among both conditions is associated with a disparity in the magnitude of repolarization (Figure 6B). As expected, under both conditions, Cl− exiting the cell is electrically coupled to K+ efflux, thus leading to a quasi electroneutral KCl efflux followed by water. The reduced %RVD10 in HYPOMannitol, as compared to HYPONaCl, is due to a reduced net osmolyte efflux (Figure 6C). Net osmolyte efflux, and therefore RVD, ends just when Vm reaches a new stationary value. The evolution of equilibrium potentials and Vm during these simulations is illustrated in Figure 6D. Since in the HYPONaCl condition hypoosmolarity is achieved by removing NaCl, immediately after the hypoosmotic shock, [Cl]o suddenly decreases, transiently increasing the equilibrium potential of this ion (Figure 6D, t = 0, peak EqCl). The subsequent swelling determines a depolarization associated with the dilution of intracellular K+. Since in this cell Cl− exhibits an equilibrium potential that is positive as compared to Vm, when RVD is activated at 20 s, an additional increase in Vm is produced due to the opening of Cl− channels. As intracellular Cl− concentration decreases, EqCl becomes more negative. In addition, K+ permeability is also increased, a fact that tends to bring Vm closer to EqK. As a consequence, Vm partially repolarizes during RVD (Figure 6B and 6D).
Figure 6. Modeling of cells exposed to different extracellular media compositions.
Time courses of Vt/V0 (A), Vm/Vm0 (B), Jnet (C) and Vm, EqCl, EqK (D) simulated in cells exposed to either HYPONaCl or to HYPOMannitol. At time = 0 extracellular osmolarity was reduced (ΔOsM = 100 mOsM) and after a delay of 20 s, PK and PCl increased according to Equation 4. A negative value of J net indicates an outward flux.
As opposed to the HYPONaCl condition, cells exposed to HYPOMannitol keep extracellular NaCl composition constant; therefore, at the instant that extracellular solution is changed, the concentrations of external and internal permeable ions remain constant. Thus, the substitution of the extracellular solution does not affect per se neither EqCl nor Vm (Figure 6D, t = 0 s, EqCl). During cell swelling, the concentration of all intracellular species is reduced, which explains the increase of EqK and the decrease of EqCl (Figure 6D, t = 0–20 s). Mainly, it is the dilution of intracellular Cl−, together with the initial depolarization due to the opening of volume-activated Cl− channels, what reduces the electrochemical gradient for Cl−. As a consequence, Vm repolarization and cell volume regulation are smaller than in the HYPONaCl condition.
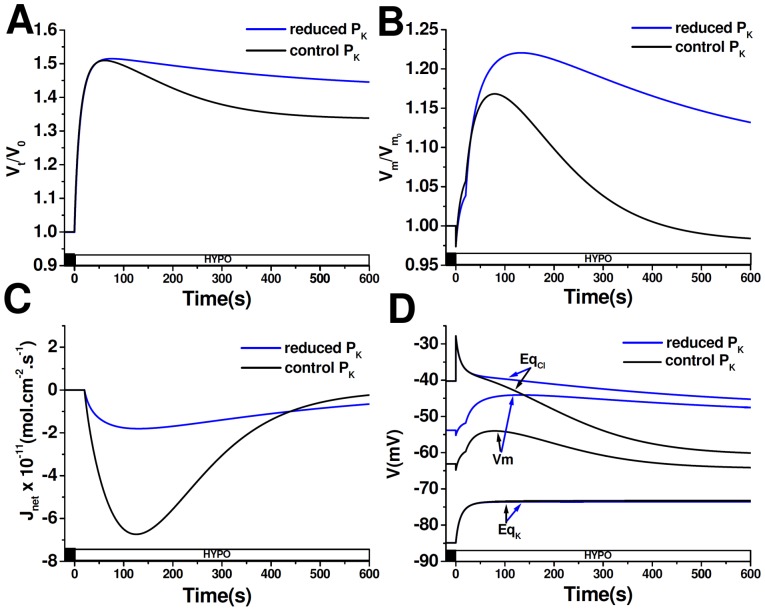
Given that our experimental results showed that the reduction of RVD by K+ and Cl− channels blockers is only evident in cells exposed to HYPONaCl, the following simulations were performed in this condition. Figure 7 shows the time course of Vt/V0, EqCl, EqK, Vm and Jnet when K+ permeability is decreased (reduced PK), thus mimicking cells exposed to Ba2+, versus control conditions (control PK). Experimental data indicate that the blockage of K+ channels with Ba2+ in MIO-M1 cells has two effects: 1) When added to an isoosmotic solution, Vm depolarizes and 2) When added in the presence of a hypoosmotic shock, it significantly reduces RVD response. Simulations take into account these effects and therefore, even before the hypoosmotic shock, PK is reduced by half, remaining constant throughout the entire simulation time. Figure 7A shows that when cell PK is reduced, RVD response is lower as compared to control PK (%RVD10∶13% vs. 34%, respectively). Even more, a reduced PK leads to a decrease in Vm repolarization (Figure 7B) together with a decrease in net osmolyte efflux (Figure 7C). In addition, Figure 7D shows that Cl− electrochemical gradient is reduced while K+ electrochemical gradient tends to increase. However, this rise in K+ driving force does not contribute to RVD, since PK is reduced.
Figure 7. Modeling of cell response to HYPONaCl when PK is reduced.
Time courses of Vt/V0 (A), Vm/Vm0 (B), Jnet (C) and Vm, EqCl, EqK (D) simulated in cells exposed to HYPONaCl. Before the hypoosmotic shock, resting PK was reduced by half and remained constant throughout the entire simulation. At time = 0 extracellular osmolarity was reduced (ΔOsM = 100 mOsM) and after a delay of 20 s, PCl −but not PK− was increased, according to Equation 4. A negative value of J net indicates an outward flux.
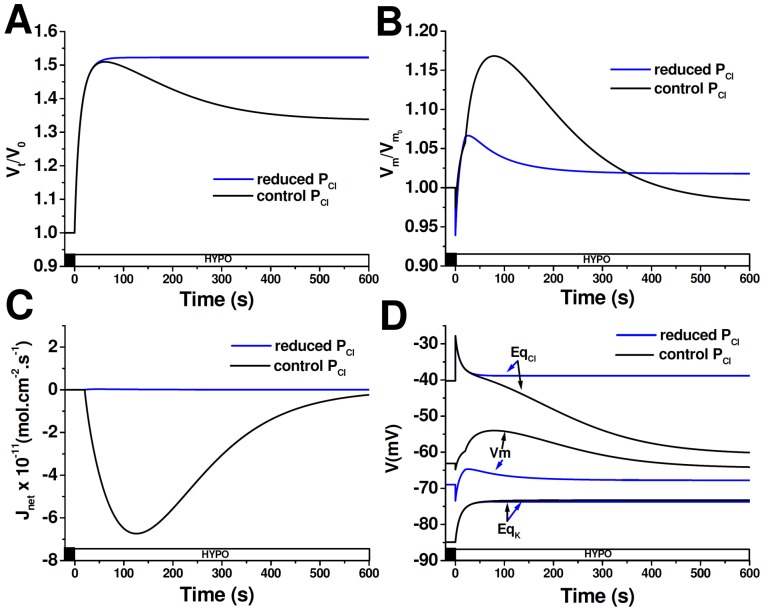
Figure 8 shows the time course simulations of all the variables described above, when Cl− permeability is decreased (reduced PCl), thus imitating cells exposed to NPPB, versus control conditions (control PCl). Since treatment with NPPB leads to hyperpolarization and to a decrease in the RVD response, these effects are reproduced in our simulations. Before the hypoosmotic shock, PCl is lowered tenfold and remains constant throughout the simulation. Simulations prove that when cells have a reduced PCl, RVD response is completely absent, Vm repolarization is significantly reduced and net osmolyte efflux is almost abolished (Figure 8A–C). Figure 8D shows that, as a consequence of PCl reduction, resting Vm is hyperpolarized and the magnitude of the initial depolarization is diminished. Therefore K+ electrochemical gradient is reduced throughout the entire simulation. On the contrary, Cl− electrochemical gradient is augmented; however, this increase in Cl− driving force cannot lead to successful RVD due to the low PCl.
Figure 8. Modeling of cell response to HYPONaCl when PCl is reduced.
Time courses of Vt/V0 (A), Vm/Vm0 (B), Jnet (C) and Vm, EqCl, EqK (D) simulated in cells exposed to HYPONaCl. Before the hypoosmotic shock, resting PCl was reduced a tenfold and remained constant throughout the entire simulation. At time = 0 extracellular osmolarity was reduced (ΔOsM = 100 mOsM) and after a delay of 20 s, PK −but not PCl− was increased, according to Equation 4. A negative value of J net indicates an outward flux.
Discussion
In the present work we evaluated, for the first time, the RVD response in the immortalized retinal Müller cell line, MIO-M1, which maintains important functional characteristics of Müller cells [19]. However, since Müller cells function in vivo strongly depends on tissue structure and on the presence of other cell types [31], the extrapolation of our results to the in vivo condition may be limited. Nevertheless, taking in mind the appropriate considerations, cell culture is a simple and useful model to get insight into the complex machinery used by Müller cells to regulate their volume.
We showed that MIO-M1 cells respond to a hypoosmotic challenge with cell swelling and subsequent RVD −which is at least in part mediated by K+ and Cl− channels− and that this process is associated to Vm depolarization followed by repolarization. Our results demonstrate that RVD response depends on the composition of extracellular media. Cells exposed to a hypoosmotic solution with reduced ionic strength (HYPONaCl) underwent maximum RVD (∼100%) and had a larger repolarization. Both of these responses were reduced by K+ or Cl− channel blockers. On the other hand, cells facing a hypoosmotic solution with the same ionic strength (HYPOMannitol) as the isoosmotic solution showed a lower RVD (∼75%) and a smaller repolarization and were not affected by blockers. Our mathematical model qualitatively described the observed changes in cell volume and Vm. Simulations offered complementary information that explain how the opening of K+ and Cl− channels, as well as changes in their electrochemical gradients, account for the differences in the RVD responses observed in cells exposed to HYPONaCl versus HYPOMannitol.
This observed participation of K+ and Cl− channels in the RVD response of MIO-M1 cells is in line with previous reports in glial cells [4], [15], [32], [33]. It is interesting to note that in simulations, that only considered passive K+ and Cl− fluxes as RVD mechanism, RVD10 magnitude in HYPONaCl was 34%, a value comparable to the experimental fraction of RVD10 inhibited by the use of BaCl2 and NPPB (∼32% and ∼25%, respectively). Then, the differences between absolute values of experimental and simulated RVD10 (∼70%), can be explained, at least in part, by the existence of other RVD mechanisms which are neither being inhibited by these drugs nor simulated. Indeed, organic osmolyte release during cell volume regulation has been widely described in glial cells [15], [34]. Nevertheless, NPPB is also a well known blocker of this RVD mechanism and is likely affecting organic osmolyte release in our experiments. In fact, some previous evidence showed that in glial cells a residual fraction of organic osmolyte release was observed even after NPPB inhibition [35]. Moreover, in hyppocampal slices, where an exocytosis-mediated mechanism was proposed, a fraction of organic osmolyte release was not sensitive to NPPB [36]. Another possibility is that part of the RVD response could be associated to KCl efflux by KCC co-transporters although in other systems, RVD rates mediated by this transporter are lower than those measured in our study [15]. This, however, does not rule out their potential contribution to the RVD response in MIO-M1 cells. Finally, it cannot be discarded that the technique used in our study to assess RVD could be overestimating the real cell volume changes. Nevertheless, the high RVD rates observed in the MIO-M1 cells in our work are very close to previously reported data in glial cells using other techniques [4], [15]. Although future studies are necessary to completely unmask RVD in MIO-M1 cells, it is likely that a combination of all the above described mechanisms explains the differences between experimental and simulated data.
Our data also demonstrated that, regardless of the activation of K+ and Cl− channels, their contribution to the RVD response depends on the equilibrium potentials of these ions relative to the resting membrane potential of the cell. In fact, we found that the nature of the RVD response is affected by the steady-state condition previous to the osmotic shock. Our experiments indicated that, at steady-state, EqK is more negative relative to Vm while, as previously shown in glial cells [37], [38], EqCl is less negative than the Vm. MIO-M1 cells exposed to an isoosmotic solution in which NaCl was partially replaced with mannitol (ISOMannitol) had a slightly more negative Vm than those exposed to a normal NaCl. When these cells are challenged with a hypoosmotic solution that keeps the same ionic strength, the intracellular compartment is diluted, thus reducing the chemical gradient of Cl− and K+, a fact that opposes KCl efflux, and thus RVD. On the other hand, when cells are exposed to HYPONaCl, the intracellular compartment is also diluted, but since the external solution has a reduced Cl− concentration, the driving force for KCl efflux decreases to a lesser extent as compared to the HYPOMannitol condition. Therefore, the magnitude of KCl efflux during cell volume regulation will depend not only of the activation of specific ion channels but also of the magnitude of the driving forces of these ions. This also explains why experiments with HYPOMannitol, in which KCl efflux is diminished, the blockage of K+ and Cl− channels does not affect RVD response.
In our experiments, regardless of the composition of the hypoosmotic solution, cell swelling causes Vm depolarization. This depolarization could be at least partially explained by the dilution of intracellular K+, thus shifting EqK and Vm to less negative values and/or to the activation of channels corresponding to permeant species that exhibits an Eq positive to Vm. We suggest that in MIO-M1 cells the opening of Cl− channels certainly contributes to cell depolarization during swelling, as previously described in other cells types [38], [39]. In fact, the blockage of Cl− channels in the HYPONaCl condition resulted in a markedly reduced swelling-induced depolarization. Nevertheless, it cannot be discarded that other ions with Eq that are more positive than Vm could also account for this depolarization, as reported in others cell types [40], [41], [42].
Our results revealed that the gradual Vm repolarization that coincides with RVD can be explained by the dissipation of Cl− and K+ electrochemical gradients, which lead the cells to a new stationary-state. Clearly, the magnitude of this repolarization is lower in HYPOMannitol, a condition in which these gradients are reduced as compared to HYPONaCl. Even more, the blockage of K+ and Cl− channels only in those conditions in which electrochemical gradients are considerable, like in HYPONaCl, significantly reduces RVD and Vm repolarization by preventing the dissipation of these gradients.
Altogether, experimental and theoretical observations allow us to propose that the efficiency of the RVD process in Müller glia depends not only on the activation of ion channels, but is also strongly modulated by concurrent changes in the membrane potential. Thus, the relationship between ion permeability changes and volume regulation is complex and increments in K+ and Cl− ionic conductances do not necessarily induce osmolyte fluxes large enough to give rise to RVD.
A better understanding of the relationship between cell volume and Vm in the central nervous system is of great interest, since neural activity itself as well as certain pathological conditions induce large alterations in extracellular fluid composition −particularly in Na+, K+ and Cl− concentrations− which are associated to changes in these two interdependent baseline parameters, important for cellular function.
Acknowledgments
The authors thank Dr. Astrid Limb (University College London, London, UK) for providing the human Müller Cell Line (MIO-M1) and Dr. María Teresa Politi for reading the manuscript.
Funding Statement
This work was supported by PICT 07-1060 Fondo Nacional para la Ciencia y la Tecnología (FONCYT), http://www.agencia.gov.ar; UBACYT MO 648/11 Universidad de Buenos Aires (UBA), http://www.uba.rec.ar. The funders had no role in study design, data collection and analysis, decision to publish, or preparation of the manuscript.
References
- 1. Kofuji P, Newman EA (2004) Potassium buffering in the central nervous system. Neuroscience 129: 1045–1056. [DOI] [PMC free article] [PubMed] [Google Scholar]
- 2. Bringmann A, Pannicke T, Grosche J, Francke M, Wiedemann P, et al. (2006) Muller cells in the healthy and diseased retina. Prog Retin Eye Res 25: 397–424. [DOI] [PubMed] [Google Scholar]
- 3. Dmitriev AV, Govardovskii VI, Schwahn HN, Steinberg RH (1999) Light-induced changes of extracellular ions and volume in the isolated chick retina-pigment epithelium preparation. Vis Neurosci 16: 1157–1167. [DOI] [PubMed] [Google Scholar]
- 4. Pasantes-Morales H, Murray RA, Lilja L, Moran J (1994) Regulatory volume decrease in cultured astrocytes. I. Potassium- and chloride-activated permeability. Am J Physiol 266: C165–171. [DOI] [PubMed] [Google Scholar]
- 5. Vitarella D, DiRisio DJ, Kimelberg HK, Aschner M (1994) Potassium and taurine release are highly correlated with regulatory volume decrease in neonatal primary rat astrocyte cultures. J Neurochem 63: 1143–1149. [DOI] [PubMed] [Google Scholar]
- 6. Lang F, Busch GL, Ritter M, Volkl H, Waldegger S, et al. (1998) Functional significance of cell volume regulatory mechanisms. Physiol Rev 78: 247–306. [DOI] [PubMed] [Google Scholar]
- 7. Hirrlinger PG, Wurm A, Hirrlinger J, Bringmann A, Reichenbach A (2008) Osmotic swelling characteristics of glial cells in the murine hippocampus, cerebellum, and retina in situ. J Neurochem 105: 1405–1417. [DOI] [PubMed] [Google Scholar]
- 8. Wurm A, Pannicke T, Iandiev I, Wiedemann P, Reichenbach A, et al. (2006) The developmental expression of K+ channels in retinal glial cells is associated with a decrease of osmotic cell swelling. Glia 54: 411–423. [DOI] [PubMed] [Google Scholar]
- 9. Pannicke T, Iandiev I, Uckermann O, Biedermann B, Kutzera F, et al. (2004) A potassium channel-linked mechanism of glial cell swelling in the postischemic retina. Mol Cell Neurosci 26: 493–502. [DOI] [PubMed] [Google Scholar]
- 10. Pannicke T, Uckermann O, Iandiev I, Wiedemann P, Reichenbach A, et al. (2005) Ocular inflammation alters swelling and membrane characteristics of rat Muller glial cells. J Neuroimmunol 161: 145–154. [DOI] [PubMed] [Google Scholar]
- 11. Pannicke T, Iandiev I, Wurm A, Uckermann O, vom Hagen F, et al. (2006) Diabetes alters osmotic swelling characteristics and membrane conductance of glial cells in rat retina. Diabetes 55: 633–639. [DOI] [PubMed] [Google Scholar]
- 12. Kuhrt H, Wurm A, Karl A, Iandiev I, Wiedemann P, et al. (2008) Muller cell gliosis in retinal organ culture mimics gliotic alterations after ischemia in vivo. Int J Dev Neurosci 26: 745–751. [DOI] [PubMed] [Google Scholar]
- 13. Olson JE, Li GZ (1997) Increased potassium, chloride, and taurine conductances in astrocytes during hypoosmotic swelling. Glia 20: 254–261. [DOI] [PubMed] [Google Scholar]
- 14. Kimelberg HK, Anderson E, Kettenmann H (1990) Swelling-induced changes in electrophysiological properties of cultured astrocytes and oligodendrocytes. II. Whole-cell currents. Brain Res 529: 262–268. [DOI] [PubMed] [Google Scholar]
- 15. Ernest NJ, Weaver AK, Van Duyn LB, Sontheimer HW (2005) Relative contribution of chloride channels and transporters to regulatory volume decrease in human glioma cells. Am J Physiol Cell Physiol 288: C1451–1460. [DOI] [PMC free article] [PubMed] [Google Scholar]
- 16. Wang K, Wondergem R (1992) Mouse hepatocyte membrane potential and chloride activity during osmotic stress. Am J Physiol 263: G566–572. [DOI] [PubMed] [Google Scholar]
- 17. Ballanyi K, Grafe P, Serve G, Schlue WR (1990) Electrophysiological measurements of volume changes in leech neuropile glial cells. Glia 3: 151–158. [DOI] [PubMed] [Google Scholar]
- 18.Lewis R, Asplin KE, Bruce G, Dart C, Mobasheri A, et al.. (2011) The role of the membrane potential in chondrocyte volume regulation. J Cell Physiol. [DOI] [PMC free article] [PubMed]
- 19. Limb GA, Salt TE, Munro PM, Moss SE, Khaw PT (2002) In vitro characterization of a spontaneously immortalized human Muller cell line (MIO-M1). Invest Ophthalmol Vis Sci 43: 864–869. [PubMed] [Google Scholar]
- 20. Ford P, Rivarola V, Chara O, Blot-Chabaud M, Cluzeaud F, et al. (2005) Volume regulation in cortical collecting duct cells: role of AQP2. Biol Cell 97: 687–697. [DOI] [PubMed] [Google Scholar]
- 21. Hamann S, Kiilgaard JF, Litman T, Alvarez-Leefmans FJ, Winther BR, et al. (2002) Measurement of Cell Volume Changes by Fluorescence Self-Quenching. Journal of Fluorescence 12: 139–145. [Google Scholar]
- 22. Klapperstuck T, Glanz D, Klapperstuck M, Wohlrab J (2009) Methodological aspects of measuring absolute values of membrane potential in human cells by flow cytometry. Cytometry A 75: 593–608. [DOI] [PubMed] [Google Scholar]
- 23. Brauner T, Hulser DF, Strasser RJ (1984) Comparative measurements of membrane potentials with microelectrodes and voltage-sensitive dyes. Biochim Biophys Acta 771: 208–216. [DOI] [PubMed] [Google Scholar]
- 24. Epps DE, Wolfe ML, Groppi V (1994) Characterization of the steady-state and dynamic fluorescence properties of the potential-sensitive dye bis-(1,3-dibutylbarbituric acid)trimethine oxonol (Dibac4(3)) in model systems and cells. Chem Phys Lipids 69: 137–150. [DOI] [PubMed] [Google Scholar]
- 25. Hernandez JA, Cristina E (1998) Modeling cell volume regulation in nonexcitable cells: the roles of the Na+ pump and of cotransport systems. Am J Physiol 275: C1067–1080. [DOI] [PubMed] [Google Scholar]
- 26. Poignard C, Silve A, Campion F, Mir LM, Saut O, et al. (2011) Ion fluxes, transmembrane potential, and osmotic stabilization: a new dynamic electrophysiological model for eukaryotic cells. Eur Biophys J 40: 235–246. [DOI] [PubMed] [Google Scholar]
- 27. Ilyaskin AV (2011) Study of the Reaction of Kidney Collecting Duct Principal Cells to Hypotonic Shock. Experiment and Mathematical Model. Biophysics 56: 516–524. [Google Scholar]
- 28. Hodgkin AL, Katz B (1949) The effect of sodium ions on the electrical activity of giant axon of the squid. J Physiol 108: 37–77. [DOI] [PMC free article] [PubMed] [Google Scholar]
- 29. Goldman DE (1943) Potential, Impedance, and Rectification in Membranes. J Gen Physiol 27: 37–60. [DOI] [PMC free article] [PubMed] [Google Scholar]
- 30. Lang F (2007) Mechanisms and significance of cell volume regulation. J Am Coll Nutr 26: 613S–623S. [DOI] [PubMed] [Google Scholar]
- 31. Eberhardt W, Reichenbach A (1987) Spatial buffering of potassium by retinal Muller (glial) cells of various morphologies calculated by a model. Neuroscience 22: 687–696. [DOI] [PubMed] [Google Scholar]
- 32. Wurm A, Lipp S, Pannicke T, Linnertz R, Farber K, et al. (2009) Involvement of A(1) adenosine receptors in osmotic volume regulation of retinal glial cells in mice. Mol Vis 15: 1858–1867. [PMC free article] [PubMed] [Google Scholar]
- 33. Pannicke T, Wurm A, Iandiev I, Hollborn M, Linnertz R, et al. (2010) Deletion of aquaporin-4 renders retinal glial cells more susceptible to osmotic stress. J Neurosci Res 88: 2877–2888. [DOI] [PubMed] [Google Scholar]
- 34. Pasantes-Morales H, Murray RA, Sanchez-Olea R, Moran J (1994) Regulatory volume decrease in cultured astrocytes. II. Permeability pathway to amino acids and polyols. Am J Physiol 266: C172–178. [DOI] [PubMed] [Google Scholar]
- 35. Pasantes-Morales H, Franco R, Ochoa L, Ordaz B (2002) Osmosensitive release of neurotransmitter amino acids: relevance and mechanisms. Neurochem Res 27: 59–65. [DOI] [PubMed] [Google Scholar]
- 36. Franco R, Torres-Marquez ME, Pasantes-Morales H (2001) Evidence for two mechanisms of amino acid osmolyte release from hippocampal slices. Pflugers Arch 442: 791–800. [DOI] [PubMed] [Google Scholar]
- 37. Kimelberg HK (1981) Active accumulation and exchange transport of chloride in astroglial cells in culture. Biochim Biophys Acta 646: 179–184. [DOI] [PubMed] [Google Scholar]
- 38. Kimelberg HK, O’Connor E (1988) Swelling of astrocytes causes membrane potential depolarization. Glia 1: 219–224. [DOI] [PubMed] [Google Scholar]
- 39. Parkerson KA, Sontheimer H (2003) Contribution of chloride channels to volume regulation of cortical astrocytes. Am J Physiol Cell Physiol 284: C1460–1467. [DOI] [PubMed] [Google Scholar]
- 40. Galizia L, Flamenco MP, Rivarola V, Capurro C, Ford P (2008) Role of AQP2 in activation of calcium entry by hypotonicity: implications in cell volume regulation. Am J Physiol Renal Physiol 294: F582–590. [DOI] [PubMed] [Google Scholar]
- 41. Welsh DG, Nelson MT, Eckman DM, Brayden JE (2000) Swelling-activated cation channels mediate depolarization of rat cerebrovascular smooth muscle by hyposmolarity and intravascular pressure. J Physiol 527 Pt 1: 139–148. [DOI] [PMC free article] [PubMed] [Google Scholar]
- 42. Christensen O, Hoffmann EK (1992) Cell swelling activates K+ and Cl- channels as well as nonselective, stretch-activated cation channels in Ehrlich ascites tumor cells. J Membr Biol 129: 13–36. [DOI] [PubMed] [Google Scholar]
- 43. Di Giusto G, Flamenco P, Rivarola V, Fernandez J, Melamud L, et al. (2012) Aquaporin 2-increased renal cell proliferation is associated with cell volume regulation. J Cell Biochem 113: 3721–3729. [DOI] [PubMed] [Google Scholar]


