Abstract
Coating of solid dosage forms is an important unit operation in the pharmaceutical industry. In recent years, numerical simulations of drug manufacturing processes have been gaining interest as process analytical technology tools. The discrete element method (DEM) in particular is suitable to model tablet-coating processes. For the development of accurate simulations, information on the material properties of the tablets is required. In this study, the mechanical parameters Young’s modulus, coefficient of restitution (CoR), and coefficients of friction (CoF) of gastrointestinal therapeutic systems (GITS) and of active-coated GITS were measured experimentally. The dynamic angle of repose of these tablets in a drum coater was investigated to revise the CoF. The resulting values were used as input data in DEM simulations to compare simulation and experiment. A mean value of Young’s modulus of 31.9 MPa was determined by the uniaxial compression test. The CoR was found to be 0.78. For both tablet–steel and tablet–tablet friction, active-coated GITS showed a higher CoF compared with GITS. According to the values of the dynamic angle of repose, the CoF was adjusted to obtain consistent tablet motion in the simulation and in the experiment. On the basis of this experimental characterization, mechanical parameters are integrated into DEM simulation programs to perform numerical analysis of coating processes.
Key words: active film coating, DEM simulation, dynamic angle of repose, tablet coating, tablet mechanical properties
INTRODUCTION
Coating of solid dosage forms is one of the key unit operations in the pharmaceutical industry. Depending on the objective, coatings can provide nonfunctional or functional properties to the tablet cores. For instance, nonfunctional coatings can improve the product’s aesthetic appearance whereas functional coatings allow taste-masking, humidity protection, or modified release of the active pharmaceutical ingredient (API). Pharmaceutical actives can also be incorporated in the film layer, leading to active-coated tablets.
The process analytical technology (PAT) initiative of the US Food and Drug Administration and the concept of Quality by Design are new approaches in drug development and manufacturing. To meet the quality standards of pharmaceutical products, a combination of different tools of analytics, simulations, and control systems are intended to be applied in the future. Modeling techniques which simulate coating processes are current PAT tools for coating process optimization and design space establishment as they can be advantageous compared to experiments with respect to time and costs (1).
The discrete element method (DEM) enables the simulation of particulate processes by computing the particle trajectories and interactions over time. In recent years, the drastic increase in affordable computational power has allowed DEM simulations to become a versatile tool for industrial applications (2). DEM simulations have been used in various industrial fields to study processes such as mixing (3), granule breakage (4), silo filling and discharge (5,6), or milling (7). In the pharmaceutical industry, DEM simulations have been applied for nearly all major particulate processes. One main field of application has been and still is tablet coating (8–11).
The setup of accurate DEM simulations requires input data on the material properties. So far, these data have usually been derived from estimations rather than from experiments. In previous studies on the simulation of coating processes, default values of the simulation software instead of values with experimental validation have been set (12). Thus, currently, there is a lack of simulations which are based on experimental process characterization.
In a coating process, information on the geometry of the coater as well as on the tablet material and interaction properties, such as elasticity, coefficients of restitution and friction is required to calculate the mechanical contact forces as essential basis for the simulation of the tablet bed dynamics.
The elasticity of materials is described by Young’s modulus which depicts the elastic deformation under compression load. Methods to determine the elasticity of powders and tablets are described in literature such as three-point- or four-point-bending techniques (13). However, there are only few investigations on how to assess the elasticity of biconvex tablets. The uniaxial compression test is used to expose a load onto a tablet in order to record the tablet’s deformation. Depending on the material properties of the tablet, the deformation will be elastic, elastic–plastic, or plastic.
The coefficient of restitution (CoR) is a parameter which displays the elasticity of a collision. It is defined as the ratio of the rebound and impact relative velocities of two colliding objects and therefore characterizes the energy losses during collision.
The coefficient of friction (CoF) describes the contact forces of two sliding surfaces and is defined as the ratio of the friction of two objects and the normal force. It can be calculated by the ratio of the tangential force to the normal force of the two surfaces.
For tablets in a drum coater, the dynamic angle of repose is defined as the angle of the surface of a cascading tablet bed with the horizontal while the drum is rotating.
Gonzalez-Montellano et al. measured material properties of both glass beads and maize grains (6). Young’s modulus of maize was determined by a compression analysis of the maize beads. CoR measurements were done with aluminum oxide spheres by rebound tests for particle-wall (14) and with metal balls by double pendulum tests for particle values (15). In these studies, particle-wall friction was determined by a sliding test, whereas particle-particle friction was not measured. Friction measurements based on constant sliding were done for glass and steel spheres and Perspex® walls by Li et al. (16). They found a constant CoF for these material combinations as assumed in conventional friction theory. Ahmadian et al. obtained the stiffness values by measuring the yield stress for single granule compaction in an analysis on granule breakage (4). On the basis of the work of Ketterhagen et al. (17), they performed rolling friction experiments. They did not measure the particle–particle sliding CoF directly, but the bulk CoF instead, using a Schulze shear cell. The particle–particle coefficient was then adjusted to achieve the same bulk coefficient in the simulation. Particle-wall friction was measured according to Couroyer et al. (18). Pandey et al. performed experiments using high-speed video-imaging of a rebounding particle for the determination of the CoR (19).
With regard to the sensitivity of DEM, a study on the particle behavior in a V-mixer revealed that the CoF had considerable impact on the transition from static to dynamic states. The CoR was seen to influence the dynamic behavior of moving particles. Changes in the stiffness, which is related to Young’s modulus, showed no significant effect on the results of the simulation as long as reasonable values were chosen (20). Ketterhagen demonstrated that an increase in shear moduli by the factor of 100 had no impact on the results of the simulation (12). For the DEM simulation of a coating process of biconvex tablets, the coefficient of sliding friction had a distinct effect on the inter-tablet coating variability as well as on the qualitative appearance of the bed behavior (going from slumping to rolling with increasing friction) (21). In an investigation on the formation of glass bead “sand piles,” the angle of repose was significantly sensitive to variations on the friction, while it was not sensitive to elasticity parameters in both experiment and simulation (22). The dynamic angle of repose has also been seen to be sensitive to the CoF (19). Microscopic collision-scale properties may depend on the CoR and stiffness, while macroscopic properties such as velocity fields are insensitive to even relatively strong variations in these parameters (23).
The objective of this study was the experimental characterization of relevant mechanical parameters of tablets. These investigations enable the development of DEM simulations of coating processes to predict coating uniformity.
MATERIALS AND METHODS
Materials
Gastrointestinal therapeutic systems (GITS) were used as starting material in this study (Bayer Pharma AG, Leverkusen, Germany). These GITS were coated biconvex two-layer tablets consisting of an API layer containing nifedipine, an osmotic blend layer, and a diffusion membrane coat. The diffusion membrane coat comprises cellulose acetate and polyethylene glycol and a laser drilled hole for the sustained release of nifedipine (Fig. 1). In an active-coating process, the GITS were coated with the API candesartan cilexetil and a polyvinyl alcohol based polymer mixture (Colorcon, Dartford, UK). The resulting product is a fixed dose combination of sustained release nifedipine in the tablet core and immediate release candesartan cilexetil in the active coating layer and will be referred to as active-coated GITS in this work. The active coating was performed in a side-vented lab drum coater (BFC 5, L.B. Bohle, Ennigerloh, Germany) with two spray nozzles (Duesen-Schlick GmbH, Untersiemau, Germany).
Fig. 1.
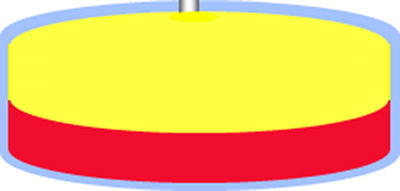
Schematic of GITS: API layer (yellow), osmotic blend layer (red), and diffusion membrane coat (blue) with laser-drilled hole (For interpretation of the references to colour in this figure legend, the reader is referred to the web version of the article.)
Young’s Modulus
Young’s modulus was determined by the uniaxial compression test with a universal testing machine (Hess H10KM, Richard Hess MBV GmbH, Sonsberg, Germany). The tablets were placed on top of a planar surface. The upper punch of the tablet press was used as probe to define a convex contact area for biconvex tablets. The punch moved down with a constant velocity of 8 mm/min until a loading of 1,000 N was reached. GITS and active-coated GITS were tested on both tablet faces. Each measurement was performed with five replications. Force-displacement-profiles were recorded and transformed into stress–strain-profiles (Fig. 2). According to Hooke’s law, Young’s modulus was calculated from the ratio of tensile stress σ to tensile strain ε, given by the slope in the linear beginning of each stress–strain curve:
 |
1 |
Fig. 2.
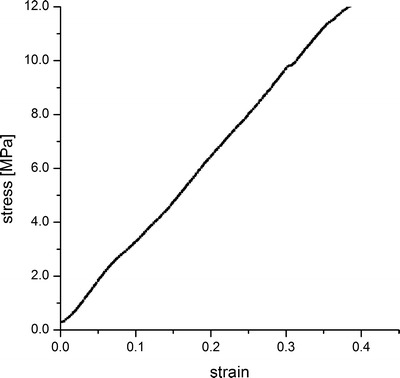
Exemplary stress–strain profile of the nifedipine face of the GITS
Coefficient of Restitution
The CoR was determined according to a method described by Suzzi et al. (11). GITS and active-coated GITS were dropped from 10 cm height onto a marble plate. Fall and rebound were recorded with a high-speed camera (MotionScope M3, Imaging Solutions, Germany) at a frequency of 1,000 Hz. Measurements were repeated twice. Relevant video frames were saved as pictures. From each video four pictures were selected: clearly before rebound, immediately before rebound, immediately after rebound and clearly after rebound (Fig. 3). On the basis of a linear model, which is an appropriate approximation under these conditions, distances between the falling tablets and between the rebounding tablets were calculated and converted into velocities according to
 |
2 |
where din is the distance of the tablet clearly before and immediately before rebound and dout is the distance of the tablet immediately after and clearly after rebound, respectively. The CoR is given by
 |
3 |
Fig. 3.
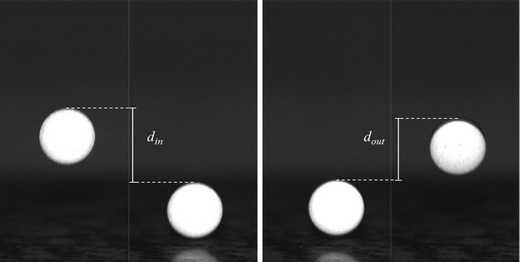
Record of fall (left) and rebound (right)
Coefficient of Friction
The coefficient of friction was measured using a modified rheometer (Kinexus, Malvern Instruments Ltd., UK) as depicted by Suzzi et al. (11). The rheometer was equipped with an upper rheometer disk and a pin-on-disk sample stage (Fig. 4). Tablet–tablet contacts and tablet–steel contacts were examined. GITS, partially active-coated and completely active-coated GITS were compared.
Fig. 4.
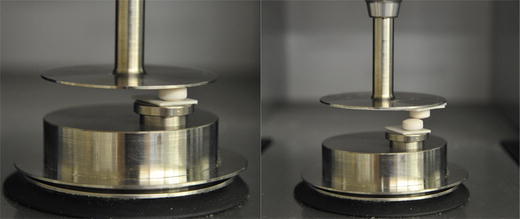
Experimental setup for measurement of tablet–steel (left) and tablet–tablet (right) friction
For tablet-steel measurements, a tablet was glued onto the lower stage. The upper disc of the rheometer was moved down until getting in contact with the tablet. By moving further down and thus compressing the elastic bearing of the sample stage, a constant normal force was established. Defined normal forces of 1, 1.5, 2, and 3 N were applied and the upper disc was rotated.
Each measurement consisted of 200 single measuring points/tablet and was repeated twice. The coefficient of friction μs was calculated from torque T, normal force FN and distance r between the contact point of the tablet and the center of the upper rheometer disc:
 |
4 |
Tablet–tablet friction was determined by fixing one tablet on the upper disc and a second tablet on the lower disc. The upper disc was lowered to get contact between the two tablets. Tangential force over normal force was measured. μs was given by the slope of the linear ascending part of the curves. Three measurements were performed.
In addition, the influence of moisture on both tablet–steel and tablet–tablet friction was assessed to mimic conditions of a coating process. Accordingly, tablets were stored at defined relative humidity (rH) of 44%, 58%, and 75%, and were tested subsequently.
Dynamic Angle of Repose
The drum of the coater was replaced by a drum without baffles (L.B. Bohle, Ennigerloh, Germany) and filled with 3 kg of either GITS or active-coated GITS. A camera was placed in front of the coater and horizontally adjusted to the tablet bed. Photos of the moving tablet bed were taken at drum rotation speeds of 16, 18, and 20 rpm (Fig. 5). For each rotation speed, five photos were chosen for analysis. The dynamic angle of repose was measured using GIMP image editing software (GNU Image Manipulation Program, www.gimp.org).
Fig. 5.
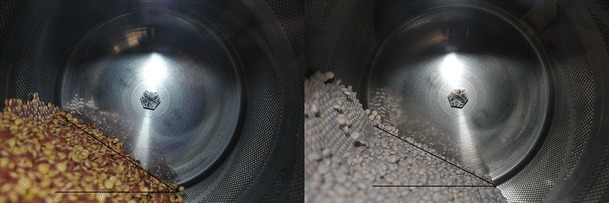
Moving tablet bed of GITS (left) and active-coated GITS (right) at 16 rpm drum rotation speed
To assess the dynamic angle of repose of a tablet bed under conditions comparable to a coating process, further coating suspension was sprayed onto active-coated GITS. After coating for 30 min, spraying was stopped and photos of the wet tablets were taken and analyzed as outlined.
DEM Simulation
The simulations were done using a commercial DEM software package (EDEM 2.3, DEM Solutions, Edinburgh, UK). In the DEM simulation, the coater drum was rotated. The required rotation was given by the product of rotation speed and time-step length. Particle-particle and particle-wall contacts were detected and the overlap of the contact (soft-sphere approach) was determined. For each detected contact, a contact model was applied. Here, for both types of contact, the Hertz–Mindlin model was used. The forces on the particles, including the forces which resulted from the contact model and the gravitational force, were gathered. Finally, the particle properties (position, velocity, rotation, and rotation velocity) were updated based on the applied forces. This sequence was repeated for every time step until the desired end time of the simulation was reached.
The Hertz–Mindlin model used in this work is based on the work of Mindlin (24). It states that the repulsive force resulting from a collision is calculated from the amount of normal overlap δn and tangential overlap δt (soft-sphere approach). The following describes the contact between two spheres i and j of radius Ri and Rj, respectively. The contact between particle and geometry is treated in the same way by setting Rj = ∞.
The normal force Fn is given as
 |
5 |
with  the equivalent contact radius,
 |
6 |
and  the equivalent Young’s modulus:
 |
7 |
Here, Ei/j is the Young’s modulus of sphere i/j, and υi/j the corresponding Poisson ratio. In addition to the repulsive normal force, a damping force  is applied:
 |
8 |
with  the normal component of the relative velocity of the two spheres,
  the equivalent mass,
 |
9 |
and damping coefficient β and normal stiffness Sn defined as:
 |
10 |
 |
11 |
The tangential force Ft is given as
 |
12 |
where  is the equivalent shear modulus:
 |
13 |
Similar to above, a damping force is included:
 |
14 |
with  the tangential component of the relative velocity of the two spheres. The maximum tangential force that is possible depends on the normal force and μs (Coulomb friction):
 |
15 |
In addition, rolling friction can be included. This is done by adding an additional torque term given as
 |
16 |
with ωi the angular velocity at the contact point, and μr the coefficient of rolling friction. Accounting for rolling friction is especially important for the simulation of single spherical particles.
In the experimental part of this work, round biconvex tablets were used. In the DEM simulation, this shape was approximated by the glued-sphere approach (25). According to this approach, a number of spheres were connected to each other to form a single particle. Eight intersecting spheres were arranged to achieve a satisfactory approximation of the real table shape (Fig. 6). The glued-sphere approximation was used because it is the current state-of-the-art for DEM simulations of tablet-coating processes. It is widely used in the community (5,26–28).
Fig. 6.
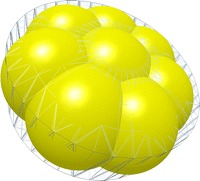
Shape of biconvex round tablets according to the glued-spheres approach
On the basis of Eqs. (5)–(16) and considering that the shear modulus can be calculated from Young’s modulus and Poisson ratio, the Hertz–Mindlin contact model depends on the following material parameters:
Coefficient of restitution e
Young’s modulus E
Poisson ratio υ
Coefficient of static friction μs
Coefficient of rolling friction μr
In this study, e, E, and μs have been measured directly. The Poisson ratio has been excluded because a largely consistent value has been established in literature (12). In the case of nonspherical particles, a rolling motion is mostly limited by the shape of the particles itself, and the rolling friction μr has no great influence on the behavior. Therefore, the coefficient of rolling friction was not measured, and the value for tablets of equivalent shape from literature (17) was used.
The sensitivity of the dynamic angle of repose due to variations in the mechanical parameters was assessed in this work. The resulting dynamic angle of repose of the tablet bed in the simulation was investigated subject to elasticity, CoR, and CoF. Shear modulus, which is calculated from Young’s modulus, was chosen as elasticity parameter because computations in the simulation software rely on this parameter. In a randomized 22 design of experiments (DOE), the effects of the factors shear modulus and CoR on the dynamic angle of repose were analyzed. The values obtained from the experiments were chosen as center points. CoF were set constant at 0.5 for both tablet–steel and tablet–tablet contacts.
In a second DOE, the influence of the CoF on the dynamic angle of repose was examined. Tablet–steel CoF of 0.5 (low level) and 0.9 (high level) and tablet–tablet CoF of 0.1 (low level) and 0.9 (high level) were investigated with three replications at the center point (0.7 for tablet–steel, 0.5 for tablet–tablet). Drum rotation speeds of 16, 18, and 20 rpm were set. The experimentally determined values of CoR and Young’s modulus were used.
RESULTS AND DISCUSSION
Young’s Modulus
Estimations of Young’s modulus in previous studies range from 1.00 (9) to 10.00 MPa (23). Ketterhagen set Young’s modulus at 2.50 MPa according to the default value in the simulation software EDEM™ (12). A much higher value of 1,280 MPa was used in a work on polystyrene spheres (19).
In the scope of the DEM simulations, all collisions are between spheres, and Young’s modulus and coefficient of restitution are approximated as a constant material property. In this study, Young’s modulus from axial compression was chosen as this was expected to be most representative for the sphere collision. Young’s modulus from radial compression was neglected in this work, although it might be different. The results for GITS and active-coated GITS on the individual tablet faces are displayed in Table I.
Table I.
Results of the Uniaxial Compression Test, mean ± s, n = 5
| Tablet | Tablet layer | E (MPa) |
|---|---|---|
| GITS | API layer | 32.2 ± 0.3 |
| GITS | Osmotic layer | 31.0 ± 0.8 |
| Active-coated | API layer | 31.3 ± 1.2 |
| Active-coated | Osmotic layer | 32.2 ± 0.4 |
The comparison of GITS and active-coated GITS indicated that the addition of the active coating layer did not impact the elasticity of the tablet. Comparing the two tablet faces under compression, no difference in Young’s moduli was found. The results displayed that the elasticity of the tablet was independent of its surface properties. The mean Young’s modulus of these results was equal to 31.9 ± 0.8 MPa. This value is higher than estimations of Young’s modulus in literature, yet it still matches the order of magnitude of literature values.
Coefficient of Restitution
In previous studies default CoR values of EDEM™ software (0.5) were used (12,27). Freireich et al. set the CoR to 0.73 in their investigations (23) while Kalbag and Wassgren used 0.6 (21). Bharadwaj et al. determined CoR values between 0.6 and 0.85 for Plexiglas®, stainless steel and glass beads interactions (29). For different kinds of coated tablets they found CoR values that ranged from 0.4 to 0.9 (30). For polystyrene balls, a value of 0.81 was approximated as CoR (19).
As Young’s modulus, the coefficient of restitution may also depend on the orientation. However, since current common DEM software does not take this into account, it was measured in the described orientation to provide most reliable experimental results.
A mean CoR value of 0.79 (s = 0.04, n = 3) was determined for GITS. No difference in CoR values was found for active-coated GITS with a mean value of 0.80 (s = 0.03, n = 3). As outlined, the obtained results are consistent with literature values.
Coefficient of Friction
DEM simulations showed that the CoF influenced the dimensionless appearance frequency of the tablets in the spray zone. With an increasing CoF, mixing and the dimensionless appearance frequency increased (31). The impact of the CoF on the dynamic angle of repose was also investigated. An increased CoF increased the dynamic angle of repose due to higher movement in the bed (19). In contrast, Yamane et al. found a constant dynamic angle of repose after an initial increase (9). These results point out the importance of the CoF on tablet motion. Comprehensive investigations on the friction were done by Hancock et al. (32). Kalbag et al. used an arbitrarily chosen value of 0.3 for both sphere–sphere and sphere–pan CoF (31). Ketterhagen (12) and Freireich et al. (23,27) did not distinguish between tablet–steel and tablet–tablet friction either. They used default friction values of 0.5 of EDEM™ software. Pandey et al. also set 0.5 as friction value for polystyrene spheres (19) while Yamane et al. chose 0.3 in simulations with spherical particles (9).
In the Coulomb friction model, the coefficient of friction is constant for a pair of materials and can be calculated according to Eq. (4). The CoF is independent of contact area, velocity, and normal force. However, in practice, the CoF is not entirely independent. For the simulation, a CoF value has to be found that leads to an appropriate description of the tablet motion inside the drum coater. The friction measurements were performed under conditions comparable to a coating process as far as contact area, velocity, and normal force are concerned. The measurements for tablet–steel contacts showed that changes in normal force did not impact the CoF. In the simulation, a normal force in the range of 1 N was seen for the tablets at the lower part of the tablet bed.
Figure 7 presents the results of the friction measurements for tablet–steel contacts. Due to different properties of the tablet surface, active-coated GITS showed an increased static friction compared with GITS. It was assumed that the surface of the GITS showed more roughness leading to interlocking of surfaces and increased friction. Yet, the smooth steel plate was not prone to such effects. It was seen that the smoother active coating surface had a higher CoF due to a more pronounced frictional behavior of the material itself. An influence of moisture on the tablet–steel friction was not observed.
Fig. 7.
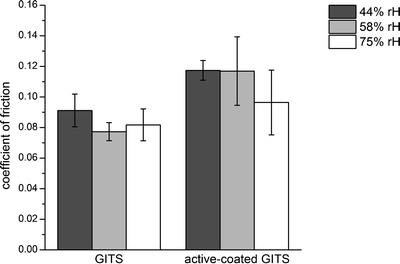
Tablet–steel friction of GITS and active-coated GITS (mean ± s, n = 3 tablets, 200 single measurements/tablet) at 44%, 58%, and 75% rH for 1 N normal force
Tablet–tablet friction was determined by measuring tangential force over normal force (Fig. 8). The hysteresis curves are composed of the up- and downward curves of the tangential force as a function of the normal force.
Fig. 8.
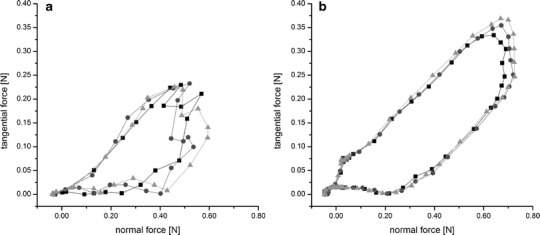
Tablet–tablet friction, measurement of three single tablets (black squares, gray triangles, black circles), GITS a, and active-coated GITS b, at 44% rH
The CoF which is comprised by both static and sliding friction, is given by the slope of the resulting curves. The smooth curves of the active-coated GITS (Fig. 8b) show that almost no stick–slip friction was observed. In contrast, the GITS curves (Fig. 8a) show some fluctuation due to the rougher surface. However, the CoF of the active-coated GITS was higher than the CoF of the GITS. This indicates that the sliding friction was higher for the active-coated GITS whereas the static friction was higher for the GITS. Partially active-coated GITS were also investigated. The coefficient of friction of these GITS was comparable to the coefficient of friction of the active-coated GITS. As soon as the active coating layer is closed, further addition of coating does not impact the friction behavior. Consequently, the value of the coefficient of friction of active-coated GITS is used in DEM simulations of the coating process.
Results of the investigations on the effect of moisture on the tablet–tablet friction are displayed in Fig. 9. The CoF of the GITS did not change under storage at defined relative humidity. For active-coated GITS on the contrary, an increase of the CoF was observed at 75% rH, whereas the CoF remained constant at 58% rH. The differences between GITS and active-coated GITS at 75% rH can be attributed to different water absorptive capacity of the films. The cellulose acetate of the GITS was not influenced by moisture. In contrast, the polyvinyl alcohol-based polymer mixture of the active coating layer was seen to be sensitive to moisture and thus leading to a higher coefficient of friction. Since such high moisture is not reached during the coating process, this effect is negligible. This can be attributed to different water absorbance capacity of the films of the GITS and the active-coated GITS.
Fig. 9.
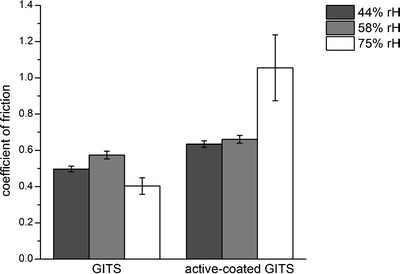
Influence of moisture on tablet-tablet friction of GITS and active-coated GITS (mean ± s, n = 3)
Dynamic Angle of Repose
A correlation between drum load, wall friction, and the dynamic angle of repose was examined in studies on tablet movement in a drum coater by Leaver et al. (33). As a result of an increase in drum load, stronger wall friction was observed which led to an increased dynamic angle of repose. These results were confirmed in both DEM and experiments with polystyrene spheres by Pandey et al. (19), where the dynamic angle of repose increased with increasing drum speed and drum load. For spherical particles, a linear relationship between the angle of repose and the drum rotation speed was seen. Yamane et al. found that particle shape influenced the dynamic angle of repose stronger than friction (9). In DEM simulations with spheres, the angle of repose increased with an increase of either rolling or sliding friction for both particle–particle and particle–wall contacts (22).
In this work, a tablet bed of GITS was compared with a tablet bed of active-coated GITS. The differences in the dynamic angle of repose were due to the interaction properties of the tablet bed, particularly the friction. While the drum was rotating, tablets stringed neatly along the coater wall. This effect was more pronounced for the active-coated GITS than for the GITS. Due to stronger tablet–steel friction, active-coated GITS moved up the wall and formed a tablet bed which was flatter compared with a tablet bed of GITS. Therefore, a lower dynamic angle of repose was measured for the active-coated GITS. On the contrary, tablet–tablet friction was of greater impact for GITS and thus caused a steeper tablet and a higher dynamic angle of repose (Fig. 10).
Fig. 10.
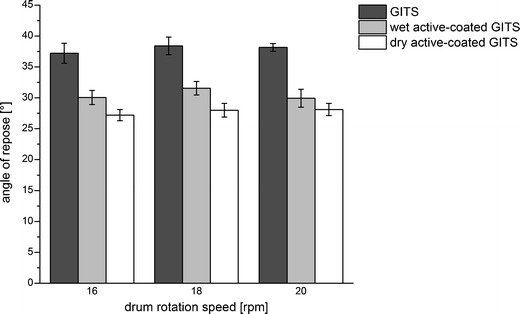
Dynamic angle of repose of GITS tablets, wet active-coated GITS, and dry active-coated GITS at different drum rotation speeds (mean ± s, n = 5)
The influence of moisture on the dynamic angle of repose was investigated by spraying coating suspension onto active-coated GITS. Values of the dynamic angle of repose of the resulting wet active-coated GITS were smaller than values of the GITS and higher than values of the dry active-coated GITS.
DEM Simulation
The evaluation of DEM simulations showed that the dynamic angle of repose was not sensitive to shear modulus and the CoR within the range of the factor levels chosen for analysis (Table II). In the simulation, the resulting dynamic angle of repose values agreed with the values obtained in the experiments with GITS. These results were consistent with previous examinations on the sensitivity of DEM simulations which showed that variations in Young’s modulus and shear modulus, respectively, did not impact the dynamic angle of repose (12,22). In contrast, an influence of the CoF on the dynamic angle of repose was seen (19,21).
Table II.
Investigation of the Dynamic Angle of Repose Subject to Shear Modulus and CoR
| Exp No. | Run order | Shear modulus (MPa) | CoR | Dynamic angle of repose (deg) |
|---|---|---|---|---|
| 1 | 1 | 0.77 | 0.71 | 38.60 |
| 2 | 5 | 24.00 | 0.71 | 38.44 |
| 3 | 3 | 0.77 | 0.79 | 38.52 |
| 4 | 4 | 24.00 | 0.79 | 38.76 |
| 5 | 2 | 12.39 | 0.75 | 38.57 |
| 6 | 6 | 12.39 | 0.75 | 38.64 |
| 7 | 7 | 12.39 | 0.75 | 39.18 |
In this study, the impact of friction on the dynamic angle of repose was investigated in a DOE. Simulations with the experimentally determined tablet–steel CoF of 0.15 revealed slipping motion of the tablet bed. This indicated that the experimentally measured tablet–steel friction did not reflect the simulation of the tablet motion in a perforated drum coater correctly. A minimum of 0.45 was required for tablet–steel CoF, to obtain a cascading tablet bed with a dynamic angle of repose in accordance with the experiments (Fig. 11).
Fig. 11.
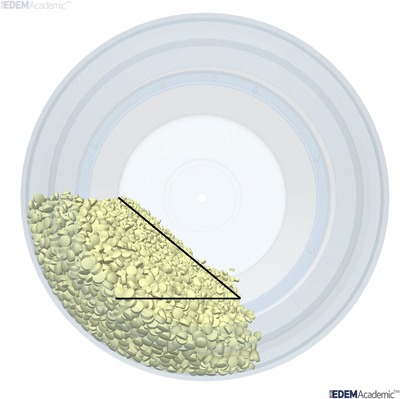
Dynamic angle of repose of the tablet bed in the DEM simulation after adjustment of coefficients of friction
For a tablet bed of GITS, mean experimental values of the dynamic angle of repose of 39° were obtained. Therefore, the objective was to achieve a dynamic angle of repose of 39° in the simulation, too. With tablet–steel CoF of 0.5 and 0.9 and with tablet–tablet CoF of 0.5, 0.7, and 0.9, experiment and simulation were consistent (Table III). It was shown that the experimentally determined tablet–tablet CoF of 0.5 was suitable to obtain a cascading tablet bed.
Table III.
Investigation of the Dynamic Angle of Repose Subject to Friction
| Exp No. | Run order | Tablet–steel friction coefficient | Tablet–tablet friction coefficient | Dynamic angle of repose (deg; 18 rpm) |
|---|---|---|---|---|
| 1 | 8 | 0.1 | 0.5 | 26.02 |
| 2 | 2 | 0.9 | 0.5 | 38.20 |
| 3 | 4 | 0.1 | 0.9 | 26.18 |
| 4 | 1 | 0.9 | 0.9 | 41.88 |
| 5 | 6 | 0.1 | 0.7 | 27.27 |
| 6 | 3 | 0.9 | 0.7 | 38.74 |
| 7 | 9 | 0.5 | 0.5 | 39.16 |
| 8 | 5 | 0.5 | 0.9 | 41.19 |
| 9 | 7 | 0.5 | 0.7 | 40.47 |
| 10 | 10 | 0.5 | 0.7 | 40.46 |
| 11 | 11 | 0.5 | 0.7 | 40.53 |
For a tablet bed of active-coated GITS, a mean dynamic angle of repose of 27° was found in the experiment. As for the GITS, the tablet–steel CoF was set at minimum value of 0.5 in the simulation. To obtain a dynamic angle of repose of 27° in the simulation, the tablet–tablet CoF had to be decreased compared with the experimental values. Instead of the experimental value of 0.5, a tablet–tablet CoF of 0.14 was required. At these settings, good correspondence between simulation and experiment was achieved.
The study of the dynamic angle of repose demonstrated that experimental friction measurements did not sufficiently describe the tablet motion in a perforated drum. The CoFs were adjusted with supplementary measurements of the dynamic angle of repose. Based on this, consistency between simulation and experiment was attained.
CONCLUSIONS
The aim of this study was the experimental determination of relevant material properties of tablets for the development of DEM simulations of an active-coating process. The mechanical parameters Young’s modulus, coefficient of restitution, and coefficients of friction were determined experimentally. Good accordance between simulation and experiment was obtained for the Young’s modulus and the coefficient of restitution. The method to determine the coefficient of friction did not result in adequate values as the tablet motion was not represented properly in the simulation. To revise the coefficients of friction, the dynamic angle of repose of tablets in a drum coater was investigated experimentally. Based on these experiments, the simulation parameter coefficient of friction was adjusted in the DEM simulation to match experiment and simulation. The resulting values were used as input data in DEM simulations to compare simulation and experiment. First DEM simulations showed good agreement with previous estimations and investigations on material properties.
It was shown that estimations are feasible to a certain extent. However, input parameters relying on experimental data enable a more accurate modeling.
On the basis of this experimental characterization, mechanical parameters can now be integrated into DEM simulation programs to perform numerical analysis of coating processes.
REFERENCES
- 1.FDA - Food and Drug Administration: PAT—a framework for innovative pharmaceutical development, manufacturing and quality assurance. http://www.fda.gov/downloads/Drugs/.../Guidances/ucm070305.pdf. 2004.
- 2.Cleary PW. Industrial particle flow modelling using discrete element method. Eng Comput. 2009;26(6):698–743. doi: 10.1108/02644400910975487. [DOI] [Google Scholar]
- 3.Adam S, Suzzi D, Radeke C, Khinast JG. An integrated quality by design (QbD) approach towards design space definition of a blending unit operation by discrete element method (DEM) simulation. Eur J Pharm Sci. 2011;42(1–2):106–115. doi: 10.1016/j.ejps.2010.10.013. [DOI] [PubMed] [Google Scholar]
- 4.Ahmadian H, Hassanpour A, Ghadiri M. Analysis of granule breakage in a rotary mixing drum: experimental study and distinct element analysis. Powder Technol. 2011;210(2):175–180. doi: 10.1016/j.powtec.2011.03.013. [DOI] [Google Scholar]
- 5.Gonzalez-Montellano C, Ramirez A, Fuentes JM, Ayuga F. Numerical effects derived from en masse filling of agricultural silos in DEM simulations. Comput Electron Agric. 2012;81:113–123. doi: 10.1016/j.compag.2011.11.013. [DOI] [Google Scholar]
- 6.Gonzalez-Montellano C, Ramirez A, Gallego E, Ayuga F. Validation and experimental calibration of 3D discrete element models for the simulation of the discharge flow in silos. Chem Eng Sci. 2011;66(21):5116–5126. doi: 10.1016/j.ces.2011.07.009. [DOI] [Google Scholar]
- 7.Cleary PW, Morrisson R, Morrell S. Comparison of DEM and experiment for a scale model SAG mill. Int J Miner Process. 2003;68(1–4):129–165. doi: 10.1016/S0301-7516(02)00065-0. [DOI] [Google Scholar]
- 8.Dubey A, Hsia R, Saranteas K, Brone D, Misra T, Muzzio FJ. Effect of speed, loading and spray pattern on coating variability in a pan coater. Chem Eng Sci. 2011;66(21):5107–5115. doi: 10.1016/j.ces.2011.07.010. [DOI] [Google Scholar]
- 9.Yamane K, Sato T, Tanaka T, Tsuji Y. Computer simulation of tablet motion in coating drum. Pharm Res. 1995;12(9):1264–1268. doi: 10.1023/A:1016201102355. [DOI] [PubMed] [Google Scholar]
- 10.Kodam M, Curtis J, Hancock B, Wassgren C. Discrete element method modeling of bi-convex pharmaceutical tablets: contact detection algorithms and validation. Chem Eng Sci. 2012;69(1):587–601. doi: 10.1016/j.ces.2011.11.011. [DOI] [Google Scholar]
- 11.Suzzi D, Toschkoff G, Radl S, Machold D, Fraser SD, Glasser BJ, et al. DEM simulation of continuous tablet coating: effects of tablet shape and fill level on inter-tablet coating variability. Chem Eng Sci. 2012;69(1):107–121. doi: 10.1016/j.ces.2011.10.009. [DOI] [Google Scholar]
- 12.Ketterhagen WR. Modeling the motion and orientation of various pharmaceutical tablet shapes in a film coating pan using DEM. Int J Pharm. 2011;409(1–2):137–149. doi: 10.1016/j.ijpharm.2011.02.045. [DOI] [PubMed] [Google Scholar]
- 13.Podczeck F, Drake KR, Newton JM, Haririan I. The strength of bilayered tablets. Eur J Pharm Sci. 2006;29(5):361–366. doi: 10.1016/j.ejps.2006.07.005. [DOI] [PubMed] [Google Scholar]
- 14.Gorham DA, Kharaz AH. The measurement of particle rebound characteristics. Powder Technol. 2000;112(3):193–202. doi: 10.1016/S0032-5910(00)00293-X. [DOI] [Google Scholar]
- 15.Wong CX, Daniel MC, Rongong JA. Energy dissipation prediction of particle dampers. J Sound Vib. 2009;319(1–2):91–118. doi: 10.1016/j.jsv.2008.06.027. [DOI] [Google Scholar]
- 16.Li YJ, Xu Y, Thornton C. A comparison of discrete element simulations and experiments for ‘sandpiles’ composed of spherical particles. Powder Technol. 2005;160(3):219–228. doi: 10.1016/j.powtec.2005.09.002. [DOI] [Google Scholar]
- 17.Ketterhagen WR, Bharadwaj R, Hancock BC. The coefficient of rolling resistance (CoRR) of some pharmaceutical tablets. Int J Pharm. 2010;392(1–2):107–110. doi: 10.1016/j.ijpharm.2010.03.039. [DOI] [PubMed] [Google Scholar]
- 18.Couroyer C, Ning Z, Ghadiri M, Brunard N, Kolenda F, Bortzmeyer D, et al. Breakage of macroporous alumina beads under compressive loading: simulation and experimental validation. Powder Technol. 1999;105(1–3):57–65. doi: 10.1016/S0032-5910(99)00118-7. [DOI] [Google Scholar]
- 19.Pandey P, Song YX, Kayihan F, Turton R. Simulation of particle movement in a pan coating device using discrete element modeling and its comparison with video-imaging experiments. Powder Technol. 2006;161(2):79–88. doi: 10.1016/j.powtec.2005.09.003. [DOI] [Google Scholar]
- 20.Kuo HP, Knight PC, Parker DJ, Tsuji Y, Adams MJ, Seville JPK. The influence of DEM simulation parameters on the particle behaviour in a V-mixer. Chem Eng Sci. 2002;57(17):3621–3638. doi: 10.1016/S0009-2509(02)00086-6. [DOI] [Google Scholar]
- 21.Kalbag A, Wassgren C. Inter-tablet coating variability: tablet residence time variability. Chem Eng Sci. 2009;64(11):2705–2717. doi: 10.1016/j.ces.2009.02.037. [DOI] [Google Scholar]
- 22.Zhou YC, Xu BH, Yu AB, Zulli P. An experimental and numerical study of the angle of repose of coarse spheres. Powder Technol. 2002;125(1):45–54. doi: 10.1016/S0032-5910(01)00520-4. [DOI] [Google Scholar]
- 23.Freireich B, Litster J, Wassgren C. Using the discrete element method to predict collision-scale behavior: a sensitivity analysis. Chem Eng Sci. 2009;64(15):3407–3416. doi: 10.1016/j.ces.2009.04.019. [DOI] [Google Scholar]
- 24.Mindlin RD. Compliance of elastic bodies in contact. J Appl Mech-Trans ASME. 1949;16(3):259–268. [Google Scholar]
- 25.Favier JF, Abbaspour-Fard MH, Kremmer M, Raji AO. Shape representation of axisymmetrical, non-spherical particles in discrete element simulation using multi-element model particles. Eng Comput. 1999;16(4):467–480. doi: 10.1108/02644409910271894. [DOI] [Google Scholar]
- 26.Coetzee CJ, Els DNJ. Calibration of discrete element parameters and the modelling of silo discharge and bucket filling. Comput Electron Agric. 2009;65(2):198–212. doi: 10.1016/j.compag.2008.10.002. [DOI] [Google Scholar]
- 27.Freireich B, Ketterhagen WR, Wassgren C. Intra-tablet coating variability for several pharmaceutical tablet shapes. Chem Eng Sci. 2011;66(12):2535–2544. doi: 10.1016/j.ces.2011.02.052. [DOI] [Google Scholar]
- 28.Kodam M, Bharadwaj R, Curtis J, Hancock B, Wassgren C. Force model considerations for glued-sphere discrete element method simulations. Chem Eng Sci. 2009;64(15):3466–3475. doi: 10.1016/j.ces.2009.04.025. [DOI] [Google Scholar]
- 29.Bharadwaj R, Ketterhagen WR, Hancock BC. Discrete element simulation study of a Freeman powder rheometer. Chem Eng Sci. 2010;65(21):5747–5756. doi: 10.1016/j.ces.2010.04.002. [DOI] [Google Scholar]
- 30.Bharadwaj R, Smith C, Hancock BC. The coefficient of restitution of some pharmaceutical tablets/compacts. Int J Pharm. 2010;402(1–2):50–56. doi: 10.1016/j.ijpharm.2010.09.018. [DOI] [PubMed] [Google Scholar]
- 31.Kalbag A, Wassgren C, Penumetcha SS, Perez-Ramos JD. Inter-tablet coating variability: residence times in a horizontal pan coater. Chem Eng Sci. 2008;63(11):2881–2894. doi: 10.1016/j.ces.2008.03.009. [DOI] [Google Scholar]
- 32.Hancock BC, Mojica N, St John-Green K, Elliott JA, Bharadwaj R. An investigation into the kinetic (sliding) friction of some tablets and capsules. Int J Pharm. 2010;384(1–2):39–45. doi: 10.1016/j.ijpharm.2009.09.038. [DOI] [PubMed] [Google Scholar]
- 33.Leaver TM, Shannon HD, Rowe RC. A photometric analysis of tablet movement in a side-vented perforated drum (Accela-Cota) J Pharm Pharmacol. 1985;37(1):17–21. doi: 10.1111/j.2042-7158.1985.tb04924.x. [DOI] [PubMed] [Google Scholar]


