

Abstract
The multi-stage cascade impactor (CI) is widely used to determine aerodynamic particle size distributions (APSDs) of orally inhaled products. Its size-fractionating capability depends primarily on the size of nozzles of each stage. Good Cascade Impactor Practice (GCIP) requires that these critical dimensions are linked to the accuracy of the APSD measurement based on the aerodynamic diameter size scale. Effective diameter (Deff) is the critical dimension describing any nozzle array, as it is directly related to stage cut-point size (d50). d50 can in turn be determined by calibration using particles of known aerodynamic diameter, providing traceability to the international length standard. Movements in Deff within manufacturer tolerances for compendial CIs result in the worst case in shifts in d50 of <±10%. Stage mensuration therefore provides satisfactory control of measurement accuracy. The accurate relationship of Deff to d50 requires the CI system to be leak-free, which can be checked by sealing the apparatus at the entry to the induction port and isolating it from the vacuum source and measuring the rate of pressure rise before each use. Mensuration takes place on an infrequent basis compared with the typical interval between individual APSD determinations. Measurement of stage flow resistance (pressure drop; ΔPstage) could enable the user to know that the CI stages are fit for use before every APSD measurement, by yielding an accurate measure of Deff. However, more data are needed to assess the effects of wear and blockage before this approach can be advocated as part of GCIP.
KEY WORDS: cascade impactor, flow resistance, inhaler testing, mensuration, pressure drop
INTRODUCTION
The aerodynamic particle size distribution (APSD) of the emitted drug substance upon actuation is a critical quality attribute of all orally inhaled drug products (OIPs) (1). The mass of drug substance that is determined as respirable may correlate to clinical outcomes, although this is not always the case (2,3). However, metrics derived from the APSD are currently viewed by the pharmacopeial compendia as the most appropriate way of assessing the quality of the delivered dose of inhaled medication to the patient (4,5). Such methodology is also supported by the regulatory frameworks in Europe (6), Canada (7), and the USA (8). Multi-stage cascade impactors (CIs) are the most appropriate apparatuses to achieve these quality-related measurements (9). Many types of CIs are available (9); however, those most commonly used in OIP aerosol assessments are described in both the European (Ph.Eur.) (4) and United States (USP) (5) Pharmacopeias (Table I). The exceptions are the Twin (Glass) Impinger, which has a single size-fractionating stage and is recognized only by the Ph.Eur., and the five-stage Marple–Miller impactor (MMI), which is accepted for dry powder inhaler (DPI) characterization only in the USP. Note the terms “impactor” and “impinger” are treated as synonymous in this article.
Table I.
Impactors Described in the European and United States Pharmacopeias
| OIP dosage form | Ph. Eur. | USP |
|---|---|---|
| MDI | Apparatus Aa, Db and Ec | Apparatus 1d and 6c |
| DPI | Apparatus Cf, Db and Ec | Apparatus 2e, 3d, 4f and 5c |
| Nebulizerg | Apparatus Aa and Ec at 15 L/min | Harmonized with Ph.Eur. text (15) |
aSingle-stage twin impinger
bAndersen eight-stage non-viable cascade impactor configuration at flow rate of 28.3 L/min
cNext Generation Impactor (NGI) configurations
dAndersen eight-stage non-viable cascade impactor configuration at flow rates other than 28.3 L/min
eMarple–Miller impactor (model 160, MMI)
fMulti-stage liquid impinger (MSLI)
gPh.Eur. 2.9.44 (11) includes the NGI and is harmonized with <1601> of the USP (15)
In 2003, Christopher et al., in the context of establishing a failure investigation process for mass recovery of active pharmaceutical ingredient (API) from CI systems (so-called mass balance failure), developed the concept of Good Cascade Impactor Practice (GCIP) (1). Although useful as a guide to pinpoint potential causes of bias in both mass balance and APSD assessments, this guide did not develop the concept further to provide justification for “in-use” verification of performance based on the critical properties of the CI system, namely stage nozzle diameters, flow rate, and (unintentional) leakage of ambient air into the measurement apparatus. In justification for the lack of such guidance, at the time that this article was published, a quantitative relationship between stage nozzle dimensions and the calibration constants for the CI, based on stage cut-point sizes (d50 values), had not been established. The absence of this essential link in the calibration chain has hampered the ability to arrive at meaningful “in-use” CI performance specifications based on stage mensuration, as recommended for performance verification in the compendia (4,5).
The purpose of the present article is to develop the concept of GCIP to include a regimen for “in-use” CI operation. It is also intended to provide an understanding of how CIs that have been in service for OIP aerosol size characterization might be tested to determine suitability for continued utilization. The proposed “in-use” regimen comprises the following components:
The assessment of ambient air leakage through pathways other than the intended route from the inhaler, by subjecting the complete CI system to a leak test, including induction port and pre-separator (if used) before each APSD determination. This check is most appropriately performed immediately before setting the volumetric flow rate through the system.
The measurement of the size of all nozzles on each size-fractionating stage by optical or other means on a defined, periodic basis to be chosen based on the experience of the user with the aerosol type(s) being assessed as well as frequency of use of the equipment. This check answers the question whether the nozzle dimensions comply with the manufacturer’s intent.
For those with newer systems manufactured in durable metals such as stainless steel, annual mensuration is probably adequate, but regular inspection by all users for mechanical abrasion, corrosion, or plugging is recommended to gather experience on how the CI stage nozzles “age” with repeated use with the products being evaluated in their particular work environment.
Since mensuration, by nature of the complex equipment involved, is only a practical proposition on a relatively infrequent basis compared with the time between successive APSD determinations for the typical user, it would be advantageous to have the capability for an additional check that the stage nozzle arrays maintain the same critical dimensions intended by the manufacturer, ideally before each APSD measurement. Such a capability would thereby avoid the risk of acquiring data with one or more out-of-specification stages that are only discovered at the next mensuration inspection (or perhaps are never discovered because an obstruction is later removed, and all within a mensuration cycle). In principle, the assessment of stage flow resistance through the determination of pressure drop across the stage is such a check. However, its application on a routine basis is, as yet, unproven. A further purpose of this article is therefore to explore data that are currently available in order to establish the case for developing such an approach.
Whether system suitability is ultimately determined in a GCIP environment via periodic stage mensuration alone or augmented by stage flow resistance measurements in use, the ultimate goal is to provide the user with assurance that his/her particular CI will perform aerodynamically the same as newly manufactured impactors, as indicated by the specification for (effective) nozzle array diameter established in the compendia for each stage.
Development of a Framework for CI System Suitability Assessment Based on GCIP
Figure 1 is a schematic illustration of the relationships between measures that could, in principle, be developed to define in-use suitability of a given CI in relation to its design specification, which is described through calibration with particles of known size in terms of aerodynamic performance by the stage d50 values (10). These components, which are at the heart of GCIP, are as follows:
confirmation on receipt of a new CI of conformance with the manufacturer specifications comprising the nominal values of nozzle diameter with associated tolerance for a given impactor stage (from which the acceptable range of Deff values of new impactors can be calculated);
confirmation on receipt of conformance with the compendial-specified dimensions of a new Ph.Eur./USP induction port (IP) and manufacturer specifications for a new pre-separator (PS) (if used);
visual checks to be made before each use for defects that have been acquired in service to surfaces of the IP and PS (if used) that come in contact with OIP-generated aerosols;
verification of the absence of leaks carried out before each use, a process which can be accomplished by the measurement of the time-dependent pressure rise across the full CI system sealed at the inlet entry, after drawing a partial vacuum (new or used CIs);
setting of the volumetric flow rate that is correctly undertaken at the entry to the induction port before each use;
periodic establishment with time-in-service of stage nozzle measurements from which Deff values for a used impactor can be calculated.
Fig. 1.

The relationships between specifications for critical dimensions associated with cascade impactors
The governing principle for GCIP is that a CI should be determined to be suitable for use BEFORE any particles from an inhaler are brought into the measurement apparatus. This principle may sound simple, but it must be emphasized. Just like no one would use a thermometer to determine temperature unless it was calibrated and known to be in working order, CIs function by known aerodynamic principles and therefore should not be used unless they are known to be in accord with their established aerodynamic specifications.
Users are free to impose additional constraints on the testing of any given inhaler, such as a range of humidity or flow rate or sample volume, etc. Such constraints are unique to the inhaler device itself. However, the CI is a measurement tool, and we focus here on the measurement tool (the impactor), not on the device being measured (the inhaler).
The emphasis of this article is primarily on considerations associated with the in-use specification setting for the multi-stage CIs described in the pharmacopeias. However, it is recognized that similar principles should be applicable to single- or two-stage CI apparatuses that might be used in the context of undertaking measurements utilizing the Abbreviated Impactor Measurement (AIM) concept, which is in the process of development at the present time (11–13).
Finally, Fig. 1 also shows the potential for an “in-use” suitability test based on stage flow resistance that can act as a surrogate for measurement of stage effective diameter by optical or other means. The feasibility of such a check is assessed later in this article.
Contribution to APSD Measurement Accuracy from Components of the CI System Other than the Size-Fractionation Stages
A typical CI system used in OIP assessment consists of additional separate components through which the emitted aerosol passes before it is size-fractionated and collected in the CI. Ultimately, the PARTICLE FREE airflow passes to a vacuum source and associated flow control valves located downstream of the system. The final configuration used depends on the inhaled dosage form (4,5,14,15). For example, there will almost certainly be both an IP and PS if a DPI formulation that contains a carrier particulate component is being assessed. However, a PS is not always present even with carrier-based DPIs; its use depends on both the mass of particulate-per-actuation and the particle size distribution of the carrier, and is seldom needed for the other inhaler types. Whatever configuration is adopted, each part operates in series, so that changes taking place in upstream components have the potential to influence the aerosol entering the size-fractionating stages of the CI and therefore the APSD that is ultimately determined.
The following considerations therefore apply:
-
Induction Port (IP): An inlet is required to ensure that the inhaler mouthpiece is oriented with respect to the CI in a fixed horizontal plane, and also to ensure that the aerosol produced is sampled in a defined manner. The IP also serves the purpose of mimicking to a greater or lesser extent depending on its design, the human oropharyngeal region (16). In its role as a model of the entrance to the respiratory tract, the IP collects almost all of the fast moving and so-called ballistic fraction of the inhaler-generated aerosol component of pMDI-produced aerosols formed by flash evaporation of the propellant, and therefore likely to deposit in the oropharynx (16). The pharmacopeial design comprising a straightforward right-angle bend (4,5) is highly simplified both for ease of manufacture and to provide a standardized entry to enable side-by-side comparisons of OIP aerosols to be made. Although a variety of other designs of IP exist (16), the Ph.Eur./USP version is by far the most widely used and familiar to the regulatory agencies, and is therefore the only design considered here. The adoption of an alternative induction port for a regulatory submission in a new OIP would likely involve the development of a validation package in support of its use. For example, the geometry of alternative IPs having so-called idealized aerosol transport similar to anatomically correct inlets is known to significantly affect the APSD that reaches the stages of the CI (17,18). Control of manufacture of the Ph.Eur./USP IP is important, and detailed specifications are therefore provided in the compendia. It would be prudent, in a GCIP regimen, to have the critical internal dimensions of the IP (e.g., angle between entry and exit tubes; entry and exit port diameters) accurately determined by the manufacturer before initial release into the analytical laboratory.
Although some inertial impaction does occur in the IP, this component of the measurement apparatus is not a purely inertial size separator like a CI impaction stage. Instead, other processes, in particular turbulent deposition, are important (19), and the resulting collection efficiency–particle size curve is therefore significantly broader (20). There is also the potential during passage of the aerosol through the IP, for powder deagglomeration particularly with carrier-based DPI formulations, to take place by one or more impaction events to the interior walls of the inlet, followed on each occasion by resuspension of the resulting fragments (21). This process results in a bias towards higher measured values of fine particle mass (22). Furthermore, the behavior of low-density, highly porous particles in IPs during aerodynamic particle size analysis by CI is not well understood. However, Dunbar et al. have commented that such particles, having low envelope densities and reduced area in contact with the walls of the CI apparatus, appear to be more susceptible to bounce and re-entrainment compared with non-porous particles or liquid droplets of equivalent aerodynamic diameter (23). Although Dunbar et al. focused on quantifying and mitigating particle bounce on the collection surfaces used with one particular CI (Andersen eight-stage non-viable impactor operated at 60 L/min), it is likely that a similar behavior would occur in the IP, given that larger-sized incoming particles are more likely to impact on interior surfaces during passage of the aerosol through the inlet. In principle, bias from such behavior could be mitigated by pre-coating the interior surfaces with a tacky substance or by a non-volatile liquid coating (9). However, this practice is not the norm following compendial procedures (4,5), although the recommendation is given to pre-coat critical surfaces of a PS, if used. It would therefore be prudent to undertake a validation study to establish the need for such a precaution, in the event that the formulation being size-analyzed comprised low-density porous particles.
Currently, there are no published studies that have systematically assessed the influence of small variations in the IP geometry on CI-measured APSDs from OIPs. However, given the magnitude of shifts in APSDs observed in studies comparing the Ph.Eur./USP with the recently developed “Alberta” adult idealized throat (24,25), it is likely that “relatively” large changes in the absolute internal dimensions of the IP compared with those associated with the nozzles of a given CI stage would have to occur before the effect on the APSD becomes noticeable. Such changes are most likely in manufacture, rather than in subsequent use, given its robust construction, especially if manufactured in corrosion-resistant stainless steel (26). It is therefore concluded that the contribution to the overall inaccuracy of CI measurements from this component is likely to be relatively minor in comparison with variability associated with stage nozzle aperture size. A visual inspection of the IP, looking for damage to the elbow or the entry or exit regions, is sufficient given that the IPs are aluminum or stainless steel, and should therefore suffice as an “in-use” check that the inlet is fit for use. However, since turbulent deposition is important, the surface roughness of the interior walls will affect the amount of particle deposition if the surface roughness exceeds approximately 1 μm [the size below which turbulent deposition is ineffective in practice (27)]. Surface roughness is unlikely to change in IPs made of 316SS stainless steel. However, aluminum IPs, being amphoteric, are subject to wear through corrosion in either acidic or basic environments. They are also subject to scouring when used with DPI testing. Visual inspection for scratches or dents on internal surfaces, as well as the measurement of surface roughness to ascertain that is it remains smaller than about 0.8 μm (if the appropriate inspection equipment is available), are therefore prudent precautions to confirm continued suitability in use.
Pre-separator (PS): The purpose of a PS is to remove “large” particles from the aerosol exiting the IP (9), particles greater than the maximum size at which a CI is effective (typically particles greater than ca.15 μm aerodynamic diameter). A PS is particularly necessary when large particles of a carrier substance (e.g., lactose) are present in the powder blend used with the DPI, so that such particles with their attendant attached drug particles do not enter the CI. The internal dimensions of the PS are more closely controlled than those of the IP in order to achieve the degree of size separation required. In the case of the NGI, the sharpness of the cut of the PS collection efficiency curve approaches those of the size-separating stages of the CI (28). In contrast with the fixed configuration of the IP, the internal flow path of the PS varies from one CI system to another (4,5). The PS for the NGI is a two-stage size separator, with an internal “scalper” preceded by a more size-selective stage containing six nozzles, where the main pre-separation process takes place (28). Each PS typically has its cut-point size that is suitable to remove the bulk of the carrier particles from the air stream entering the CI at a given flow rate. Flow through one particular PS (used with the ACI) has been shown by modeling, using a computational fluid dynamics approach, to be a complex mixture of laminar and turbulent regimes (29). However, inertial size separation generally predominates (29), so that control of the nozzle diameters of the main size-separating component is therefore important, as far as determining the overall accuracy of the CI system. Although optical mensuration is potentially suitable for determining these dimensions, simpler techniques such as the use of calibrated pin gauges might be more convenient, given that PS nozzle sizes are typically several millimeters in diameter. However, care in their use is counseled for reasons explained later in the context of using such gauges to measure the diameters of the larger stage nozzles of the CI. Visual inspection of the interior of the PS for damage to surfaces exposed to the internal flow pathway, combined with optical inspection or possibly pin-gauging of the main size-fractionating orifices to meet with the specifications in the compendia (NGI—dimension “a” = 12.80 ± 0.05 mm; ACI—radius of entry nozzle at exit plane = 6.70 ± 0.03 mm) is therefore likely to be acceptable as a test to meet an “in-use” specification. However, it should be noted that manufacturing tolerances for the exit nozzles from the PS of the ACI [nominal radius = 6.3 mm (20)] are not provided in the current compendia, nor is the fact that there are currently three different pre-separator configurations commercially available for use at nominal flow rates of 28.3 L/min, 60 L/min, and 90 L/min, respectively (30).
The Impactor (CI): The primary function of the CI is to separate the particles containing or comprising active drug substance into aerodynamic size bins in both a precise and accurate manner. Inertial size separation normally takes place in a laminar flow regime (31), so that the conformance and stability in use of the dimensions of the nozzles of each stage are therefore critical for the most accurate work. The widely used Andersen “non-viable” apparatus is an eight-stage system (ACI), derived from the original Andersen (viable) cascade impactor (32). Since the original ACIs that were manufactured in aluminum were applied to pMDI testing in the late 1980s (33), little modification has occurred to the basic design (critical dimensions), apart from a reduction in the nozzle-to-collection plate separation distance for all stages from 2.5 mm reported by Andersen (32) to 1.6 mm, as reported by two current manufacturers of ACIs (34,35). In the last 10 years or so, improved manufacturing procedures, such as the use of acid-resistant stainless steel, and better control of critical dimensions during manufacture have also occurred with the ACI. The move to more chemically resistant materials of construction was driven by the discovery of large variations in nozzle diameters compared with their nominal values by Stein and Olson (36) and Nichols (37). In a later article, Nichols discussed the development and use of nozzle specifications as the way forward to improve “in-use” accuracy (38), a concept that has been brought to maturity in the present article.
The multi-stage liquid impinger (MSLI) was designed with OIPs specifically in mind and accepted into the pharmacopeia. The calibration of the four-stage compendial apparatus, justifying the stage orifice dimensions adopted, was published in 1997 (39). It too can potentially be subjected to stage mensuration, although published data describing the process and resulting measurements appears to be unavailable.
The Next Generation Impactor (NGI) was purpose-designed and calibrated by an industry consortium at 30, 60, and 100 L/min for the assessment of pMDI and DPI products (20), with its operating range later extended to 15 L/min for the assessment of nebulizing systems (40). One of the key criteria underlying its design was that it would have better aerodynamic particle size-separating capability (sharper, non-overlapping, stage collection efficiency curves) than those of the Andersen eight-stage CI. As a result, considerable effort was placed on the definition of the tolerances for the nozzles of each stage to be established in the pharmacopeial methods (4,5).
The back-up filter is the only other component of note within the CI itself. The purpose of this component is to trap all particulate that has penetrated beyond the last size-fractionating stage, and as such the concept of a d50 size has no meaning. Apart from information about its overall size (diameter) for some apparatuses, the compendia are silent on the type of filter that can be used. In a GCIP environment, the nature of the filter is therefore unimportant beyond the requirements that it has a flow resistance and particle capture efficiency that are recommended by the CI manufacturer. However, given its role, it is prudent precaution to inspect the filter for visible defects after insertion into its support before assembling the impactor. The multi-orifice collector (MOC) may be used in place of, or in addition to, a back-up filter with the NGI. This component comprises a plate with a 75-mm-diameter array of 4,032 holes, each having a nominal diameter of 70 μm (28). The designers of the NGI have pointed out that although the MOC may appear to be an impaction stage, this is specifically not the intent for its incorporation into the design, and judgments about the size of material collected on the stage are not recommended (28). The archival calibration of the NGI provided an opportunity to assess the size-collection properties of the MOC, but instead of reporting its d50 value like an impaction stage, the decision was made to publish only the sizes at which this component collected 80% of the incoming mass (d80) values (20), which are 0.36, 0.14, and 0.07 μm at 30, 60, and 100 L/min, respectively. In a GCIP regimen, the MOC should therefore be treated like a re-usable filter and inspected for visual defects before each use. The designers of the NGI also made the important qualification that this component will not be useful (i.e., fully efficient at capturing the extrafine particles) for all formulations. In consequence, it is assumed that the decision whether or not to use the internal or external back up filter options for the NGI will have been made as part of method development for the particular OIP being assessed.
Implementation of GCIP: In-Use CI System Suitability Checks
Leak Tightness
The flow through the CI system from the IP entry onwards is generated by application of a partial vacuum, either using a purpose-built vacuum pump or a central vacuum source attached to the apparatus after the filter collection stage. If a DPI is being evaluated, the flow control system, comprising the two-way solenoid valve upstream of the flow control valve set to operate at critical flow, will be located between the CI and the vacuum source (4,5), whereas for pMDI and nebulizer testing, all that is needed is a good-quality adjustable flow control valve. Since the pressure experienced by the air flow as it passes through the apparatus steadily decreases with respect to ambient air pressure, it follows that any unintended leakage, such as may be caused by an inter-stage seal failure, will result in preferential ingress of ambient air rather than movement of the aerosol from the IP that is located at the most distal point from the perspective of the vacuum source. It is therefore highly important that a check of system integrity is performed before the flow rate into the system is set at the nominal value (see below). Ideally, this check should be made before each APSD determination since the CI of whatever design will have been disassembled and reassembled between successive measurements. Figure 2 summarizes a strategy that could be used for implementing such a practice. In the construction of the NGI, a leak rate smaller than 6 kPa/min was defined as constituting a “good seal” for the assembled CI (28). Suggested maximum acceptable leakage rates would therefore be of the order of 10 kPa/min for systems using the NGI and slightly higher at close to 15 kPa/min for ACI-based systems, and leakage rates <1 kPa/min are likely to be of no consequence (41). The detection of leak rates of this order is readily possible with a simple digital pressure gauge and stop clock.
Fig. 2.
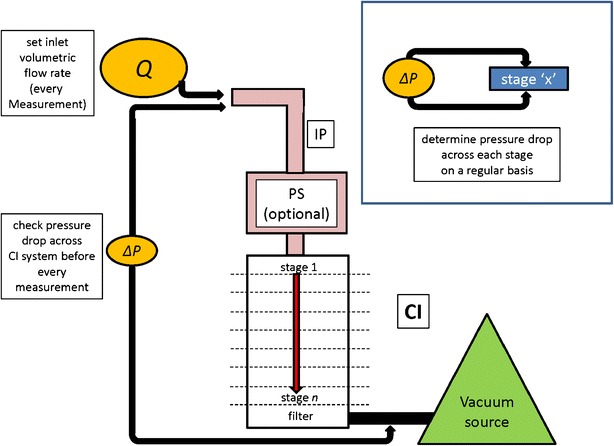
Strategy for implementing CI System leak testing as part of “in-use” GCIP
Flow Rate
Control of the volumetric flow rate, Q, through the CI system also affects both the precision and accuracy of CI-based measurements (42). In contrast with the potential for bias for a particular stage if its Deff falls out of specification, error in setting Q affects the accuracy of the entire CI. It therefore follows that accurately establishing Q, once the impactor system has been verified as leak tight, is as important as confirming the aerodynamic size fractionating performance of the stages through mensuration, as previously discussed. A calibrated digital flowmeter that has been demonstrated to be accurate to within ±5% of the nominal value of Q should ideally be used for the purpose.
Olsson and Asking have comprehensively reviewed methods of setting and measuring flow rates for CIs, to which the reader is referred for more information (42). Key aspects from their work to note are that:
it is the volumetric and not the mass flow rate that is important;
the flow rate should ideally be set at the entry to the IP.
If a flowmeter is located downstream of the CI to monitor air flow during the APSD determination, such measurements, unless corrected for the reduced pressure at the measurement location, should only be used as an indicator of flow stability.
STAGE MENSURATION AS A KEY COMPONENT OF GCIP
The intent of the stage mensuration process in a GCIP environment is to provide assurance to stakeholders that the CI used to make OIP aerosol APSD measurements is in condition to make measurements of acceptable accuracy. Currently, the pharmacopeial compendia provide specifications for each stage, in most instances with appropriate tolerance limits for nominal nozzle diameter (4,5).
CI Stage Nozzle Specifications in Relation to Impactor Theory
Both the theory of inertial impaction in laminar flow and the determination of APSD by multi-stage CI, making use of this theory, are well understood and described in detail elsewhere (9,31). The relationship between the size-fractionating capability of a given stage having a single nozzle of diameter D, which is defined in terms of the aerodynamic diameter at which it collects incoming particles with 50% efficiency (i.e., its d50 size), is related to the operating characteristics of the stage as follows:
 |
1 |
in which St50 is the particle Stokes number, a dimensionless quantity that describes its resistance in curvilinear motion as the ratio of the stopping distance at the average nozzle exit velocity (proportional to the volumetric flow rate, Q) to the “average” nozzle diameter ( ) of a stage comprising “n” separate nozzles at the same location (Fig. 3). The other parameters relate to the slip correction term, C50, air viscosity (η), and unit density (CGS system) (ρ0), all of which are constants for particular measurement conditions, and therefore need not be considered further in terms of system verification.
Fig. 3.
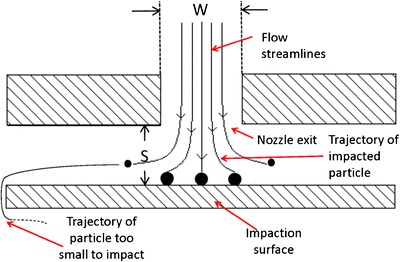
Cross-section through an ideal single-stage impactor showing the motion of particles of different sizes; W is the nozzle exit diameter (a critical dimension for verification) and S is the nozzle exit to collection surface distance (relatively insensitive to variability in a well-designed system)
The relationship defined in Eq. (1) is explicit in the case of a stage containing a single nozzle (n = 1). However, in order to accommodate the flow rate range required to test OIPs (typically from 15 to 100 L/min), manufacturers have resorted to stages containing several, nominally identical-sized orifices. This development results in the need to solve the problem of how to define a characteristic nozzle diameter that represents the complete array for a given stage. In 2005, Roberts and Romay provided a practical way to solve this problem for multi-orifice stages (35), by defining a new term “effective diameter (Deff)” that is a combination of both area mean (D*) and area median (Dmedian) diameters for a given array of multiple nozzles, according to the expression:
 |
2 |
For well-maintained impactors, Roberts and Romay showed that there is little difference in the magnitudes of D* and Dmedian (35).
In addition, Roberts (43) later showed that Deff and d50 are related explicitly at a fixed Q, through the expression:
 |
3 |
Given Eqs. (2) and (3), it is therefore possible in principle to link variability associated with measures of Deff with changes in d50. This is an important consideration, as taking the multi-stage impactor as the complete apparatus for OIP aerosol APSD determinations, the actual values of d50 for each stage (d50, 1, d50, 2, etc.) define the absolute accuracy of the system. Furthermore, stage d50 can be verified by calibration with monodisperse particle standards using techniques that are fully traceable ultimately to the international length standard (10).
Compendial Verification of CI Stage Nozzle Diameters
The compendial verification of most multi-orifice CI stages is currently undertaken optically by the so-called stage mensuration approach. This process involves using optical image analysis methods in which the individual nozzle exit apertures are measured either for area or circumference, or for both metrics, and from which diameter is calculated (44). Roundness can also be assessed if both area and circumference are measured. Pin gauges may also be used for stages containing orifices larger than about 2-mm diameter (44). However, there are limitations to the use of pin gauges, and optical mensuration may therefore be preferred for the following reasons:
Pin gauges are invasive, and care is required with the use of “go/no go” gauges to check stages made from softer metal or where corrosion may have occurred (45);
The accuracy of gauge-determined jet diameter is affected by the circularity of the nozzle being assessed;
Manual use of pin gauges is tedious for stages containing hundreds of nozzles.
To date, the compendia have provided tables containing the nominal diameters for each apparatus (Tables II, III, IV, and V), and in some cases, these have included the manufacturing tolerances associated with each stage nozzle array. There is no nozzle specification for the back-up filter stage for each apparatus, as its purpose is to catch everything that penetrates beyond the last size-fractionating stage regardless of the underlying physical processes that result in particle capture. For the same reason, just the number of holes and an average size is provided in the case of the MOC that is used with the NGI since either an external or internal back-up filter can be used in conjunction with this component in order to achieve complete capture of extrafine particles penetrating stage 7. It should be noted that in instances in which the pertinent data are missing from the compendial methods (i.e., for the MSLI), the tolerances associated with nominal nozzle diameter in these tables have been provided by the impactor manufacturers for the sake of completeness.
Table II.
Manufacturing Specification for the Jet Nozzles of Individual Stages of the Andersen Eight-Stage Non-viable CI (ACI) Variantsa
| Stageb | Number of nozzles | D (mm) | Flow rated (L/min) | Stage d 50 (μm) | |||||
|---|---|---|---|---|---|---|---|---|---|
| Nominal value | Tolerance (TOL) | Nominal value d 50-nom | Value at D + TOL d 50-max | +Δd 50 (%) | Value at D − TOL d 50-min | −Δd 50 (%) | |||
| −2 | 95 | 5.50 | ±0.025 | 90 only | 9.0 | 9.1 | +1.1 | 8.9 | −1.1 |
| −1 | 96 | 4.50 | ±0.025 | 60 and 90 | 9.0 | 9.1 | +1.1 | 8.9 | +1.1 |
| 0/−0c | 96 | 2.55 | ±0.025 | 28.3, 60, or 90 | 9.0 | 9.1 | +1.1 | 8.9 | +1.1 |
| 1 | 96 | 1.89 | ±0.025 | 5.8 | 5.9 | +1.7 | 5.7 | −1.7 | |
| 2 | 400 | 0.914 | ±0.013 | 4.7 | 4.8 | +2.1 | 4.6 | −2.1 | |
| 3 | 400 | 0.711 | ±0.013 | 3.3 | 3.4 | +3.0 | 3.2 | −3.0 | |
| 4 | 400 | 0.533 | ±0.013 | 2.1 | 2.2 | +4.8 | 2.0 | −4.8 | |
| 5 | 400 | 0.343 | ±0.013 | 1.1 | 1.2 | +9.1 | 1.0 | −9.1 | |
| 6 | 400 | 0.254 | ±0.013 | 28.3 or 60 | 0.65 | 0.70 | +7.7 | 0.60 | −7.7 |
| 7 | 201 | 0.254 | ±0.013 | 28.3 only | 0.43 | 0.46 | +7.0 | 0.40 | −7.0 |
aUSP and Ph.Eur. specifications, augmented by manufacturer specifications for high flow rate configurations
bStages 0 to 7 are used at 28.3 L/min and flow rates up to 60 L/min; stages −1 to 6 are used at 60 L/min (high flow rate configuration 1); stages −2 to 5 are used at 90 L/min (high flow rate configuration 2)
cStage 0 is modified to accept one or more stages above it for use at either of the higher flow rate configurations
dIndicated flow rate(s) are those for which individual stages of this CI can be used in the appropriate configuration identified in footnote (b)
Table III.
Manufacturing Specification for the Jet Nozzles of Individual Stages of the Model 160 Marple–Miller (MMI) CIa
| Stage | Number of nozzles | D (mm) | Stage d 50 at 60 L/min (μm) | |||||
|---|---|---|---|---|---|---|---|---|
| Nominal value | Tolerance (TOL) | Nominal value d 50-nom | Value at D + TOL d 50-max | +Δd 50 (%) | Value at D − TOL d 50-min | −Δd 50 (%) | ||
| 1 | 1 | 16.80 | ±0.05 | 10.0 | 10.04 | +0.4 | 9.96 | −0.4 |
| 2 | 20 | 3.40 | ±0.03 | 5.0 | 5.07 | +1.4 | 4.93 | −1.4 |
| 3 | 40 | 1.70 | ±0.01 | 2.5 | 2.52 | +0.8 | 2.48 | −0.8 |
| 4 | 80 | 0.84 | ±0.01 | 1.25 | 1.27 | +1.6 | 1.23 | −1.6 |
| 5 | 160 | 0.41 | ±0.01 | 0.625 | 0.650 | +4.0 | 0.60 | −4.0 |
aUSP specifications
Table IV.
Manufacturing Specification for the Jet Nozzles of Individual Stages of the Four-Stage Multi-Stage Liquid Impinger (MSLI)a
| Stage | Number of nozzles | D (mm) | Stage d 50 at 60 L/min (μm) | ||||||
|---|---|---|---|---|---|---|---|---|---|
| Nominal value | Tolerance (TOL) | Nominal value d 50-nom | Value at D + TOL d 50-max | +Δd 50 (%) | Value at D − TOL d 50-min | −Δd 50 (%) | |||
| 1 | 1 | 25.0 | ±0.1b | 13.0 | 13.08 | 0.6 | 12.92 | 0.6 | |
| 2 | 1 | 14.0 | ±0.1b | 6.8 | 6.87 | 1.0 | 6.73 | 1.0 | |
| 3 | 1 | 8.0 | ±0.1 | 3.1 | 3.16 | 1.9 | 3.04 | 1.9 | |
| 4 | Inlet | 7 | 6.3* | ±0.1b | 1.7 | 1.75 | 2.9 | 1.65 | 2.9 |
| Outlet | 2.7* | ±0.05b, c | |||||||
aUSP and Ph.Eur. specifications
bCourtesy: Copley Scientific Ltd., Nottingham, UK
c d 50 calculations relate to D eff determined based on the outlet nozzle diameter
Table V.
Manufacturing Specification for the Jet Nozzles of Individual Stages of the Next Generation Pharmaceutical Impactor (NGI)a
| Stage | Number of nozzles | D (mm) | Stage d 50 at 60 L/min (μm) | |||||
|---|---|---|---|---|---|---|---|---|
| Nominal value | Tolerance (TOL) | Nominal value d 50-nom | Value at D + TOL d 50-max | +Δd 50 (%) | Value at D − TOL d 50-min | −Δd 50 (%) | ||
| Pre-separator | 6 | 12.80 | ±0.05 | 12.7 | 12.77 | 0.6 | 12.63 | 0.6 |
| 1 | 1 | 14.30 | ±0.05 | 8.06 | 8.10 | 0.5 | 8.02 | 0.5 |
| 2 | 6 | 4.88 | ±0.04 | 4.46 | 4.51 | 1.1 | 4.41 | 1.1 |
| 3 | 24 | 2.185 | ±0.02 | 2.82 | 2.86 | 1.4 | 2.78 | 1.4 |
| 4 | 52 | 1.207 | ±0.01 | 1.66 | 1.68 | 1.2 | 1.64 | 1.2 |
| 5 | 152 | 0.608 | ±0.01 | 0.94 | 0.96 | 2.1 | 0.92 | 2.1 |
| 6 | 396 | 0.323 | ±0.01 | 0.55 | 0.57 | 3.6 | 0.52 | 3.6 |
| 7 | 630 | 0.206 | ±0.01 | 0.34 | 0.37 | 8.8 | 0.32 | 8.8 |
aUSP and Ph.Eur. specifications
Although the nozzle diameter specifications given in Tables II, III, IV, and V are by themselves a useful compilation of manufacturing specifications for the compendial CIs, this information has thus far been of limited value in defining the absolute accuracy of the CI method for the following reasons:
The relationship described by Eq. (2) has not been used to define specifications in terms of Deff for multi-orifice stages, instead the compendial method (4,5) just reports nominal values for “average” nozzle diameter, and in most instances also includes the associated manufacturer-specified tolerance;
More significantly, the published tolerances associated with “average” nozzle diameter have not been linked directly with the corresponding tolerances associated with stage d50, in accordance with Eq. (3).
Ideally, such information would be of value because, as mentioned above, stage d50 is the most fundamental measure of the performance of a given stage in terms of its cut point on the aerodynamic diameter size-scale. Taking the multi-stage impactor as a complete apparatus for size-fractionating OIP aerosols, the accuracy of the APSD determination depends critically on the associated accuracy of the cut-point sizes for each individual stage.
Defining “In-Use” Specifications for CI Stages
The challenge in defining in-use specifications for CIs that are linked in a meaningful way to the accuracy of an APSD determination is to relate variations in stage mensuration data to the corresponding changes in stage d50. Given the proven link that exists between Deff and d50 for a given CI stage through Eq. (3), it is logical to extend the information contained in Tables II, III, IV, and V by calculating extreme values of Deff based on the existing manufacturing tolerances, assuming all the nozzles in the array are at the upper and lower extreme sizes, respectively. In this instance, Eq. (3) is used to determine the corresponding range of d50 values about the nominal size reported from published calibration data for each CI system [ACI (4,5), MMI (46), MSLI (39), and NGI (20)] that have been determined at a given value of Q. The following observations can be made from these data:
Although the relationship between Deff and d50 for a given stage is non-linear, in accordance with Eq. (3), the changes in the latter performance measure brought about by movements in the Deff to the extremes of the manufacturing tolerances for all stages of all these apparatuses are sufficiently small (<±10% of nominal under worst case conditions) and the shifts in Δd50 are essentially symmetric about the nominal value for a given stage;
As a general rule, the magnitude of shifts in Δd50 increase as the size of individual nozzles in a given stage array decreases. This outcome is expected, given that there is a finite tolerance to which nozzles can be manufactured when they are individually smaller than about 1 mm in diameter;
The small increase in Δd50 for stage 5 of the ACI compared with the two following stages (Table II) appears at first sight to be counter to the behavior just described. However, these calculations rely on the precision to which the nominal stage d50 has been specified; stages for this impactor with d50 values <1.0 μm aerodynamic diameter have reported precision to two decimal places, in comparison with one-decimal-place precision for the remaining stages whose d50 values exceed this limit. In other words, the true Δd50 for stage 5 would likely be smaller than the reported value of ±9.1%, if calibration of the ACI was to be undertaken with greater precision. However, it should also be recognized that in absolute terms, the difference between the extreme upper and lower limits, as reported, is very small (0.2 μm);
The two-decimal-place precision for the stage d50 values for the NGI (Table V) is justified by the quality of the archival calibration for this impactor (20). In this instance, the behavior of Δd50 with increasing stage number (smaller Deff) follows the expected pattern. Even in the worst case (stage 7), Δd50 was only ±8.8%, and it is notable that for all the other stages, values of Δd50 were substantially smaller, being close to ±1% for the upper stages 1 to 4. In absolute terms, these differences are very small (<0.05 μm).
The comparatively low susceptibility of both the MMI (Table III) and MLSI (Table IV) to changes in Deff reflects the fact that both apparatuses have fewer and larger diameter nozzles than would be the case for stages associated with the other impactors, having commensurate d50 values. Even though the manufacturing tolerances for the MSLI (±0.1 mm for stages 1 to 3 and ±0.05 mm for the outlet of stage 4) are significantly larger than the equivalent tolerances associated with the other CIs that are typically in the range from ±0.01 mm to ±0.05 mm, the larger nominal Deff values for the MSLI offset the effect of shifts in Deff on stage d50.
These illustrations demonstrate that stage mensuration has an important role to play in the periodic validation of CI accuracy. However, provided that the measures of Deff for all stages of a given CI lie within the manufacturer’s tolerance range, the values of ±Δd50, expressed as a percentage of nominal d50, indicate that effect on the accuracy of APSD-related measures will likely be sufficiently small even under worst-case conditions to be acceptable for the characterization of OIP-generated aerosols. This outcome has to be appreciated in the context of the relative magnitudes of other sources of bias, in particular from the incorrect setting of volumetric flow rate to the CI, which should always be undertaken at the inlet to the IP by an appropriately calibrated flowmeter (42), and also in the potential for leakage of ambient air into the measurement system through uncontrolled pathways, such as via defective inter-stage seals associated with some CI designs (1).
ASSURANCE THAT THE CI IS FIT-FOR-SERVICE: FURTHER CONSIDERATIONS
Robustness of the CI Stage Mensuration Process: The European Pharmaceutical Aerosol Group (EPAG) Experience
In 2009, an assessment of the variety of optical measuring image analysis equipment in use for measuring the area or diameter of nozzle apertures as the key component of the stage mensuration process was undertaken by EPAG (44). This multi-laboratory study defined both the accuracy, by means of transfer of standard “objects”, and precision, by a round-robin comparison of two CI stages representing “large” and “small” nozzles, for all the commonly used mensuration systems. Importantly, in the context of this article, every measuring system evaluated was found to be suitable for the task, defined as being capable of discriminating consistently nozzle dimensional variations commensurate with the tolerance limits in the pharmacopeial specifications (4,5).
In summary, their investigations indicated the following facts:
The nozzle projected area or diameter for each stage of a CI is the critical parameter upon which the accuracy of the overall CI system depends;
In the case of multi-nozzle stages, the concept of effective diameter enables the results of mensuration to be combined into a single metric for that CI stage that is linked in a meaningful way with its aerodynamic performance, expressed in terms of its d50 value;
Manufacturers are able to produce CIs, controlling individual stage nozzle dimensions within the tolerances defined in the compendia;
The optical image analysis equipment reported in the study for stage mensuration is fit-for-purpose.
The Potential for Setting Stage Nozzle “In-Use” Specifications Based on Stage Mensuration
Beyond confirmation that these apparatuses are well behaved in terms of theoretical expectations, it is important in the context of developing “in-use” mensuration specifications for equipment being used to assess OIP quality, and to understand and quantify the dominant sources of bias and imprecision (47). Such information is also needed in order to support claims that the listed CIs are fit-for-purpose as compendial apparatuses in the OIP quality control environment. It is also reasonable to assume, as the current pharmacopeial methods do, that dimensions defined as critical, in this case stage nozzle array size, should be both controlled during manufacture and monitored periodically to ensure that the impactor will perform aerodynamically in a correct fashion. In this way, assurance can be provided to stakeholders involved with the assessment of OIP performance that APSD measurements are both accurate upon commissioning of a new CI and remain so in subsequent use (4,5). For example, the Ph.Eur. monograph relating to the use of the CI for the measurement of aerosol APSD from pressurized metered dose inhaler (pMDI) and dry powder inhaler (DPI) assessments states: “Stage mensuration is performed periodically together with confirmation of other dimensions critical to the effective operation of the impactor” (4). In the context of providing a rationale for the present article, no further guidance is provided by the current pharmacopeial monographs on what constitutes “in-use”. This situation therefore leaves it to the user to make the most appropriate decision concerning the timing between successive mensuration checks. Furthermore, currently, specifications against which to assess mensuration data “in use” are not given, other than the provision of manufacturing tolerances for some, but not all, CI systems. With the now developed link between stage nozzle dimensions and stage d50, the user can establish “in-use” specifications for impactors based on Deff criteria to support fitness for use in the analytical laboratory through the usable life of the instrument.
Limitations of Stage Mensuration as an Assurance Process
Stage mensuration is undeniably a useful tool to verify CI accuracy on a periodic basis and is therefore a key component of GCIP. Nevertheless, it suffers from the intrinsic weakness that by the time that a stage is discovered to have its Deff “out of specification,” a period of time, during which an indeterminate number of measurements may have been made, will have elapsed since that stage had been verified as acceptable, either by the manufacturer when new, or from a previous mensuration exercise. To the best of the knowledge of the authors, there are currently no publicly available data demonstrating how Deff changes with CI use. Such data would have to be capable of distinguishing between elapsed time since prior mensuration events and time-in-service actually making measurements, to be helpful as a predictive aid to the user concerned with monitoring stage performance changes brought about by repeated use. It is also possible for Deff to move “out-of-specification” for a given period of time and subsequently return within the defined acceptance limits, a process that would go undetected between mensurations. To set this potential detraction in its proper context, the risk of such an occurrence is low for a well-maintained instrument using validated methodologies. Establishing proper and efficient methods of ensuring good in-use impactors is something that currently takes a substantial validation, although it is done well by many of today’s practitioners. However, a significant quantity of testing occurs with most methods long before extensive validation is performed, so it would be advantageous if the burden and risks of potential mensuration failures could be reduced with a simple check serving as a verification of system suitability before each measurement. Stage flow resistance or pressure drop has the potential to fulfill this role.
An Alternative Approach to Assurance: Exploring the Relationship between Mensuration and Air Flow Resistance (Pressure-Drop) Measurements
Rationale
Stage mensuration is ideally performed at regular defined time intervals, typically on an annual basis for either a particular stage or complete CI assembly. The important issue of concern is that if the mensuration interval is set by some arbitrarily defined time interval (and the compendia are silent on this issue), this verification of stage suitability will not necessarily be related to the degree of usage between successive mensurations. Taken to an (unworkable) extreme, mensuration would be undertaken as a system suitability check before each APSD determination, much as is recommended in terms of system leakage and flow rate setting. In this way, the operator would know in advance that the measurements being made were not biased from this cause. However, optical mensuration is not a process that can be so-used, as it requires highly specialized equipment, and is also too time consuming to be feasible as a verification tool or suitability test before each and every APSD determination. This limitation is most unlikely to be of any consequence concerning the measurement-to-measurement performance of a given CI since these days the stage nozzles are manufactured in durable materials that are resistant to either chemical erosion or wear through mechanical abrasion. Furthermore, OIP-generated aerosols are likely to be sufficiently dilute that nozzle plugging is a gradual rather than an instantaneous process from one measurement to the next. Note, however, that CI (and associated stage nozzle) cleaning forms part of the wider applicability of GCIP (1), and the regimen chosen for such maintenance should be OIP type (e.g., mass of particulate emitted per actuation and formulation physico-chemical properties) and frequency of CI use dependent.
Given this background information, at first sight it would seem that the incorporation of both pharmacopeial and in-use specifications based on pressure drop (or more accurately, “flow resistance”) would seem to be a highly advantageous and a desirable goal. However, before exploring the practicality of this idea in the laboratory setting where many CI measurements may be made every day in a GxP environment, it is necessary to explore the link further between stage pressure drop (ΔPstage) and Deff from the theoretical perspective in order that the limitations can be properly assessed in the light of current knowledge about how impactor stage nozzle arrays behave with repeated use.
When undertaken on a stage-by-stage basis, pressure-drop measurements, although more complex, can provide information about the condition of the nozzles of the stage under consideration. This is because the pressure drop (ΔPstage x) across an impactor stage “x” can be described well by a Bernoulli-style equation:
 |
4 |
in which ρair is the density of air, At is the total area of the nozzle array, and K is an experimentally determined parameter (discharge coefficient) that accounts for frictional losses and other detailed geometric factors characteristic of multiple air jets (48). Milhomme et al. (49) showed that a change in D* [the area-mean jet diameter of a stage from Eq. (2)] from D*0 to D*1 can be related to a change in ΔPstage(x), in accordance with the following relationship:
 |
5 |
in which the subscripts “0” and “1” represent the initial and final states, respectively. For well-maintained CIs, characteristic of good laboratory pharmaceutical practices, there is little difference between the area-mean and effective jet diameters (32) so that Eq. (5) may be rewritten on a stage-by-stage basis in terms of Deff:
 |
6 |
where the pressure drop across each stage, given by ΔPn, can easily be measured by a flow resistance monitor, similar to or identical with the equipment that was initially developed for use with the ACI (49). Milhomme et al. (49) were further able to demonstrate the method to have a high capability factor (k) by calculating the relationship:
 |
7 |
in which Deff(upper) and Deff(lower) are the upper and lower tolerance limits for Deff for each stage, and σ represents the standard deviation of the distribution of the array of Deff values, assuming it to be unimodal and normally distributed. A value of k ≥1.00 would be considered as an acceptable process control. They reported that the repeatability of their Deff measurements, using a prototype instrument to measure flow resistance as the surrogate for ΔP, was within the ±3σ range criterion (k ≥ 1.00) for each ACI stage (Table VI).
Table VI.
Repeatability of W eff Measurements by Flow Resistance Monitor for the ACI Reported by Milhomme et al. (49)
| Stage | D eff | |||
|---|---|---|---|---|
| Nominal (mm) | Tolerance (mm) | σ (mm) | k | |
| 0 | 2.55 | ±0.025 | 0.00621 | 1.34 |
| 1 | 1.89 | ±0.025 | 0.000798 | 10.4 |
| 2 | 0.914 | ±0.013 | 0.000327 | 12.9 |
| 3 | 0.711 | ±0.013 | 0.000479 | 8.83 |
| 4 | 0.533 | ±0.013 | 0.000364 | 11.6 |
| 5 | 0.343 | ±0.013 | 0.0000606 | 70.0 |
| 6 | 0.254 | ±0.013 | 0.0000369 | 115 |
| 7 | 0.254 | ±0.013 | 0.0000374 | 113 |
Looking at the small pressure drop values measured for stage 0 (approximately 10 Pa at 60 L/min flow), the uncertainty in the Deff value was reported as being ca. 6 μm, or 25% of the tolerance allowed for the effective diameter of this stage for new CIs. For the remaining stages where the magnitude of the pressure differential was always greater than that for stage 0, three times the experimentally determined value of σ for Deff was found to be ≤1 μm. On this basis, Milhomme et al. (49) concluded that their flow resistance monitor is as precise as the best reported optical mensuration equipment for determining changes in the effective diameter of an impactor stage. In practical terms, this finding means that, provided comparable flow resistance monitoring technology can be developed for each compendial apparatus (highly feasible), in principle, monitoring of ΔP is an acceptable alternative to stage mensuration. However, it has to be recognized that to become an attractive addition to stage mensuration, particularly for laboratories with a small number of CIs, effort needs to be placed on developing the design of such equipment from a research tool to make it fully suitable for routine use.
Limitations of the Approach
Equation 5 assumes that the flow resistance discharge coefficient, K, in Eq. (4) remains constant. This coefficient is a measure of the deviation from Bernoulli’s principle (43). A perfect nozzle with full recovery of the Bernoulli “dynamic pressure” has a flow coefficient of 1.0. Fresh, clean nozzles in the NGI have a flow coefficient of approximately 0.7 to 0.8 (the precise value is provided on each NGI certificate of conformance), and fresh, clean nozzles in the ACI have a flow coefficient in the range of approximately 0.60 to 0.77 [Table VII (50)]. However, it has to be recognized that imperfections that may arise in use are highly likely to increase the flow resistance. In this case, Deff calculated by Eq. (5) would decrease; however, the user would not know if the observed change has arisen from a decrease in the discharge coefficient or from a true physical blockage at the nozzle exit plane, such as could be observed by traditional optical inspection. Use of Eq. (5), therefore, will be conservative—meaning that if anything, one would take the CI out of service to do stage mensuration earlier than absolutely necessary. Furthermore, the user would be prudent to document any changes in the discharge coefficient by measuring flow resistance after each stage mensuration event.
Table VII.
Nozzle Discharge Coefficients (K) Calculated for 24 Different ACIs [from Roberts et al. (50)]
| Stage | Manufacturer | |||
|---|---|---|---|---|
| Thermo Electron (n = 16) | Copley Scientific (n = 8) | |||
| Mean ± SD | CofV (%) | Mean ± SD | CofV (%) | |
| 0 | 0.770 ± 0.024 | 3.1 | 0.748 ± 0.010 | 1.3 |
| 1 | 0.730 ± 0.011 | 1.5 | 0.728 ± 0.004 | 0.5 |
| 2 | 0.680 ± 0.006 | 0.9 | 0.667 ± 0.011 | 1.6 |
| 3 | 0.664 ± 0.007 | 1.1 | 0.658 ± 0.004 | 0.6 |
| 4 | 0.661 ± 0.006 | 0.9 | 0.655 ± 0.006 | 0.9 |
| 5 | 0.649 ± 0.013 | 2.0 | 0.677 ± 0.002 | 0.3 |
| 6 | 0.648 ± 0.014 | 2.1 | 0.668 ± 0.004 | 0.6 |
| 7a | 0.595 ± 0.013 | 2.2 | 0.633 ± 0.005 | 0.8 |
aLow values for K may have been caused by connection at base of CI stack to vacuum source
Currently, there is a lack of published data on “in service” changes. Although the calculated values of K reported by Roberts et al. (50) for 24 different ACIs showed systematic differences between impactors from one manufacturer and another, presumably arising from different machining practices in manufacture, there was no trend in variability [expressed in terms of the coefficient of variation (CofV) from stage to stage]. The slightly lower values for K reported for stage 7 (the lowermost size-fractionating stage) were attributed to the connection between the base of the CI stack and vacuum source. More recently, Shelton has provided hitherto unpublished data (Fig. 4) for stage 4 of six different NGIs. The nominal value of Deff for this stage is 1.207 ± 0.01 mm (Table V). Each NGI was optically mensurated annually with flow resistance measurement collected at each inspection. These data were evaluated at each mensuration cycle to compare the predicted Deff in accordance with Eq. (6) with the actual Deff obtained for the instrument using Deff from the immediate prior inspection time point along with the flow resistance data obtained from both the inspection time point and the immediate preceding inspection. In between mensuration exercises, these impactors had been in service completing APSDs tests on a regular basis for a variety of pMDI and DPI products (∼500 measurements/year), although not necessarily identical for all the CIs in this group. As improvements in manufacturing controls in NGI production have been made over time (48), the serial numbers of these instruments fall in the following category ranges: NGI number 1 was manufactured within the first 200 NGIs, NGI numbers 2 and 3 were produced in the second 200 NGIs, and NGI numbers 4–6 are in the third group of 200 NGIs. This data set that was acquired during a 3- to 7-year period, depending on impactor number, indicates the following:
each NGI had unique stage 4 characteristics in terms of its Deff–service time profile, but all values of mensurated Deff were within specification (two of the mensurated Deff values for NGI number 3 were at the lower bound of specification)
there are many instances where the CIs would have been close to or outside an “alert limit” based on Deff determined by stage pressure drop. In four instances (two for NGI number 1 and one each for NGI numbers 3 and 5), the magnitude of Deff determined from pressure drop would have resulted in a false declaration that the CI in question was out of specification, when optical mensuration, currently the accepted arbiter of performance, would have confirmed that the pertinent stages were within specification.
while the range of pressure-drop values is widest for the single impactor produced within the first 200 instruments, a reduction in the range of values for instruments among the more recently manufactured groups is not apparent.
Fig. 4.
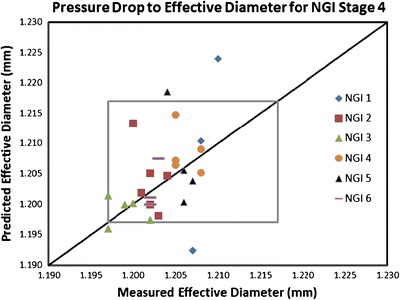
The relationship of effective diameter D eff from annual mensuration (one data point per mensuration) to predicted D eff from flow resistance measurements (stage pressure drop) for stage 4 (nominal D eff = 1.207 mm) for six NGIs; the gray square represents the range for D eff allowed by the manufacturer tolerance for this stage (±0.01 mm) in Table V
In summary, of the 26 data points shown in this figure, one third would have created a warning that would have necessitated an optical inspection per recommendation when in fact these instruments have been found to have been dimensionally stable in service. The root cause of these discrepancies appears to reside with changes in the value of K with time, in association with the large effect this coefficient has on the magnitude of stage pressure drop (51). Given this ambiguous situation, it is self-evident that more data are needed to be collected with compendial CIs (particularly the ACI and NGI), with defined in-service life, in order to establish whether or not stage pressure drop is sufficiently consistent to be usable as a system suitability test “in use” with appropriate specification limits (that need not be identical with those that currently exist for stage mensuration).
A related concern is the sensitivity of stage pressure drop to changes in nozzle array geometry brought about by plugging of individual holes. To investigate sensitivity of the flow resistance technique in a systematic way, Lavarreda et al. (52) intentionally caused increases in flow resistance by successively blocking more of the open area of each stage array of an otherwise clean NGI stages, using a light-cure adhesive. In the example shown in Fig. 5, they plugged two, four, six, and finally eight nozzles of the 396-nozzle array of NGI stage 6, measuring flow resistance at each step. This figure illustrates the relationship between the area mean diameter [D* in Eq. (1)] calculated from optical stage mensuration (used as a surrogate for Deff, as this was a clean and fresh CI) with flow resistance based on pressure-drop measurements for this stage that were made with a highly accurate pressure transducer forming part of a flow resistance monitor (FRM; MSP Corp., St Paul, Minnesota, USA). As expected, values of D* from stage mensuration decreased as flow resistance increased (squares in Fig. 5), but remained well within the manufacturer-specified tolerance band from 0.313 to 0.333 mm (Table V). The flow-resistance-estimated values of D* (triangles in Fig. 5) diverged in the direction of reduced sensitivity from the corresponding mensurated values of D* as the number of plugged nozzles increased; however, a strong correlation between D* and flow resistance was still present (R2 = 0.995), suggesting that the proposed method for checking Deff based on stage pressure drop would be viable as a surrogate for optical mensuration for this stage. The difference between D* obtained between the theoretical and experimentally determined results as a percentage of the tolerance for Deff, specified in Table V, was only 2.8% with eight plugged nozzles (2% of the total nozzle area). This deviation was observed to be even smaller at 0.4% with 40 out of 630 nozzles plugged (6.3% total area) with stage 7 that has the finest nominal Deff of 0.206 mm (Table V). However, the corresponding deviations obtained were much greater with stages having much larger nozzle sizes, indicating the sensitivity of the flow resistance method to changes in Deff had decreased. For example, the corresponding deviations for stages 3 and 4, having nominal Deff values of 2.185 mm and 1.207 mm, respectively, were 152.8% and 30.9%. These values were each obtained with four blocked nozzles, representing 16.7% and 7.7% of the total nozzle area for stages 3 and 4, respectively. In summary, the suite of data generated by Lavarreda et al. (52) confirm (unsurprisingly) that stage flow resistance becomes less sensitive to changes in D* (or Deff) as total nozzle area increases. In practical terms, this limitation may not be as severe as at first sight, given that the manufacturer of the NGI has observed from the inspection of many impactors that are returned from use for stage mensuration at their facility, that plugging is most likely to occur with the stages having the finest nozzles. In fact, these findings indicate that future development of stage flow resistance equipment and its subsequent use may be best focused on CI stages possessing the finest nozzles, where the need for such a diagnostic tool appears to be greatest.
Fig. 5.
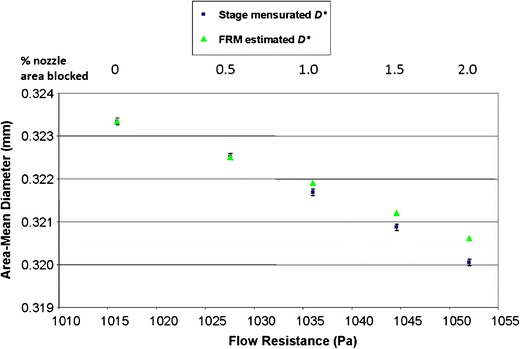
Relationship between optically mensurated area-mean diameter and flow resistance-predicted area-mean diameter (D*) for stage 6 of an NGI, intentionally blocking two, four, six, and eight out of the 396-nozzle array for this stage; the fully open condition is also shown at far left of the figure
Thus far, the discussion has considered possible changes to nozzles of a given CI stage, focusing on the exit plane, by virtue of the fact that this dimension is provided by the straightforward optical mensuration procedures in current use (44). However, in the context of understanding how the discharge coefficient may vary apparently in an inconsistent manner with respect to Deff values from mensuration, it should be appreciated that the possibility of changes in the nozzles outside of the exit plane (nozzle walls) is something that is not well addressed in current cascade impaction theory.
Application of GCIP to the Life Cycle for the CI System
Table VIII outlines suggested requirements for stage mensuration associated with the development and implementation of GCIP for use with all categories of OIP throughout the life cycle of a given CI system. In addition to these processes, a complete “in-use” specification would include the measurements suggested above for the IP and PS (if used), as well as visual inspection of each component of the system for damage before each and every use. Inspection of all seals used to ensure air-tightness of the apparatus should also form a critical and therefore regular part of the in-use appraisal, and a leak test should therefore be performed on the entire assembled system immediately before each APSD measurement.
Table VIII.
CI Stage Mensuration Regimen Complying with GCIP
| Stage of impactor use | Proposed mensuration requirements | Specification |
|---|---|---|
| New | All critical dimensions measured and within specification to permit installation qualification (IQ). | Manufacturer’s specification for critical dimensions, published either in the pharmacopeial compendia or in the peer-reviewed technical literature |
| Use with existing product and validated methodology | Assumes knowledge base is in existence: annual check of critical dimensions, including stage mensuration | In-use: D eff in same range as new CIs |
| Use with new products, and new methodology, e.g., changes to solvents, pH of agents in contact with stage nozzles | Assumes no knowledge base: | In-use: D eff in same range as new CIs |
| (a) 6 monthly (or less) check of critical dimensions, including stage mensuration | ||
| (b) Reduce frequency of mensuration to annual or alter testing to reduce wear/corrosion/plugging if permitted |
CONCLUSION
A regimen for GCIP “in-use” guidance has been provided in this article in order to guide users in the assurance of CI accuracy for the routine assessment of OIP-generated aerosols. CI theory has advanced to the point at which there is the potential for the implementation in the pharmacopeial compendia of a robust calibration chain linking the critical stage nozzle dimensions to size-fractionation performance that is directly relatable to APSD measurement accuracy, based on stage d50 values. The maintenance of such traceability “in use” is at the heart of the proposed extension to GCIP. Tables have been provided comparing the effect of movements of stage Deff in the direction of either extreme of the published manufacturing tolerance range on the corresponding d50 size have therefore been provided for the ACI, MMI, MSLI, and NGI, representing the current compendial CI apparatuses. In consequence, it is now possible to know for certain that a given CI meeting the manufacturing specifications given in the pharmacopeias will be capable of determining APSDs to a defined degree of accuracy. Movements in Deff within these limits have been shown to result, taking the worst case (in general associated with the finest nozzle diameters), in shifts of <±10% in d50 for the compendial apparatuses. However, with the exception of the ACI, the calculated shift is <±5% for stages capturing much of the mass of active pharmaceutical ingredient in OIP testing. The potential application for a new “in-use” test, based on measurement of time-in-service dependent changes in stage flow resistance, has also been explored. From the small amount of evidence that has been gathered from published studies, it is concluded that substantially more data are required to provide a better understanding how the nozzle discharge coefficient linking stage flow resistance to effective diameter evolves in typical use, before this approach, with attendant specifications, can be recommended.
Acknowledgments
The authors wish to acknowledge the support received through members of the Impactor Sub-Team of the European Pharmaceutical Aerosol Group (EPAG) during discussions related to the topics covered by this article. They also wish to acknowledge Copley Scientific, and Westech Instrument Services, for the supply of data and other information from time to time that helped provide the comprehensive coverage of CI characteristics reported in this article.
References
- 1.Christopher D, Curry P, Doub B, Furnkranz K, Lavery M, Lin K, et al. Considerations for the development and practice of cascade impaction testing including a mass balance failure investigation tree. J Aerosol Med. 2003;16(3):235–247. doi: 10.1089/089426803769017604. [DOI] [PubMed] [Google Scholar]
- 2.Mitchell J, Newman S, Chan H-K. In vitro and in vivo aspects of cascade impactor tests and inhaler performance: a review. AAPS PharmSciTech. 2007;8(4). doi:10.1208/pt0804110. Article 110. [DOI] [PMC free article] [PubMed]
- 3.Newman SP, Chan H-K. In vitro/in vivo comparisons in pulmonary drug delivery. J Aerosol Med. 2008;21(1):1–8. doi: 10.1089/jamp.2007.0643. [DOI] [PubMed] [Google Scholar]
- 4.European Directorate for Quality in Medicines and HealthCare (EDQM). Monograph 2.9.18: European Pharmacopeia, Preparations for inhalation: aerodynamic assessment of fine particles, Council of Europe, 67075 Strasbourg, France, 2012; Ph.Eur.7.5 [USB 7th ed. (7.52012)].
- 5.United States Pharmacopeial Convention. Chapter 601: Aerosols, Nasal Sprays, Metered-Dose Inhalers and Dry Powder Inhalers. Rockville, MD, USA, 2012; USP 35-NF 30.
- 6.European Medicines Agency (EMA). Guideline on the Pharmaceutical Quality of Inhalation and Nasal Products London, UK, 2006; EMEA/CHMP/QWP/49313/2005 Corr. 2006. http://www.ema.europa.eu/docs/en_GB/document_library/Scientific_guideline/2009/09/WC500003568.pdf. Accessed 4 Oct 2012.
- 7.Health Canada (HC): Guidance for Industry: Pharmaceutical Quality of Inhalation and Nasal Products, Ottawa, Canada, 2006; Document 06-106624-547. http://www.hc-sc.gc.ca/dhp-mps/prodpharma/applic-demande/guide-ld/chem/inhalationnas-eng.php. Accessed 4 Oct 2012
- 8.United States Food and Drug Administration (FDA). Draft Guidance: Metered Dose Inhaler (MDI) and Dry Powder Inhaler (DPI) Drug Products Chemistry, Manufacturing and Controls Documentation. United States Food and Drug Administration, Rockville, MD, USA. 1998; Docket 98D-0997. http://www.fda.gov/downloads/Drugs/…/Guidances/ucm070573.pdf. Accessed 4 Oct 2012.
- 9.Mitchell JP, Nagel MW. Cascade impactors for the size characterization of aerosols from medical inhalers: their uses and limitations. J Aerosol Med. 2003;16(4):341–377. doi: 10.1089/089426803772455622. [DOI] [PubMed] [Google Scholar]
- 10.Mitchell JP. Particle standards: their development and application. Kona Powder Part J. 2000;18:41–59. [Google Scholar]
- 11.Mitchell JP, Nagel MW, Doyle C, Ali RS, Avvakoumova V, Christopher D, Quiroz J, Strickland H, Tougas T, Lyapustina S. Relative precision of inhaler aerodynamic particle size distribution (APSD) metrics by full resolution and abbreviated Andersen Cascade Impactors (ACIs): part 1. AAPS PharmSciTech. 2010;11(2):843–51. [DOI] [PMC free article] [PubMed]
- 12.Mitchell JP, Nagel MW, Doyle C, Ali RS, Avvakoumova V, Christopher D, Quiroz J, Strickland H, Tougas T, Lyapustina S. Relative precision of inhaler aerodynamic particle size distribution (APSD) metrics by full resolution and abbreviated Andersen Cascade Impactors (ACIs): part 2—investigation of bias in extra-fine mass fraction with AIM-HRT impactor. AAPS PharmSciTech. 2010;11(3):1115–1118. doi: 10.1208/s12249-010-9473-1. [DOI] [PMC free article] [PubMed] [Google Scholar]
- 13.Mitchell JP, Tougas T, Christopher JD, Lyapustina S, Glaab V. The Abbreviated Impactor Measurement and Efficient Data Analysis concepts: why use them and when. In: Dalby RN, Byron PR, Peart J, Suman JD, Farr SJ, Young PM, editors. Respiratory drug delivery—2012. River Grove: Davis Healthcare; 2012. pp. 731–735. [Google Scholar]
- 14.European Directorate for Quality in Medicines and HealthCare (EDQM). Monograph 2.9.44: European Pharmacopeia, Preparations for nebulisation: characterisation. Council of Europe, 67075 Strasbourg, France, 2012; Ph.Eur.7.5 [USB 7th ed. (7.52012)].
- 15.United States Pharmacopeial Convention. Chapter 1601: Products for Nebulization—Characterization Tests. Rockville, MD, USA, 2012; USP 35-NF 30.
- 16.Dolovich M, Rhem R. Impact of oropharyngeal deposition on inhaled dose. J Aerosol Med. 1998;11(Supple 1):112–115. [PubMed] [Google Scholar]
- 17.Mitchell JP, Copley M, Sizer Y, Russell T, Solomon D. Adapting the Abbreviated Impactor Measurement (AIM) concept to make appropriate inhaler aerosol measurements to compare with clinical data: a scoping study with the “Alberta” Idealized Throat (AIT) inlet. J Aerosol Med Pulmon Deliv. 2012;25(4):188–197. doi: 10.1089/jamp.2011.0925. [DOI] [PubMed] [Google Scholar]
- 18.Zhang Y, Gilbertson K, Finlay WH. In vivo–in vitro comparison of deposition in three mouth–throat models with Qvar® and Turbuhaler® inhalers. J Aerosol Med. 2007;20(3):227–235. doi: 10.1089/jam.2007.0584. [DOI] [PubMed] [Google Scholar]
- 19.Stein SW, Gabrio BJ. Understanding throat deposition during cascade impactor testing. In: Dalby RN, Byron PR, Farr SJ, Peart J, editors. Respiratory drug delivery VII. Raleigh: Serentec; 2000. pp. 573–576. [Google Scholar]
- 20.Marple VA, Olson BA, Santhanakrishnan K, Roberts DL, Mitchell JP, Hudson-Curtis BL. Next generation pharmaceutical impactor. Part II. Calibration. J Aerosol Med. 2003;16(3):301–324. doi: 10.1089/089426803769017668. [DOI] [PubMed] [Google Scholar]
- 21.Tong Z, Yang R, Yu A, Adi S, Chan H-K. Unravelling the mechanics of deagglomeration through experiments based upon complex modelling theory. In: Dalby RN, Byron PR, Peart J, Suman JD, Farr SJ, Young PM, editors. Respiratory drug delivery—2012. River Grove: Davis Healthcare; 2012. pp. 355–365. [Google Scholar]
- 22.Tong ZB, Yang RY, Yu AB, Chan H-K. Numerical study of aerosolization of carrier based dry powder inhalation systems. In: Dalby RN, Byron PR, Peart J, Suman JD, Farr SJ, Young PM, editors. Respiratory drug delivery—2012. River Grove: Davis Healthcare; 2012. pp. 821–826. [Google Scholar]
- 23.Dunbar C, Kataya A, Tiangbe T. Reducing bounce effects in the Andersen cascade impactor. Int J Pharm. 2005;301:25–32. doi: 10.1016/j.ijpharm.2005.04.039. [DOI] [PubMed] [Google Scholar]
- 24.Copley M, Mitchell J, Solomon D. Evaluating the Alberta throat: an innovation to support the acquisition of more clinically applicable aerosol aerodynamic particle size distribution (APSD) data in oral inhaled product (OIP) development. Inhal. 2011;5(4):12–16. [Google Scholar]
- 25.Zhang Y, Finlay WH. Experimental measurements of particle deposition in three proximal lung bifurcation models with an idealized mouth–throat. J Aerosol Med. 2005;18(4):460–473. doi: 10.1089/jam.2005.18.460. [DOI] [PubMed] [Google Scholar]
- 26.Roberts DL, Marple VA. Induction port assembly for impactors and method for assembly. US Pat. Appl. Pub. 2002/0070548, June 13, 2002.
- 27.Moody LF. Friction factors for pipe flows. Trans ASME. 1944;66(8):671–684. [Google Scholar]
- 28.Marple VA, Roberts DL, Romay FJ, Miller NC, Truman KG, Van Oort M, Olsson B, Holroyd MJ, Mitchell JP, Hochrainer D. Next generation pharmaceutical impactor. Part 1: design. J Aerosol Med. 2003;16(3):283–299. doi: 10.1089/089426803769017659. [DOI] [PubMed] [Google Scholar]
- 29.Sethuraman VV, Hickey AJ. Evaluation of pre-separator performance for the 8-stage nonviable Andersen impactor. AAPS PharmSciTech. 2001;2(1):E4. doi: 10.1208/pt020104. [DOI] [PMC free article] [PubMed] [Google Scholar]
- 30.Copley Scientific Ltd. Quality solutions for inhaler testing—brochure. Nottingham, UK: Copley Scientific Limited; 2012, p.35. Available at: http://www.copleyscientific.com/editorials.asp?c=42&d=13, Accessed 10 Aug 2012.
- 31.Marple VA, Liu BYH. Characteristics of laminar jet impactors. Environ Sci Technol. 1974;8(7):648–654. doi: 10.1021/es60092a003. [DOI] [Google Scholar]
- 32.Andersen A. A sampler for respiratory health assessment. Am Ind Hyg Assoc J. 1966;27(2):160–165. doi: 10.1080/00028896609342810. [DOI] [PubMed] [Google Scholar]
- 33.Boundy MG, Leith D, Knowles MR. Dispersion and size distribution of amiloride by metered dose and dry powder inhalers. J Aerosol Med. 1990;3(4):233–241. doi: 10.1089/jam.1990.3.233. [DOI] [Google Scholar]
- 34.Smurthwaite M. Westech Instrument Services, UK. Personal communication. 2011.
- 35.Roberts DL. Theory of multi-nozzle impactor stages and the interpretation of stage mensuration data. Aerosol Sci Technol. 2009;43(11):1119–1129. doi: 10.1080/02786820903204060. [DOI] [Google Scholar]
- 36.Stein S, Olson BA. Variability in size distribution measurements obtained using multiple Andersen mark II cascade impactors. Pharm Res. 1997;14(12):1718–1725. doi: 10.1023/A:1012175612193. [DOI] [PubMed] [Google Scholar]
- 37.Nichols SC. Calibration and mensuration issues for the standard and modified impactor. Pharmeuropa. 2000;12(4):585. [Google Scholar]
- 38.Nichols SC. Particle size distribution parameters using the Next Generation pharmaceutical impactor. In: Dalby RN, Byron PR, Peart J, Suman JD, Farr SJ, editors. Respiratory drug delivery—IX. River Grove: Davis Healthcare; 2004. pp. 485–487. [Google Scholar]
- 39.Asking L, Olsson B. Calibration at different flow rates of a multistage liquid impinger. Aerosol Sci Technol. 1997;27(1):39–49. doi: 10.1080/02786829708965456. [DOI] [Google Scholar]
- 40.Marple VA, Olson BA, Santhanakrishnan K, Roberts DL, Mitchell JP, Hudson-Curtis BL. Next generation pharmaceutical impactor. Part III. Extension of archival calibration to 15 L/min. J Aerosol Med. 2004;17(4):335–343. doi: 10.1089/jam.2004.17.335. [DOI] [PubMed] [Google Scholar]
- 41.Roberts DL. MSP Corporation. Personal communication. 2012.
- 42.Olsson B, Asking L. Methods of setting and measuring flow rates in pharmaceutical impactor experiments. Pharm Forum. 2003;29(3):879–884. [Google Scholar]
- 43.Roberts DL, Romay FJ. Relationship of stage mensuration data to the performance of new and used cascade impactors. J Aerosol Med. 2005;18(4):396–413. doi: 10.1089/jam.2005.18.396. [DOI] [PubMed] [Google Scholar]
- 44.Chambers F, Ali A, Mitchell J, Shelton C, Nichols S. Cascade impactor (CI) mensuration: an assessment of the accuracy and precision of commercially available optical measurement systems. AAPS PharmSciTech. 2010;11(1):472–484. doi: 10.1208/s12249-010-9405-0. [DOI] [PMC free article] [PubMed] [Google Scholar]
- 45.Svensson M, Pettersson G, Asking L. Stage mensuration of the Andersen impactor—pitfalls and recommendations. In: Drug delivery to the lungs—13. London: The Aerosol Society; 2002. pp. 188–191. [Google Scholar]
- 46.Marple VA, Olson BA, Miller NC. A low-loss cascade impactor with stage collection cups: calibration and pharmaceutical inhaler applications. Aerosol Sci Technol. 1995;22(1):124–134. doi: 10.1080/02786829408959732. [DOI] [Google Scholar]
- 47.Sarker DK. Quality control, analytical validation and pharmacopoeial testing. Business Briefing—Future Drug Discovery. 2004:38–41. http://www.touchbriefings.com/2A6AD410-D886-4189-8A78-6C7B2AD54803/FinalDownload/DownloadId-20339FC03D11ADFFAA11CB63631C51CD/2A6AD410-D886-4189-8A78-6C7B2AD54803/pdf/890/PT04_sarker.pdf. Accessed 4 Oct 2012.
- 48.Roberts DL, Lavarreda C. Controlling flow resistance as a means of reducing inter-impactor variability. In: Dalby RN, Byron PR, Peart J, Suman JD, Farr SJ, editors. Respiratory drug delivery. River Grove: Davis Healthcare; 2008. pp. 661–664. [Google Scholar]
- 49.Milhomme K, Dunbar C, Lavarreda C, Roberts D, Romay F. Measuring changes in the effective jet diameter of cascade impactor stages with the flow resistance monitor. In: Dalby RN, Byron PR, Peart J, Suman JD, Farr SJ, editors. Respiratory drug delivery. River Grove: Davis Healthcare; 2006. pp. 405–407. [Google Scholar]
- 50.Roberts DL, Lavarreda C, Milhomme K, Shelton C. Managing impactor quality with measurements of flow resistance and effective diameter. Drug delivery to the lungs—17. Edinburgh: The Aerosol Society; 2006. pp. 243–246. [Google Scholar]
- 51.Shelton C, Roberts DL. Application of flow resistance measurements to cascade impactor quality control. Drug delivery to the lungs—16. Edinburgh: The Aerosol Society; 2005. pp. 221–224. [Google Scholar]
- 52.Lavarreda C, Roberts D, Romay F. Cascade impactor qualification: evaluating the correlation between the area-mean jet diameter and the flow resistance of cascade impactor stages. Proc. 7th Int. Aerosol Conf. St. Paul, MN, USA, 2006:840.