

Abstract
The voltage-gated, K+-selective ether á go-go 1 (EAG1) channel is expressed throughout the brain where it is thought to regulate neuronal excitability. Besides its normal physiological role in the brain, EAG1 is abnormally expressed in several cancer cell types and promotes tumor progression. Like all other channels in the KCNH family, EAG1 channels have a large intracellular carboxy-terminal region that shares structural similarity with cyclic nucleotide–binding homology domains (CNBHDs). EAG1 channels, however, are not regulated by the direct binding of cyclic nucleotides and have no known endogenous ligands. In a screen of biological metabolites, we have now identified four flavonoids as potentiators of EAG1 channels: fisetin, quercetin, luteolin, and kaempferol. These four flavonoids shifted the voltage dependence of activation toward more hyperpolarizing potentials and slowed channel deactivation. All four flavonoids regulated channel gating with half-maximal concentrations of 2–8 µM. The potentiation of gating did not require the amino-terminal or post-CNBHD regions of EAG1 channels. However, in fluorescence resonance energy transfer and anisotropy-based binding assays, flavonoids bound to the purified CNBHD of EAG1 channels. The CNBHD of KCNH channels contains an intrinsic ligand, a conserved stretch of residues that occupy the cyclic nucleotide–binding pocket. Mutations of the intrinsic ligand in EAG1 (Y699A) potentiated gating similar to flavonoids, and flavonoids did not further potentiate EAG1-Y699A channels. Furthermore, the Y699A mutant CNBHD bound to flavonoids with higher affinity than wild-type CNBHD. These results suggest that the flavonoids identified here potentiated EAG1 channels by binding to the CNBHD, possibly by displacing their intrinsic ligand. EAG1 channels should be considered as a possible target for the physiological effects of flavonoids.
INTRODUCTION
Ether á go-go 1 (EAG1) (also known as Kv10.1) is a voltage-gated, K+-selective ion channel encoded by the KCNH1 gene. These channels are activated by membrane depolarization and undergo little or no inactivation. In the healthy adult, EAG1 channel expression is confined to the central nervous system (Ludwig et al., 1994) and found in functionally diverse regions including the hippocampus (Gómez-Varela et al., 2010) and retina (Jow and Jeng, 2008). Whereas the physiological role of EAG1 channels in the brain has yet to be determined, outside of the nervous system, abnormal EAG1 channel expression is tightly associated with cancer (Pardo et al., 1999). For example, EAG1 channel expression has been documented in several primary cancer cells including liver, prostate, ovary, colon, melanoma, and thyroid (Meyer et al., 1999; Pardo et al., 1999; Farias et al., 2004; Camacho, 2006; Ousingsawat et al., 2007). Moreover, inhibition of EAG1 channel activity with an antibody or siRNA reduces DNA synthesis and proliferation of tumor cells (Pardo et al., 2005). Despite this well-documented role in cancer, little is known about how EAG1 channels are regulated in vivo.
The KCNH family of channels belongs to a larger group of channels regulated by the direct binding of cyclic nucleotides (Fig. 1 A). This superfamily of channels includes CNG, hyperpolarization-activated, cyclic nucleotide–modulated (HCN), and KCNH channels. All channels in this group share characteristic sequence and structural similarity within their intracellularly located carboxy-terminal region (Fig. 1 B) (Guy et al., 1991; Warmke and Ganetzky, 1994; Brelidze et al., 2012; Marques-Carvalho et al., 2012). This region includes a cyclic nucleotide–binding homology domain (CNBHD) and a C-linker that connects it to the pore (Craven and Zagotta, 2006). The cyclic nucleotides cAMP and cGMP are ligands for HCN and CNG channels and regulate channel gating by binding to their CNBHD. Cyclic nucleotides, however, do not regulate KCNH family channels by direct binding (Brelidze et al., 2009).
Figure 1.

Dendrogram and basic architecture of channels of the cyclic nucleotide–regulated superfamily. (A) Phylogenetic tree depicting the evolutionary relationships of the KCNH, CNG, and HCN ion channel families, computed with Cobalt (Papadopoulos and Agarwala, 2007) and displayed with Dendroscope (Huson et al., 2007). (B) Schematic of the architecture of a single mEAG1 subunit, with the structure of the CNBHD shown in magenta (Marques-Carvalho et al., 2012) and the tyrosine and leucine of the intrinsic ligand shown in blue. Inset includes a close-up view of the tyrosine and leucine of the intrinsic ligand superimposed with cAMP (yellow) from the HCN2 structure (Zagotta et al., 2003). Superposition of the mEAG1 and mHCN2 structures was done through residues in the β roll.
Even though cyclic nucleotides do not directly regulate KCNH channels, the CNBHD of KCNH channels shares structural similarity with the CNBHD of HCN and CNG channels. The CNBHD of both KCNH and HCN channels consists of an antiparallel β roll and three α helices (αA-αC) (Zagotta et al., 2003; Brelidze et al., 2012; Marques-Carvalho et al., 2012). One key structural difference between the CNBHD of KCNH and HCN2 channels, however, lies in the pocket where cAMP binds to HCN. The “cyclic nucleotide–binding pocket” of KCNH channels is occupied by six well-conserved amino acids after the αC helix, which we refer to as the intrinsic ligand. The intrinsic ligand resides in an equivalent position to cyclic nucleotides in HCN and MlotiK1 channels (Fig. 1 B) (Brelidze et al., 2012; Marques-Carvalho et al., 2012). Specifically, the space occupied by the purine ring of cAMP in the HCN2 structure is filled with the aromatic ring of a tyrosine, and the cyclic phosphate group location is filled with the side chain of a leucine two residues later in the sequence (Brelidze et al., 2012; Marques-Carvalho et al., 2012).
Mutations of the intrinsic ligand have large effects on KCNH channel gating (Brelidze et al., 2012; Marques-Carvalho et al., 2012). For example, replacing the intrinsic ligand’s tyrosine with an alanine or deletion of the tyrosine and leucine of the intrinsic ligand shifts the voltage dependence of activation in zebrafish EAG-like potassium channel (ELK) channels toward more depolarizing potentials (Brelidze et al., 2012). Mutation of the hEAG1 intrinsic ligand shifts the voltage dependence of activation to either more depolarizing or more hyperpolarizing potentials, depending on the mutated residues (Marques-Carvalho et al., 2012). These results suggest that the intrinsic ligand may play a physiological role in regulation of channel gating.
We have shown previously that the flavonoid luteolin potentiates mEAG1 channels (Brelidze et al., 2010). Luteolin shifts the voltage dependence of activation to more hyperpolarizing voltages and slows the rate of deactivation. Here, we further characterized the flavonoid regulation of EAG1 channels and shed light onto the molecular mechanism underlying this potentiation. Using inside-out patch-clamp recording, we identified four flavonoids as regulators of EAG1 channel gating. We found that deletion of the intracellular amino-terminal or post-CNBHD regions does not interfere with the flavonoid regulation of the channel. Two fluorescence-based binding assays demonstrated that the flavonoids bind to the purified CNBHD from EAG1 channels. Mutation of the intrinsic ligand of the CNBHD eliminated flavonoid regulation of the intact channel and caused flavonoids to bind more tightly to the purified CNBHD. These results suggest that flavonoids potentiate EAG1 channels by binding to the CNBHD perhaps by displacing their intrinsic ligand.
MATERIALS AND METHODS
Materials
All chemicals were purchased from Sigma-Aldrich.
Electrophysiology
The cDNA encoding the mouse EAG1 channel (mEAG1) in the pGH19 vector was provided by G. Robertson (University of Wisconsin-Madison, Madison, WI). The cRNA was transcribed using the T7 mMessage mMachine kit (Ambion). Xenopus laevis oocytes were defolliculated and injected with the cRNA as described previously (Zagotta et al., 1989). After manual removal of the vitelline membrane, currents were recorded in the inside-out patch configuration (Hamill et al., 1981) with a patch-clamp amplifier (EPC-10; HEKA). Patch pipettes were pulled from borosilicate glass and had resistances of 0.40–1 MΩ after fire polishing. Various solutions were applied to patches with a solution changer (RSC-100; Bio-Logic). The intracellular (bath) and extracellular (pipette) solutions contained 130 mM KCl, 10 mM HEPES, and 0.2 mM EDTA, pH 7.2. The mEAG1 currents were elicited by applying a series of 0.1-s test pulses to voltages ranging from −140 to +50 mV in 10-mV increments from a holding potential of −100 mV, followed by a 0.1-s voltage pulse to −120 mV. Currents were not leak subtracted. Data were acquired with Pulse software (HEKA) and analyzed with Igor (WaveMetrics). Statistical analyses were performed in Excel (Microsoft). All data are plotted as mean ± SEM.
To obtain conductance–voltage relationships, peak tail current amplitudes at −120 mV were normalized to the largest peak current amplitude, which followed a step to +50 mV. These normalized data were then plotted against the test voltage and fit with a Boltzmann function:
| (1) |
where V represents the test voltage, V1/2 is the midpoint activation voltage, and s is the slope of the relation. Two-tailed t tests were used to identify flavonoids with significant effects on mEAG1 channel gating. To fit conductance–voltage relationships of channels with inactivating current, the normalized data were fit with a product of two Boltzmann functions:
| (2) |
where sa represents the slope of activation, si is the slope of inactivation, V1/2a is the midpoint of activation, V1/2i is the midpoint of inactivation, and b is the noninactivating conductance at depolarized voltages.
To determine concentration–response relationships, plots of both the ΔV1/2 and the deactivation time constants versus free flavonoid concentration were fit with Hill equations:
| (3) |
where Y0 represents the minimum response, Y∞ represents the maximum response, Kd represents the apparent binding affinity, and n is the Hill coefficient.
Mutations
Deletions and point mutations were generated in the wild-type mEAG1 background using overlapping PCR primer methods. Amplified fragments were digested with appropriate enzymes and ligated into the pGH19 vector. All mutations were confirmed by automated sequencing (Fred Hutchinson Sequencing Facility and Gene Wiz).
Protein expression and purification
Two protein constructs were used to determine whether flavonoids bound to purified CNBHD of mEAG1. For fluorescence resonance energy transfer (FRET) experiments, the proximal carboxy-terminal region of the mEAG1 channel was purified as described previously (Brelidze et al., 2009). This protein included the C-linker and CNBHD, residues 505–702 of the full-length mEAG1 channel. For protein expression, the DNA encoding the C-linker/CNBHD was subcloned into the pETGQ vector. For anisotropy experiments, wild-type or Y699A mutant CNBHD was purified as described previously (Marques-Carvalho et al., 2012). This protein included a small part of the C-linker, the entire CNBHD, and the 20 following residues (residues 552–724). For protein expression, this vector was subcloned into the pETM11 vector.
Each construct for protein purification was individually transformed into BL21 (DE3) cells and induced with 1 mM IPTG (isopropyl-1-thio-β-d-galactopyranoside) at an OD600 of 0.6–0.8. To purify the proteins, the BL21 cells were lysed in an Emulsiflex C3 (Avestin), and insoluble protein was separated by centrifugation for 45 min at 131,000 g at 4°C. Ni2+-NTA chromatography was then used to purify the protein of interest from the supernatant. The 8× His tag was cleaved by proteolysis with thrombin (EMD Millipore) for the C-linker/CNBHD protein or with TEV for the CNBHD protein. Each protein was further purified with size-exclusion chromatography on a Superdex 200 10/300 column (GE Healthcare) equilibrated with the buffer used for the subsequent experiments (for the C-linker/CNBHD: 150 mM KCl, 10% glycerol, 1 mM TCEP, and 30 mM HEPES, pH 7.5; for the CNBHD: 150 mM NaCl, 20 mM Tris, and 1 mM TCEP, pH 7.5). Protein concentrations were determined by absorbance at 280 nm. The purified protein was stored at −80°C in small aliquots and thawed immediately before the experiments.
Fluorescence measurements
Fluorescence intensity and anisotropy were each recorded in a 100-µl quartz cuvette with a spectrophotometer (Fluorolog 3) using FluorEssence software (both from HORIBA, Jobin Yvon). For tryptophan-to-flavonoid FRET, the fluorescence emission spectra of 4 µM mEAG1 C-linker/CNBHD or 4 µM of free tryptophan were recorded in the absence and presence of 100 µM fisetin or 10 nM to 150 µM quercetin. Samples were excited with 295 nm light, and emission spectra were recorded from 300 to 500 nm with 5-nm slit widths. To account for the decrease in excitation and emission intensities caused by the optical density of flavonoids in solution, observed fluorescence intensities of the sample were corrected for the inner filter effect (Lakowicz, 2006):
| (4) |
where Fci and Foi represent the corrected and observed fluorescence intensities, respectively, at wavelength i nm, and OD295 and ODi are the absorbance measured at wavelengths 295 and i nm, respectively. The final fluorescence intensity in the presence of flavonoids was calculated by subtracting the inner filter effect corrected intensity of flavonoids alone from the inner filter effect corrected sample intensity as described previously (Brelidze et al., 2010). Each experiment was repeated at least three times, and the data are plotted as mean ± SEM. Data analysis and plot fitting were performed in Origin (Microcal Software, Inc.).
Fluorescence anisotropy measurements were performed in a cuvette using a spectrophotometer (Fluorolog 3; HORIBA, Jobin Yvon) outfitted with Glan–Thompson polarizers. The fluorescence anisotropy was recorded from 5 µM fisetin in solution with increasing concentrations of wild-type or Y699A mutant CNBHD from mEAG1. Anisotropy measurements were made with 420-nm excitation and 490-nm emission light, and 13-nm slit widths as described previously (Rossi and Taylor, 2011; Bankston et al., 2012). For concentrations up to 121 µM, each experiment was repeated at least three times and the data were plotted as mean ± SEM.
To estimate the apparent binding affinity for each assay, plots of the change of the peak fluorescence intensities or anisotropy versus the total flavonoid concentration were fit with the following function (Cukkemane et al., 2007; Brelidze et al., 2009):
| (5) |
where RL is the concentration of the free receptor–ligand complex, Rt and Lt are total receptor and ligand concentrations, respectively, and Kd is the apparent binding affinity. For the flavonoid to tryptophan FRET:
| (6) |
where ΔF is the peak fluorescence change, and x is a scaling factor. For anisotropy experiments:
| (7) |
where A is anisotropy, A0 is the anisotropy of unbound flavonoid, and A∞ is the anisotropy of the flavonoid at saturating concentrations of receptor.
RESULTS
Screen of flavonoids and structurally related compounds
We have shown previously that the flavonoid luteolin potentiates mEAG1 channels (Brelidze et al., 2010). To investigate the structural requirements for flavonoid regulation, we screened several other flavonoids and structurally related compounds for regulation of mEAG1 channels, including 10 flavonoids, 17-β-estradiol, cAMP, and cGMP (Fig. 2). Similar to luteolin, here we found that fisetin facilitated opening of the mEAG1 channel. Fig. 3 A shows representative current traces from mEAG1 channels expressed in Xenopus oocytes and recorded in the inside-out configuration of the patch-clamp technique. Currents were elicited by voltage steps to potentials ranging from −140 to +50 mV in 10-mV increments. Recordings were made before, during, and after washout of 30 µM fisetin. The conductance–voltage relationships were measured from tail currents recorded at −120 mV and fit with Boltzmann functions (Fig. 3 B). 30 µM fisetin facilitated mEAG1 channel opening, shifting the V1/2 of the conductance–voltage relationship from −41.9 ± 4.1 to −55.4 ± 3.7 mV (n = 6; P = 0.028; t test) (Fig. 3 B). The kinetics of deactivation were quantified with single-exponential fits to the currents at −120 mV after a step to +50 mV (Fig. 3 C). 30 µM fisetin slowed the time constant of deactivation from 4.5 ± 0.8 ms to 7.2 ± 1.0 ms (n = 6; P = 0.03; t test). The fisetin-mediated potentiation was reversible, and the currents recovered after washout (Fig. 3 A). These results indicate that fisetin potently and reversibly potentiated mEAG1 channel gating.
Figure 2.

Chemical structures of screened flavonoids and structurally related compounds. The following flavonoids were included in this screen: fisetin (2-(3,4-dihydroxyphenyl)-3,7-dihydroxychromen-4-one), kaempferol (3,5,7-trihydroxy-2-(4-hydroxyphenyl)-4H-chromen-4-one), luteolin (2-(3,4-dihydroxyphenyl)- 5,7-dihydroxy-4-chromenone), quercetin (2-(3,4-dihydroxyphenyl)-3,5,7-trihydroxy-4H-chromen-4-one), acacetin (5,7-dihydroxy-2-(4-methoxyphenyl)chromen-4-one), apigenin (5,7-dihydroxy-2-(4-hydroxyphenyl)-4H-1-benzopyran-4-one), catechin ((2R,3S)-2-(3,4-dihydroxyphenyl)-3,4-dihydro-2H-chromene-3,5,7-triol), myricetin (3,5,7-trihydroxy-2-(3,4,5-trihydroxyphenyl)-4-chromenone), galangin (3,5,7-trihydroxy-2-phenylchromen-4-one), and narnigenin (5,7-dihydroxy-2-(4-hydroxyphenyl)chroman-4-one). The steroid hormone 17-β-estradiol ((17β)-estra-1,3,5(10)-triene-3,17-diol) and the cyclic nucleotides cAMP (3′5′-cyclic adenosine monophosphate) and cGMP (3′5′-cyclic guanosine monophosphate) were also included in this screen. Box highlights the compounds that potentiated mEAG1 currents.
Figure 3.

Fisetin modulated mEAG1 currents. (A) Representative current traces of mEAG1 channels recoded in the inside-out patch configuration in the absence (black), presence (red), and after washout (gray) of 30 µM fisetin. (B) The averaged conductance–voltage relationship of mEAG1 channels with 0 (black) or 30 µM fisetin (red) fit with a Boltzmann function (n = 6). (C) The tail current recorded at −120 mV after a voltage step to 50 mV in the absence (black) and presence (red) of 30 µM fisetin. Fits of these tail currents with single exponentials reported the time constant of deactivation: 5.3 ms before and 13.9 ms with 30 µM fisetin. (D) Plot of the ΔV1/2 versus free fisetin concentration fit with a Hill equation (n = 5). The half-maximal concentration of fisetin was 3.5 ± 0.4 µM. (E) Plot of the time constant of mEAG1 deactivation versus free fisetin concentration, fit with a Hill equation (n = 5). The half-maximal concentration of fisetin was 6.6 ± 3.7 µM.
The effects of various concentrations of fisetin on mEAG1 channel gating were measured to determine the apparent affinity for fisetin. The shifts in the V1/2 occurred with an apparent affinity of 3.5 ± 0.4 µM, and the slowing of deactivation occurred with an apparent affinity of 6.6 ± 3.7 µM. The Hill coefficient for the ΔV1/2 versus fisetin plot was 2.2, and for the deactivation time constant versus fisetin plot it was 1.2. These results indicate that fisetin potentiated mEAG1 channels in a concentration-dependent manner. At concentrations of 100 µM and higher, we found that fisetin inhibited mEAG1 currents. Because fisetin was not soluble in our recording solutions at concentrations higher than 150 µM, we did not further characterize this inhibition.
In addition to luteolin and fisetin, we identified two other flavonoids that potentiated mEAG1 channels: quercetin and kaempferol (Fig. 2). The effects of these and several other compounds on the conductance–voltage relationship and the rate of deactivation are listed in Table 1. Two-tailed t tests were used to determine which of the observed flavonoid effects were statistically significant, and the p-values for each of these tests are listed in Table 1. At concentrations of 10 µM, each of these four flavonoids induced shifts in the voltage dependence of activation of approximately −10 mV and slowed the rate of deactivation by ∼1.5–2-fold (Table 1). We also determined the concentration response for three of these potentiating flavonoids (fisetin, luteolin, and quercetin) and found that each potentiated with a half-maximal concentration of 2–8 µM (Table 1). There was no significant difference between the half-maximal concentrations identified for the shift in the conductance–voltage relationship of activation and the slowing of deactivation.
Table 1.
Screen of flavonoids on mEAG1 channel gating
| Compound | Applied concentration | ΔV1/2 | P-value | EC50 | Deactivation time constant | P-value | EC50 | n |
| mV | µM | ms | µM | |||||
| Acacetin | 50 µM | 0.4 ± 2.0 | 1 | 5.97 ± 1.50 | 0.73 | 7 | ||
| Apigenin | 10 µM | −5.3 ± 1.9 | 0.63 | 5.35 ± 0.85 | 0.66 | 4 | ||
| Catechin | 50 µM | 1.6 ± 1.9 | 0.81 | 4.58 ± 0.45 | 0.87 | 5 | ||
| Fisetin | 10 µM | −9.6 ± 1.9 | 0.03a | 3.5 ± 0.4 | 6.49 ± 0.96 | 0.04a | 6.6 ± 3.7 | 8 |
| Galangin | 10 µM | −3.3 ± 1.9 | 0.53 | 5.50 ± 0.49 | 0.21 | 5 | ||
| Kaempferol | 10 µM | −10.8 ± 0.02 | 0.02a | 9.67 ± 0.79 | 0.01a | 7 | ||
| Luteolin | 10 µM | −11.0 ± 2.5 | 0.05a | 4.7 ± 2.4 | 7.63 ± 2.44 | 0.22 | 8.7 ± 0.8 | 5 |
| Myricetin | 10 µM | −8.0 ± 5.7 | 0.60 | 5.85 ± 1.65 | 0.28 | 4 | ||
| Narnegin | 50 µM | −5.0 ± 1.9 | 0.65 | 5.38 ± 0.59 | 0.23 | 5 | ||
| Quercetin | 10 µM | −10.1 ± 3.5 | 0.05a | 2.4 ± 1.0 | 8.80 ± 1.25 | 0.01a | 6.6 ± 3.8 | 7 |
| Estradiol | 50 µM | 0.1 ± 1.0 | 0.99 | 6.73 ± 1.99 | 0.87 | 4 | ||
| cAMP | 10 mM | 0.3 ± 0.8 | 0.91 | 4.56 ± 0.32 | 0.82 | 5 | ||
| cGMP | 10 mM | −0.7 ± 1.0 | 0.93 | 4.00 ± 0.40 | 0.60 | 5 |
The responses of mEAG1 channel gating to screened flavonoids are shown. The screened compounds were applied to patches recorded in the inside-out configuration of the patch-clamp technique. Each compound was applied to at least four patches expressing mEAG1 channels, and data shown are mean ± SEM. To screen for changes in the steady-state properties, we quantified the flavonoid-induced shifts in the V1/2 of the conductance–voltage relation. P-values report the significance and were obtained from two-tailed t tests comparing the V1/2 in the presence and absence of the applied compound. The average rate of deactivation in the absence of flavonoids (not included in the table) was 4.1 ± 0.2 ms (n = 30). P-values represent significance of two-tailed t tests used to compare the rate of deactivation in the presence and absence of flavonoids. Concentration–response experiments were performed for three of the potentiating flavonoids: fisetin, luteolin, and quercetin. Hill equations were used to quantify the half-maximal concentrations for both the shift in the V1/2 of the conductance relationship and for the rate of channel deactivation. n reports the number of observations made for each flavonoid on the shifts of the V1/2 of the conductance–voltage relation and the slowing of deactivation.
Significant differences (P < 0.05).
Other flavonoids potentiated mEAG1 channels to a lesser extent. For example, we found that at 10 µM, the flavonoids myricetin, galangin, and apigenin induced a modest shift in the voltage dependence of approximately −5 mV and a nominal slowing of deactivation; both effects lacked statistical significance (Table 1). Finally, three flavonoids, acacetin, catechin, and narnigen, did not alter the steady-state or kinetic properties of mEAG1 channel gating at all, even at a higher concentration of 50 µM (Table 1). These results suggest that the four potentiating flavonoids regulate channel gating with specificity and are likely binding to a particular site of the channel.
In other proteins, flavonoids directly interact with estrogen-binding motifs. In hopes of finding an endogenous regulator for mEAG1 channels, we included 17-β-estradiol in our screen. We did not, however, detect mEAG1 channel potentiation by 17-β-estradiol. 50 µM 17-β-estradiol did not shift the voltage dependence or slow the deactivation of mEAG1 channels (Table 1). As reported previously, unlike CNG and HCN channels, neither cAMP nor cGMP altered the steady-state properties of mEAG1 channels (Brelidze et al., 2009). For example, 10 mM cAMP did not shift the V1/2 of the conductance–voltage relationship, which was −37.4 ± 4.7 mV without and −37.7 ± 4.4 mV with cAMP (n = 6; P = 0.91; t test). Similarly, neither cyclic nucleotide altered the kinetic properties of the channel. At −120 mV, the rate of deactivation after a step to +50 mV was 4.4 ± 0.4 ms without and 4.6 ± 0.3 ms with 10 mM cAMP (n = 6; P = 0.82; t test).
Fisetin potentiated mEAG1 channels when applied to the intracellular or extracellular surface of the channel
To hone in on the flavonoid-binding site, we determined whether flavonoids would potentiate mEAG1 channels when applied to the extracellular surface of the channel as they do when applied intracellularly. To do so, we compared the response of mEAG1 channels to fisetin applied to patches recorded in the inside-out and outside-out configurations of the patch-clamp technique. Fisetin similarly potentiated mEAG1 channels when applied to the intracellular or extracellular surfaces (Fig. 4). 10 µM fisetin shifted the conductance–voltage relationship of inside-out patches by −9.6 ± 1.9 mV (n = 7) and of outside-out patches by −8.1 ± 2.3 mV (n = 4; P = 0.50; t test). These data are consistent with the membrane permeability of flavonoids and do not distinguish whether they act at the intracellular or extracellular surface of the channel.
Figure 4.
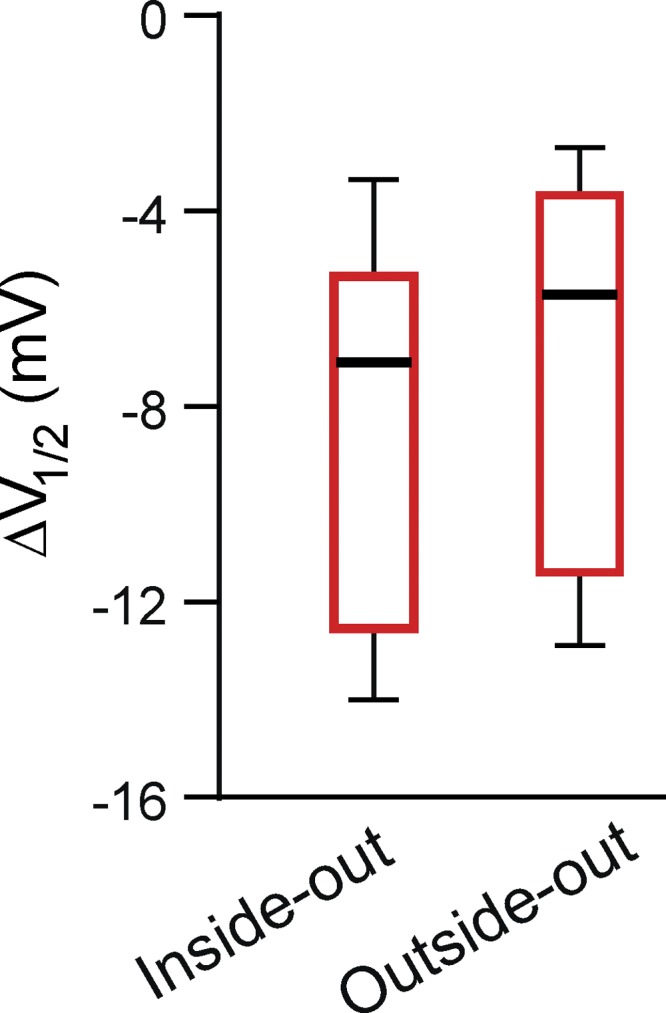
Fisetin potentiated mEAG1 currents recorded in both inside-out and outside-out patches. Box plots depicting the distributions of the shifts of the V1/2 of the conductance–voltage relationships in the presence of 10 µM fisetin applied to mEAG1 channels and recorded in the inside-out or outside-out configuration of the patch-clamp technique (n = 4–7).
Fisetin potentiation was independent of the amino-terminal or post-CNBHD regions
Because the intracellular side of KCNH channels includes two known ligand-binding motifs (Brelidze et al., 2010), the Per-Arnt-Sim (PAS) domain and the CNBHD, we hypothesized that the flavonoids act on an intracellular domain. We generated mEAG1 channels lacking their entire amino-terminal region, including the PAS domain (mEAG1 Δ2–173), and asked whether flavonoids still potentiated these mutant channels (Fig. 5). As reported previously (Terlau et al., 1997), deletions in the amino-terminal region of EAG1 uncovered a voltage-dependent inactivation not seen in the full-length channel, and slowed deactivation (Fig. 5 A). With 30 µM fisetin, the peak conductance after a step to −40 mV—a potential with no apparent inactivation—increased by an average of 1.7-fold (Fig. 5 B), indicating that fisetin potentiated mEAG1 Δ2–173 channels (Fig. 5 B). Fitting plots of the conductance–voltage relationship for mEAG1 Δ2–173 with a product of two Boltzmann functions revealed that fisetin shifted the V1/2 of activation from −19.8 to −39.4 mV. In addition, fisetin altered the kinetic properties of mEAG1 Δ2–173 (Fig. 5 C). After a step to −40 mV, 30 µM fisetin slowed the time constant of mEAG1 Δ2–173 deactivation from 117 ± 1 ms to 375 ± 36 ms (n = 3; P < 0.05; t test). Fisetin also potentiated mEAG1 channels lacking the distal carboxy-terminal region after the CNBHD (mEAG1 Δ821–989). 30 µM fisetin shifted the V1/2 of the conductance–voltage relationship of mEAG1 Δ821–989 channels from −36.4 ± 2.5 mV to −51.1 ± 6.0 mV (n = 4; P < 0.05; t test) (Fig. 5 E). Additionally, 30 µM fisetin slowed the rate of mEAG1 Δ821–989 deactivation at −120 mV from 3.4 ± 0.7 ms to 6.7 ± 2.2 ms (n = 4) (Fig. 5 F). Fisetin potentiation of both mEAG1 Δ2–173 and mEAG1 Δ821–989 mutant channels indicated that neither the amino-terminal nor post-CNBHD regions were the site of flavonoid action.
Figure 5.

Fisetin regulated mEAG1 channels lacking their amino-terminal or post-CNBHD regions. (A) Representative current traces from mEAG1 Δ2–173 channels, recorded in the inside-out configuration of the patch-clamp technique, in the absence (black) and presence (red) of 30 µM fisetin. Patches were held at −100 mV, and currents were evoked by 3-s voltage steps to depolarizing potentials ranging from −100 to +100 mV, in 20-mV increments, and returned to −100 mV for 1 s. (B) Representative conductance–voltage relationships of mEAG1 Δ2–173 channels with 0 (black) or 30 µM fisetin (red) fit with the product of two Boltzmann functions. For both curves, the V1/2i, si, and sa were held constant at −4.5, 5.9, and 7 mV, respectively. For 0 fisetin, the V1/2a was equal to −19.8 mV, and for 30 µM fisetin, the V1/2a was −39.4 mV. (C) Tail currents at −100 mV after a step to −40 mV were fit with single exponentials (green lines) to give time constants of 116 ms without and 239 ms with 30 µM fisetin. (D) Representative current traces of mEAG1 Δ821–989 recorded in the absence (black) and presence (red) of 30 µM fisetin. Patches were held at −100 mV, and currents were evoked by a series of 100-ms voltage steps ranging from −140 to +50 mV, in 10-mV increments, followed by a 100-ms voltage pulse to −120 mV. (E) The averaged conductance–voltage relationship of mEAG1 channels lacking their post-CNBHD region, EAG1 Δ821–989, recorded in the inside-out patch configuration in the absence (black) and presence (red) of 30 µM fisetin (n = 4). The data were fit with Boltzmann functions to give a V1/2 of −31.9 mV without and −50.6 mV with 30 µM fisetin. (F) Tail currents at −120 mV after a step to +50 mV fit with single exponentials (green lines) to give time constants of 5.2 ms without and 13.4 ms with 30 µM fisetin.
Fisetin and quercetin bound to the purified EAG1 CNBHD
We next asked whether the CNBHD might be the site of flavonoid potentiation in mEAG1 channels. First, a binding assay based on FRET was used to directly measure fisetin and quercetin binding to the purified C-linker/CNBHD of mEAG1 channels. FRET reports the proximity of two chromophores and is a reliable indicator of molecular interactions (Lakowicz, 2006). As pigmented compounds, flavonoids can act as acceptor chromophores for FRET. Although fisetin is a fluorescent molecule, quercetin is not. Notably, however, the absorbance spectra of both fisetin and quercetin overlapped nicely with the emission spectrum of the fluorescent amino acid tryptophan (Fig. 6). The emission spectrum of free tryptophan peaks at 353 nm, and the absorbance spectra of fisetin and quercetin peaks at 357 and 361 nm, respectively. Fisetin and quercetin are therefore suitable FRET acceptors and should quench the fluorescence of nearby tryptophans by a FRET mechanism. The C-linker/CNBHD of mEAG1 channels has two endogenous tryptophans, one in the C-linker and another in the β roll of the CNBHD, in a position analogous to the binding pocket for cyclic nucleotides in HCN channels (Brelidze et al., 2009; Marques-Carvalho et al., 2012). Thus, FRET between tryptophan and quercetin or fisetin could report binding between the flavonoid and the purified C-linker/CNBHD of mEAG1 channels.
Figure 6.

Absorption spectra for fisetin and quercetin overlap with the emission spectrum of tryptophan. Shown are the absorption spectra of 10 µM fisetin (blue) and quercetin (black) (left axis). Also shown is the emission spectrum of 4 µM of free tryptophan (red) excited with 295 nm (right axis).
Both quercetin and fisetin exhibited FRET with the purified C-linker/CNBHD (Fig. 7, A and C). The peak fluorescence intensity of the C-linker/CNBHD at 341 nm decreased by 27% with 100 µM fisetin and by 51% with 100 µM quercetin (Fig. 7, A and C, black and red traces). FRET could also be seen by increased fluorescence of the acceptor fisetin at 500 nm upon excitation of the donor tryptophan in the C-linker/CNBHD (Fig. 7 A). Neither flavonoid changed the fluorescence of 4 µM of free tryptophan, indicating that the FRET between the C-linker/CNBHD was the result of flavonoid binding to the purified protein (Fig. 7, B and D). To determine the flavonoid binding affinity for the purified C-linker/CNBHD, the change in fluorescence intensity versus the total quercetin concentration was plotted. Fitting these data with a simple binding relation (Eq. 6) indicated a Kd of at least 93 ± 69 µM (Fig. 7 E). Quercetin had limited solubility in aqueous solutions at concentrations higher than 150 µM, precluding us from obtaining a full dose–response plot. These FRET experiments indicate that fisetin and quercetin bound to the purified C-linker/CNBHD of mEAG1 channels.
Figure 7.

Quercetin and fisetin bound to purified CNBHD of mEAG1 channels. (A and B) The inner filter–corrected and background-subtracted emission spectra of 4 µM of purified C-linker/CNBHD (A) and 4 µM of free tryptophan (B) recorded with 0 or 100 µM fisetin as indicated. (C and D) The inner filter–corrected and background-subtracted tryptophan fluorescence emission spectra of 4 µM of purified C-linker/CNBHD (C) or 4 µM of free tryptophan (D) recorded with various concentrations of quercetin, as indicated. (E) Plot of the change in the peak emission fluorescence intensity (at 341 nm) of the C-linker/CNBHD versus total quercetin concentration. These data were fit with Eq. 6 to report an apparent binding affinity of 93 ± 69 µM. (F) Fluorescence anisotropy of fisetin plotted versus the total concentration of wild-type or Y699A mutant CNBHD. The data were fit with Eq. 7 to yield Kd’s of 111 µM for wild-type and 30 µM for the Y699A mutant.
As an additional assay of flavonoid binding to the CNBHD, we measured the anisotropy of the fluorescent flavonoid fisetin with varying concentrations of purified CNBHD. Anisotropy reports the tumbling of a fluorescent molecule in solution. When a small fluorophore, such as fisetin, binds to a larger protein, the fluorophore will have a slower rate of tumbling and increased anisotropy. Purified mEAG1 CNBHD increased the anisotropy of fisetin as expected for fisetin binding to the CNBHD. Fisetin anisotropy increased with increasing concentrations of mEAG1 CNBHD. The change in the steady-state anisotropy was plotted versus the total concentration of CNBHD, and the data were fit with the binding relation in Eq. 7 (Fig. 7 F, wild-type). This analysis revealed that fisetin bound to the purified CNBHD with an apparent affinity of at least 111 µM. Some possible differences in the binding affinity for the flavonoid to the purified CNBHD compared with the intact channel are examined in the discussion. Along with the tryptophan-to-flavonoid FRET, these data report that flavonoids bind to the purified CNBHD.
We next asked where the fisetin is binding in the CNBHD. The CNBHD of KCNH channels contains a conserved stretch of six residues, referred to as the “intrinsic ligand,” that occupy the would-be cyclic nucleotide–binding pocket. It has been shown previously that mutating the tyrosine of the intrinsic ligand of EAG1 to an alanine displaces the intrinsic ligand from its binding site on the CNBHD (Marques-Carvalho et al., 2012). We found that the purified CNBHD containing the Y699A mutation still bound fisetin (Fig. 7 F). Indeed, the mutant CNBHD bound fisetin with an apparent affinity of at least 30 µM, which appears to be almost four times the affinity of wild-type CNBHD. These data suggest that fisetin might compete with the intrinsic ligand for binding to the CNBHD.
Fisetin did not potentiate mEAG1 channels with a mutated intrinsic ligand
Results from the in vitro binding assays were consistent with the hypothesis that flavonoids regulate mEAG1 channels by binding to their CNBHD and displacing their intrinsic ligand. We directly tested this hypothesis by determining whether the flavonoid regulated EAG1 channels with an already displaced intrinsic ligand (Marques-Carvalho et al., 2012). Similar to hEAG1 channels, the Y699A mutation in mEAG1 channels also shifted the voltage dependence of activation relative to wild-type mEAG1 (Fig. 8 B). The average V1/2 of the conductance–voltage relationship for mEAG1 Y699A channels was −54.9 ± 3.5 mV (n = 10), compared with −41.6 ± 4.1 mV for wild-type channels (n = 6) (Fig. 8 D). This shift was similar to the shift seen with flavonoids and suggests that flavonoids might act by displacing the intrinsic ligand.
Figure 8.

Fisetin did not potentiate mEAG1 channels with a mutated intrinsic ligand. (A) Alignment of the intrinsic ligand from each of the eight members of the KCNH channel family. Line on the top marks the boundaries of the intrinsic ligand, and the arrow on the bottom denotes the Y699 residue in mEAG1 channels. (B) The conductance–voltage relationship of wild-type (black) and Y699A (green) mEAG1 channels recoded in the inside-out patch configuration (n = 17). (C) Representative current traces from Y699A mutant channels recorded in the absence (black) and presence (red) of 30 µM fisetin. (D) Box plot distribution of the V1/2 of the conductance–voltage relationship for both wild-type and mEAG1 Y699A channels with 0 or 30 µM fisetin as indicated (n = 6–10). A two-way ANOVA reported differences between these four groups of data (P < 0.01). The Tukey–Kramer post-hoc test revealed significant differences between treatments, denoted with an asterisk. Treatments with nonsignificant differences are also indicated (n.s.). (E) Box plot distribution of the time constant of deactivation for both wild-type and mEAG1 Y699A channels with 0 or 30 µM fisetin as indicated (n = 6–10). A two-way ANOVA reported differences between these four groups of data (P < 0.05). The Tukey–Kramer post-hoc test also revealed significant and nonsignificant differences between treatments, indicated with an asterisk or n.s., respectively.
Remarkably, fisetin did not potentiate mEAG1 Y699A channels (Fig. 8, C–E). The application of 30 µM fisetin did not significantly shift the voltage dependence of activation in mEAG1 Y699A channels; the V1/2 of the conductance–voltage relationship was −54.9 ± 3.5 mV without and −57.2 ± 3.6 mV with 30 µM fisetin (n = 10; P = 0.65; t test) (Fig. 8 D). At −120 mV, 30 µM fisetin slowed the time constant of deactivation somewhat, from 5.0 ± 0.4 ms to 6.4 ± 0.6 ms (n = 10; P = 0.06; t test). For comparison, 30 µM fisetin slowed the deactivation of wild-type channels from 4.5 ± 0.8 ms to 7.2 ± 1.0 ms (P = 0.03; t test) (Fig. 8 E). These results suggest that fisetin potentiated mEAG1 channel gating by binding to the CNBHD and possibly by displacing their intrinsic ligand.
DISCUSSION
We had previously identified luteolin as a potent regulator of mEAG1 channels using a chemical library screen of biological metabolites (Brelidze et al., 2010). Using luteolin as a lead compound, here we screened additional flavonoids and structurally related compounds to determine whether mEAG1 channels are regulated by flavonoids more generally. As a result of this screen, we uncovered three new flavonoids that are potent and reversible regulators of channel activity: fisetin, quercetin, and kaempferol. Along with luteolin, these flavonoids had large effects on channel gating, shifting the voltage dependence of activation toward more hyperpolarizing potentials and slowing channel deactivation. The flavonoids fisetin, quercetin, and luteolin all had similar concentration–response relationships on mEAG1 currents, with affinities in the low micromolar range. We also identified several flavonoids, including myricetin, as modest regulators of mEAG1 gating. Notably, myricetin was pulled out of our original screen of biological metabolites as a regulator of mEAG1 gating, albeit to a lesser extent than luteolin (Brelidze et al., 2010). Intriguingly, several other flavonoids used in this screen exerted little effect on channel activity, even at high concentrations. When compared, the structures of all potentiating flavonoids had a hydroxyl group at the 4′ position of their ring B (Figs. 2 and 9). However, not all flavonoids with this hydroxyl group potentiated channel gating, suggesting that the 4′ hydroxyl group may be necessary but not sufficient for EAG1 potentiation. In fact, the structures of potentiating versus nonpotentiating flavonoids did not have obvious differences that explained their disparate effects on channel activity. For example, apigenin shares several structural features with kaempferol and luteolin, yet apigenin did not significantly regulate mEAG1 channel gating. Consequently, the chemical properties that endow flavonoids with the ability to potentiate mEAG1 channels have yet to be determined.
Figure 9.

Flavone and tyrosine structures. (A) Chemical structure of the flavone subclass of flavonoids and (B) structure of the amino acid tyrosine.
Flavonoids are known to bind purified estrogen receptors and stimulate estrogen receptor–dependent transcription in vivo (Miksicek, 1993). We considered the possibility that flavonoid regulation of mEAG1 channels occurs through a previously unrecognized estrogen-binding motif and therefore tested the effect of the mammalian estrogen 17-β-estradiol on mEAG1 gating. However, estrogen had no effect on mEAG1 channel gating, even at micromolar concentrations. We also report that neither cAMP nor cGMP altered mEAG1 currents, even at the high concentration of 10 mM. Therefore, an endogenous ligand for EAG1 channels has yet to be identified, assuming it exists.
Two different binding assays reported that flavonoids bound to the purified CNBHD from mEAG1 channels. However, we noticed a significant disparity in the affinities measured by these assays compared with electrophysiology. The apparent affinity of the flavonoid for the purified CNBHD (>100 µM) was much lower than the apparent affinity of the intact channel observed by electrophysiology (2–8 µM). This observed discrepancy in affinity could indicate differences in the binding site(s) between intact mEAG1 channels and the isolated CNBHD. Alternatively, apparent affinity determined with electrophysiology may reflect cooperative ligand binding to the intact tetrameric channel, whereas the apparent affinity determined with fluorescence reflects binding of the flavonoid to a monomeric isolated channel domain. Nonetheless, these data implicate the CNBHD as the likely flavonoid-binding site for regulation of mEAG1 channels.
To resolve whether flavonoid binding to the CNBHD was sufficient for channel potentiation, we determined whether other intracellular regions of the channel were required for flavonoid potentiation. The amino-terminal region of KCNH channels contains a PAS domain, which in other proteins are important signaling modules that bind small molecules and function as protein–protein interaction sites (Taylor and Zhulin, 1999). However, fisetin still potentiated mEAG1 channels lacking their entire amino-terminal region, including their PAS domain. Additionally, fisetin potentiated mEAG1 Δ821–989 channels, indicating that the post-CNBHD region is not required for flavonoid regulation of mEAG1 gating. These data demonstrate that the amino- and post-CNBHD regions are not required for flavonoid-mediated effects on mEAG1 channels and support the hypothesis that the CNBHD is sufficient for channel potentiation.
Here, we show that displacement of the mEAG1 intrinsic ligand by the Y699A mutation yielded similar effects on the conductance–voltage relationship, as flavonoid application and fisetin had no effect on the conductance–voltage relationship of mEAG1 Y699A channels, even at high concentrations. However, the Y699A mutation did not slow deactivation to the same extent as fisetin on the wild-type channels, and fisetin evoked an observable but statistically insignificant slowing of channel deactivation. It is possible that the Y699A mutation did not fully displace the intrinsic ligand of the mEAG1 channel, thereby allowing for a much attenuated flavonoid regulation. Regardless, these results are consistent with the hypothesis that flavonoids potentiate mEAG1 channels by displacing their intrinsic ligand. Additionally, we found that fisetin bound to the purified CNBHD with the Y699A mutation and did so with a higher apparent affinity (30 µM compared with 111 µM for wild-type). Evidently, fisetin can still bind to the mutated domain even though fisetin does not potentiate these mutant channels. The increased binding affinity of the Y699A CNBHD for fisetin suggests that the flavonoid competes with the intrinsic ligand for binding to the CNBHD. These results are consistent with the hypothesis that flavonoids potentiate EAG1 channels by displacing their intrinsic ligand.
Interestingly, the hydroxyl group at the 4′ position of the B ring of all potentiating flavonoids has a similar structure to the R group of tyrosine (Fig. 9). It is therefore attractive to speculate that the B ring of the potentiating flavonoids may displace the intrinsic ligand by binding to the same residues in the CNBHD that coordinate the tyrosine of the intrinsic ligand. Along these same lines, an endogenous ligand might similarly displace the intrinsic ligand to alter channel gating in vivo. For example, a tyrosine from an accessory protein might bind to the CNBHD to displace the intrinsic ligand and potentiate EAG1 in a neuron. Another way to displace this tyrosine could be by its phosphorylation, which should similarly have large effects on the gating of the channel. Additional experiments will need to be done to determine whether there is an endogenous process that regulates EAG1 by displacing the intrinsic ligand.
The results presented here extend our understanding of the flavonoid regulation of EAG1 channels and may shed light on the physiological targets of flavonoids. Indeed, increased flavonoid consumption has been correlated with several measures of health, including reduced risk of cancer (Cui et al., 2008), reduced mortality from coronary heart disease (Hertog et al., 1993), improved learning and memory (Galli et al., 2002; Haque et al., 2006), and protection against Alzheimer’s and Parkinson’s diseases (Inanami et al., 1998; Spencer, 2008). Although the molecular mechanisms that account for many of these physiological effects have yet to be determined, EAG1 channels should be included in the growing list of potential targets of flavonoids.
Acknowledgments
We thank Y. Haitin for providing us with the wild-type CNBHD of mEAG1 to use for the anisotropy experiments, to B.M. Drum for assistance with the electrophysiology, and to J.R. Bankston and M.C. Puljung for critical review of the manuscript. We are grateful to members of the Zagotta laboratory for helpful discussions, and we thank S.S. Camp and S.L. Cunnington for excellent technical assistance.
This work was supported by grants from the National Institutes of Health (2R01EY010329 to W.N. Zagotta and F32 HL095241 to A.E. Carlson).
Kenton J. Swartz served as editor.
Footnotes
Abbreviations used in this paper:
- CNBHD
- cyclic nucleotide–binding homology domain
- EAG1
- ether á go-go 1
- FRET
- fluorescence resonance energy transfer
- HCN
- hyperpolarization-activated, cyclic nucleotide–modulated
- PAS
- Per-Arnt-Sim
References
- Bankston J.R., Camp S.S., DiMaio F., Lewis A.S., Chetkovich D.M., Zagotta W.N. 2012. Structure and stoichiometry of an accessory subunit TRIP8b interaction with hyperpolarization-activated cyclic nucleotide-gated channels. Proc. Natl. Acad. Sci. USA. 109:7899–7904 10.1073/pnas.1201997109 [DOI] [PMC free article] [PubMed] [Google Scholar]
- Brelidze T.I., Carlson A.E., Zagotta W.N. 2009. Absence of direct cyclic nucleotide modulation of mEAG1 and hERG1 channels revealed with fluorescence and electrophysiological methods. J. Biol. Chem. 284:27989–27997 10.1074/jbc.M109.016337 [DOI] [PMC free article] [PubMed] [Google Scholar]
- Brelidze T.I., Carlson A.E., Davies D.R., Stewart L.J., Zagotta W.N. 2010. Identifying regulators for EAG1 channels with a novel electrophysiology and tryptophan fluorescence based screen. PLoS ONE. 5:e12523 10.1371/journal.pone.0012523 [DOI] [PMC free article] [PubMed] [Google Scholar]
- Brelidze T.I., Carlson A.E., Sankaran B., Zagotta W.N. 2012. Structure of the carboxy-terminal region of a KCNH channel. Nature. 481:530–533 10.1038/nature10735 [DOI] [PMC free article] [PubMed] [Google Scholar]
- Camacho J. 2006. Ether à go-go potassium channels and cancer. Cancer Lett. 233:1–9 10.1016/j.canlet.2005.02.016 [DOI] [PubMed] [Google Scholar]
- Craven K.B., Zagotta W.N. 2006. CNG and HCN channels: two peas, one pod. Annu. Rev. Physiol. 68:375–401 10.1146/annurev.physiol.68.040104.134728 [DOI] [PubMed] [Google Scholar]
- Cui Y., Morgenstern H., Greenland S., Tashkin D.P., Mao J.T., Cai L., Cozen W., Mack T.M., Lu Q.Y., Zhang Z.F. 2008. Dietary flavonoid intake and lung cancer—a population-based case-control study. Cancer. 112:2241–2248 10.1002/cncr.23398 [DOI] [PMC free article] [PubMed] [Google Scholar]
- Cukkemane A., Grüter B., Novak K., Gensch T., Bönigk W., Gerharz T., Kaupp U.B., Seifert R. 2007. Subunits act independently in a cyclic nucleotide-activated K(+) channel. EMBO Rep. 8:749–755 10.1038/sj.embor.7401025 [DOI] [PMC free article] [PubMed] [Google Scholar]
- Farias L.M., Ocaña D.B., Díaz L., Larrea F., Avila-Chávez E., Cadena A., Hinojosa L.M., Lara G., Villanueva L.A., Vargas C., et al. 2004. Ether a go-go potassium channels as human cervical cancer markers. Cancer Res. 64:6996–7001 10.1158/0008-5472.CAN-04-1204 [DOI] [PubMed] [Google Scholar]
- Galli R.L., Shukitt-Hale B., Youdim K.A., Joseph J.A. 2002. Fruit polyphenolics and brain aging: nutritional interventions targeting age-related neuronal and behavioral deficits. Ann. NY Acad. Sci. 959:128–132 10.1111/j.1749-6632.2002.tb02089.x [DOI] [PubMed] [Google Scholar]
- Gómez-Varela D., Kohl T., Schmidt M., Rubio M.E., Kawabe H., Nehring R.B., Schäfer S., Stühmer W., Pardo L.A. 2010. Characterization of Eag1 channel lateral mobility in rat hippocampal cultures by single-particle-tracking with quantum dots. PLoS ONE. 5:e8858 10.1371/journal.pone.0008858 [DOI] [PMC free article] [PubMed] [Google Scholar]
- Guy H.R., Durell S.R., Warmke J., Drysdale R., Ganetzky B. 1991. Similarities in amino acid sequences of Drosophila eag and cyclic nucleotide-gated channels. Science. 254:730 10.1126/science.1658932 [DOI] [PubMed] [Google Scholar]
- Hamill O.P., Marty A., Neher E., Sakmann B., Sigworth F.J. 1981. Improved patch-clamp techniques for high-resolution current recording from cells and cell-free membrane patches. Pflugers Arch. 391:85–100 10.1007/BF00656997 [DOI] [PubMed] [Google Scholar]
- Haque A.M., Hashimoto M., Katakura M., Tanabe Y., Hara Y., Shido O. 2006. Long-term administration of green tea catechins improves spatial cognition learning ability in rats. J. Nutr. 136:1043–1047 [DOI] [PubMed] [Google Scholar]
- Hertog M.G., Feskens E.J., Hollman P.C., Katan M.B., Kromhout D. 1993. Dietary antioxidant flavonoids and risk of coronary heart disease: the Zutphen Elderly Study. Lancet. 342:1007–1011 10.1016/0140-6736(93)92876-U [DOI] [PubMed] [Google Scholar]
- Huson D.H., Richter D.C., Rausch C., Dezulian T., Franz M., Rupp R. 2007. Dendroscope: An interactive viewer for large phylogenetic trees. BMC Bioinformatics. 8:460 10.1186/1471-2105-8-460 [DOI] [PMC free article] [PubMed] [Google Scholar]
- Inanami O., Watanabe Y., Syuto B., Nakano M., Tsuji M., Kuwabara M. 1998. Oral administration of (−)catechin protects against ischemia-reperfusion-induced neuronal death in the gerbil. Free Radic. Res. 29:359–365 10.1080/10715769800300401 [DOI] [PubMed] [Google Scholar]
- Jow G.M., Jeng C.J. 2008. Differential localization of rat Eag1 and Eag2 potassium channels in the retina. Neurosci. Lett. 431:12–16 10.1016/j.neulet.2007.11.017 [DOI] [PubMed] [Google Scholar]
- Lakowicz J.R. 2006. Principles of Fluorescence Spectroscopy. Third edition. Springer, New York: 980 pp [Google Scholar]
- Ludwig J., Terlau H., Wunder F., Brüggemann A., Pardo L.A., Marquardt A., Stühmer W., Pongs O. 1994. Functional expression of a rat homologue of the voltage gated either á go-go potassium channel reveals differences in selectivity and activation kinetics between the Drosophila channel and its mammalian counterpart. EMBO J. 13:4451–4458 [DOI] [PMC free article] [PubMed] [Google Scholar]
- Marques-Carvalho M.J., Sahoo N., Muskett F.W., Vieira-Pires R.S., Gabant G., Cadene M., Schönherr R., Morais-Cabral J.H. 2012. Structural, biochemical, and functional characterization of the cyclic nucleotide binding homology domain from the mouse EAG1 potassium channel. J. Mol. Biol. 423:34–46 10.1016/j.jmb.2012.06.025 [DOI] [PubMed] [Google Scholar]
- Meyer R., Schönherr R., Gavrilova-Ruch O., Wohlrab W., Heinemann S.H. 1999. Identification of ether à go-go and calcium-activated potassium channels in human melanoma cells. J. Membr. Biol. 171:107–115 10.1007/s002329900563 [DOI] [PubMed] [Google Scholar]
- Miksicek R.J. 1993. Commonly occurring plant flavonoids have estrogenic activity. Mol. Pharmacol. 44:37–43 [PubMed] [Google Scholar]
- Ousingsawat J., Spitzner M., Puntheeranurak S., Terracciano L., Tornillo L., Bubendorf L., Kunzelmann K., Schreiber R. 2007. Expression of voltage-gated potassium channels in human and mouse colonic carcinoma. Clin. Cancer Res. 13:824–831 10.1158/1078-0432.CCR-06-1940 [DOI] [PubMed] [Google Scholar]
- Papadopoulos J.S., Agarwala R. 2007. COBALT: Constrained-based alignment tool for multiple protein sequences. Bioinformatics. 23:1073–1079 [DOI] [PubMed] [Google Scholar]
- Pardo L.A., del Camino D., Sánchez A., Alves F., Brüggemann A., Beckh S., Stühmer W. 1999. Oncogenic potential of EAG K+ channels. EMBO J. 18:5540–5547 10.1093/emboj/18.20.5540 [DOI] [PMC free article] [PubMed] [Google Scholar]
- Pardo L.A., Contreras-Jurado C., Zientkowska M., Alves F., Stühmer W. 2005. Role of voltage-gated potassium channels in cancer. J. Membr. Biol. 205:115–124 10.1007/s00232-005-0776-1 [DOI] [PubMed] [Google Scholar]
- Rossi A.M., Taylor C.W. 2011. Analysis of protein-ligand interactions by fluorescence polarization. Nat. Protoc. 6:365–387 10.1038/nprot.2011.305 [DOI] [PMC free article] [PubMed] [Google Scholar]
- Spencer J.P. 2008. Flavonoids: modulators of brain function? Br. J. Nutr. 99 E:ES60–ES77 [DOI] [PubMed] [Google Scholar]
- Taylor B.L., Zhulin I.B. 1999. PAS domains: internal sensors of oxygen, redox potential, and light. Microbiol. Mol. Biol. Rev. 63:479–506 [DOI] [PMC free article] [PubMed] [Google Scholar]
- Terlau H., Heinemann S.H., Stühmer W., Pongs O., Ludwig J. 1997. Amino terminal-dependent gating of the potassium channel rat eag is compensated by a mutation in the S4 segment. J. Physiol. 502:537–543 10.1111/j.1469-7793.1997.537bj.x [DOI] [PMC free article] [PubMed] [Google Scholar]
- Warmke J.W., Ganetzky B. 1994. A family of potassium channel genes related to eag in Drosophila and mammals. Proc. Natl. Acad. Sci. USA. 91:3438–3442 10.1073/pnas.91.8.3438 [DOI] [PMC free article] [PubMed] [Google Scholar]
- Zagotta W.N., Hoshi T., Aldrich R.W. 1989. Gating of single Shaker potassium channels in Drosophila muscle and in Xenopus oocytes injected with Shaker mRNA. Proc. Natl. Acad. Sci. USA. 86:7243–7247 10.1073/pnas.86.18.7243 [DOI] [PMC free article] [PubMed] [Google Scholar]
- Zagotta W.N., Olivier N.B., Black K.D., Young E.C., Olson R., Gouaux E. 2003. Structural basis for modulation and agonist specificity of HCN pacemaker channels. Nature. 425:200–205 10.1038/nature01922 [DOI] [PubMed] [Google Scholar]