

Abstract
Neural sexual differentiation begins during embryogenesis and continues after birth for a variable amount of time depending on the species and brain region. Because gonadal hormones were the first factors identified in neural sexual differentiation, their role in this process has eclipsed investigation of other factors. Here, we use a mouse with a spontaneous translocation that produces four different unique sets of sex chromosomes. Each genotype has one normal X-chromosome, and a unique second sex chromosome, creating the following genotypes: XY*x, XX, XY*, XXY*. This Y* mouse line is used by several laboratories to study two human aneuploid conditions: Turner and Klinefelter syndromes. Since sex chromosome number affects behavior and brain morphology, we surveyed brain gene expression at embryonic days 11.5 and 18.5 to isolate X-chromosome dose effects in the developing brain as possible mechanistic changes underlying the phenotypes. We compared gene expression differences between gonadal males and females as well as individuals with one versus two X-chromosomes. We present data showing, in addition to genes reported to escape X-inactivation, a number of autosomal genes are differentially expressed between the sexes and in mice with different numbers of X-chromosomes. Based on our results, we can now identify the genes present in the region around the chromosomal break point that produces the Y* model. Our results also indicate an interaction between gonadal development and sex chromosome number that could further elucidate the role of sex chromosome genes and hormones in the sexual differentiation of behavior.
Keywords: sex chromosome, sex differences, X-inactivation, X-chromosome, Y-chromosome, Klinefelter syndrome, Turner syndrome, aneuploidy
Introduction
Sex differences in the brain and behavior are widespread in animals. Neural development occurs before and just after birth, and during this period sex differences are organized. The powerful role of androgens on sexually dimorphic behaviors was described over 50 years ago (Phoenix et al. 1959). Since then, much attention has focused on hormonal modulation of brain sexual dimorphisms. Yet, in addition to sex differences in hormone secretions, males and females have differences in gene expression arising from genomic imprinting and sex chromosomes (Arnold 2009).
Two of the mouse models used to examine these sex chromosome effects on brain and behavior include the Four Core Genotypes in which gonadal (testes vs. ovaries) and chromosomal (XX vs. XY) sex are uncoupled (De Vries et al. 2002), and the SF1 knock-out mouse that has normal sex chromosomes but lacks gonads (Majdic and Tobet 2011; Budefeld et al. 2012). Here, we use a third model, the Y* mouse which offers a way to assess the roles of X-chromosome number (Eicher et al. 1991). In addition to this purpose, several laboratories have used these mice to model human aneuploid conditions, particularly Klinefelter syndrome (XXY). Data from all these models provide evidence that sex chromosome complement is involved in behavior (Gatewood et al. 2006; Quinn et al. 2007; Gioiosa et al. 2008; Grgurevic et al. 2008; Park et al. 2008; Liu et al. 2010; Cox and Rissman 2011; Bonthuis et al. 2012; Grgurevic et al. 2012).
To identify sexually dimorphic gene targets during neural development that may potentially underlie behaviors regulated by sex chromosome, we compared the four genotypes generated in the Y* model. The Y* mouse exhibits a rearrangement of the pseudoautosomal regions (PAR) which creates the unique Y* chromosome. This chromosome contains Y-chromosome genes, an inverted duplication of a partial PAR, and a small amount of X-chromosome including the centromere (Eicher et al. 1992; Burgoyne et al. 1998). Mating the XY* male with a normal XX female results in offspring with four genotypes: normal XX females (XX), 1X females, (XY*X), 2X males (XXY*) and 1X males (XY*). In this cross, the XY* chromosome consists of an X-chromosome, with an incomplete PAR, attached to the Y* chromosome. The Y*X contains the X centromere with X-chromosome genes close to PAR; it lacks any Y-chromosome genes. Comparisons between males and females with one or two X-chromosomes enable us to determine which genes are differentially represented in each genotype.
In this study, we collected whole heads at embryonic (E) day 11.5 prior to gonadal differentiation and whole brains from embryos on day E18.5, a time point after which gonads differentiate to become testes or ovaries. We used these time points because gonadal differentiation in mice occurs between E12-14 (Koopman et al. 1990; Vazquez et al. 1998) and by E18.5 testes are producing androgens (vom Saal and Bronson 1980). We determined gene expression differences using microarrays and confirmed interesting candidates with quantitative real time PCR. Through this analysis, we discovered another gene, Msl3, located on the Y* chromosome.
Materials and Methods
Animals
Y* mice (B6Ei.LT-Y(IsXPAR;Y)Ei/EiJ, strain# 002021) were purchased from Jackson Laboratories and bred in our facilities. All mice used in this study were in the C57BL/6JEiJ background and housed in constant conditions under a 12:12 light cycle (lights on at 0600 h). Food (Harlan Teklad diet #7912) and water were provided ad libitum. All experimental procedures were approved by University of Virginia Animal Use and Care Committee and performed according to the AALAC guidelines. For these studies, males from the XY* line were mated with females from the same substrain to produce offspring with four genotypes (Table 1): gonadal females with two copies of the complete X-chromosome (XX), females with one complete X-chromosome and a PAR with a few X-chromosome genes (XY*X), males with one sex chromosome containing all X-chromosome genes, the unique Y-chromosome genes, a small subset of X-genes, as well as two duplications and one deletion in the PAR (XY*), and males with the sex chromosome just described plus one normal X-chromosome (XXY*). Adult females (n=7) were paired with fertile males and checked daily for the presence of mating plugs. The day that a plug was found was designated as embryonic day 0.5 (E0.5). On E11.5 and E18.5 embryos were rapidly removed from deeply anesthetized pregnant dams between 1000 and 1200h and kept in ice-cold Dulbecco's phosphate buffered saline. Four dams were used to harvest litters at E11.5 and three dams were sacrificed at E18.5. Whole heads were removed from E11.5 embryos (n=2–4/genotype) and whole brain was dissected from E18.5 fetuses (n=2–4/genotype) and immediately flash frozen and stored at −80°C until RNA extraction. Pups were selected based on intrauterine position to reduce any potential variation from hormones produced by neighboring embryos (vom Saal 1989). Only mice residing next to zero or one male in utero were used for our analysis.
Table 1.
Genotype and sex chromosome complement in Y* mice
| Genotype | Gonads | Sry | Copies of Y |
Copies of X |
|---|---|---|---|---|
| XX | ovary | 0 | 0 | 2 |
| XY*X | ovary | 0 | 0 | 1 |
| XXY* | testes | 1 | 1 | 2 |
| XY* | testes | 1 | 1 | 1 |
To determine sex and genotype, RNA from embryonic mice was isolated from tail clippings as previously described (Park et al. 2008) and reverse transcribed into cDNA. We measured Xist mRNA as an indication for the number of X chromosomes since Xist is expressed only when an inactivated X chromosome is present and thus a PCR product only appears in samples containing two or more X chromosomes. The primers used for Xist genotyping were 5’ TAAGGACTACTTAACGGGCT 3’ (forward) and 5’ TACTCAGACATTCCCTGGCA 3’ (reverse) and we normalized the product to GAPDH as an endogenous control. The primers used for GAPDH were 5’ ACCACAGTCCATGCCATCAC 3’ (forward) and 5’ TCCACCACCCTGTTGCTGTA 3’ (reverse). To determine the gonadal sex of each embryo, we assayed for the presence or absence of the spermiogenesis specific transcript (Ssty1) which is only present on the Y-chromosome. The primers used for Ssty1 were 5’ CTGGAGCTCTACAGTGATGA 3’ (forward) and 5’ CAGTTACCAATCAACACATCAC 3’ (reverse) and we normalized the product to myogenin as an endogenous control; 5’ TTACGTCCATCGTGGACAGCAT 3’ (forward) and 5’ TGGGCTGGGTGTTAGTCTTAT 3’ (reverse). In addition to this, we used gene expression profiles across chromosomes X and Y to confirm genotypes. As shown in Supplemental Figure 1, replicate samples clustered together according to age and genotype based on our principle component analysis of chromosome X- and Y-gene expression profiles.
RNA isolation and microarray hybridization
Total RNA was extracted from individual embryonic heads (E11.5) or whole brain (E18.5) in Trizol reagent (Invitrogen) according to the manufacturer's protocol. RNA concentration and quality was assessed by the Agilent 2100 Bioanalyzer (Agilent). Briefly, total RNA (1 µg) was transcribed into double-stranded cDNA using the One-cycle Targeting and Control Reagent kit (Affymetrix, Santa Clara, CA). Biotin-labeled cRNA was synthesized from cDNA, purified and fragmented according to manufacturer's instructions. Labeled cRNA from individual animals (n = 2–4/group, each from a different litter) was hybridized to a Mouse Genome 430 2.0 array (Affymetrix) for each sample (n = 24 total microarrays).
Statistical analysis of microarrays
Microarray data were processed using GeneChip Operating Software v4.1 (GCOS, Affymetrix). Quality control analyses were performed on the array data including intensity histogram plots, calculation of background levels, and fraction of probe sets detecting RNA. As shown in Supplemental Figures 2 and 3, we generated normalized unscaled standard error (NUSE) and relative log expression (RLE) plots, which are sensitive indicators of hybridization quality (Gentleman et al. 2005). The data were further checked for reproducibility by generating MvA plots which are pairwise scatter plots of M = difference of log intensities (y-axis) versus A = average log intensities (x-axis) for all replicates. All arrays were determined to be acceptable and further analyzed using GCRMA, a low-level analysis algorithm to arrive at estimates of relative gene expression levels. We performed modified t-tests within age groups to compare gene expression differences between genotypes as well as between age groups using the limma package in the Bioconductor software suite (Smyth 2004). In order to arrive at robust differences in gene expression that can be detected by qPCR, we applied a 1.5 fold change and 20% false discovery rate (FDR) cutoff for each comparison. The FDR was calculated using the Benjamini-Hochberg procedure (Benjamini and Hochberg 1995). We also assessed reproducibility and confirmed genotypes by generating a principle component plot (Supplemental Figure 1) using the plotPCA function from the Affycoretools package within Bioconductor using normalized, log2 GCRMA expression values for all probe sets on X- and Y-chromosomes.
Quantitative real time PCR
Total RNA was isolated from the whole heads (E11.5) and the brain tissue (E18.5) from male and female embryos (n=2–4/group, each from a different litter). cDNA was generated from 1 µg of total RNA by reverse transcription with the iScript cDNA kit (Bio-Rad). Quantitative real time PCR was performed using the OneStep™ System (ABI) according to the manufacturer’s instructions for SYBR Green based detection. Samples were run in triplicates on either one or two plates and the average values were analyzed. SYBR Green primers were designed for BC022906, Eif2s3x, Hccs, Kmd5c, Kdm6a, Mid1, Xist, Msl3, Msl2, Msl1, Myst1, Dxh9 and Ppib (control gene). Primer sequences for these genes can be found in Supplemental Table 1. Quantification of candidate gene expression was calculated based on the threshold cycle (Ct) for each well using the provided software and normalized to peptidylprolyl isomerase B (Ppib) as the endogenous control. Relative amount of gene expression was scaled to XX females as the reference sample. All data was analyzed using NCSS (2007). For data analysis, we used two-way ANOVA with gonadal sex and X-chromosome number as factors. Significant results were assessed by Tukey-Kramer's post hoc tests that adjust significance levels to take multiple comparisons into account.
Copy number assay
Genomic DNA was extracted from adult cerebellum of the four Y* genotypes: XX, XY*X, XXY* and XY*. For comparison, genomic DNA was isolated from whole brain of E18.5 wild type male and female C57BL/6J embryos. DNA was isolated using standard phenol:chloroform extraction procedures. Briefly, brain tissue was homogenized in TE buffer and protein was digested using proteinase K. DNA was extracted twice using phenol:chloroform:isoamyl alcohol, then precipitated with 3M sodium acetate in ethanol. Isolated DNA was washed in ethanol, resuspended in TE buffer and any remaining RNA was digested by RNase A. The amount and purity of DNA was assessed by spectrophotometer. 20ng of DNA was used in a PCR reaction to determine the relative amount of Msl3, Hccs and BC022960 within each genotype and normalized to peptidylprolyl isomerase B (Ppib) as the endogenous control. The relative amount of each gene of interest was calculated using the ΔΔ Ct method (Livak and Schmittgen 2001). For copy number analysis, relative amount of genomic DNA was normalized to Ppib as an endogenous control and XY C57BL/6 males were used for the reference sample. Thus, the relative gene copy in C57BL/6 males was set to 1. For data analysis, we used two-way ANOVA with gonadal sex and X-chromosome number as factors. Significance was determined by Tukey-Kramer post hoc tests.
Results
Sex differences in Y* mice prior to and after gonad differentiation
We compared E11.5 male and female embryos with one or two X-chromosomes to determine which genes were differentially expressed between males and females before gonadal differentiation (Figure 1); 32 transcripts were significantly altered (Table 2). Of these, four Y-chromosome genes and 16 autosomal genes differed between XY*X and XY*. Genes encoding kinases (Frk and Mobkl1k) or a voltage-gated calcium channel that regulates AMPA activation (Cacng5), as well as a few genes that likely play a role in cell growth and or immune response (Nedd9, Cyr61, Wdr1, Defcr3 and Ebi3) were significantly different by sex in mice with one X-chromosome. Frk and Nedd9 were also altered in the XY*X and XX female comparison, thus this change is not related to gonadal sex and may be produced by non-gonadal effects of Sry, other Y-chromosome genes, or some other genetic differences between XY* and XY*X.
Figure 1. Numbers of genes significantly altered by age, sex or genotype in the Y* mouse brain.

Numbers and associated arrows shown between age, sex or genotype indicate the number of differentially expressed genes called for a given comparison. The majority of gene expression changes occurred between embryonic day (E) 11.5 and 18.5 within each genotype. Far fewer genes were significantly altered between genotype or sex. XX = normal female, XY*X = 1X female, XXY* = 2X male, XY* = normal male.
Table 2.
Genes differentially expressed between males and females with the same number of X-chromosomes prior to (E11.5) and following (E18.5) the onset of gonadal hormones. P-values are corrected for multiple tests and represent the False Discovery Rate (FDR). Fold changes above and below 1 are represented differently. Those above 1 are the expression value of the first genotype divided by the second in the comparison. Those below 1 are negative the expression value of the second genotype divided by the first in the comparison.
| Probe | Symbol | Gene Name | Chromosome | p-value | Fold Change |
|
|---|---|---|---|---|---|---|
| E11.5 XY* vs. E11.5 XY*X | ||||||
| 1424903_at | Jarid1d | jumonji, AT rich interactive domain 1D (Rbp2 like) |
Y | 0 | 12.7 | |
| 1417210_at | Eif2s3y | eukaryotic translation initiation factor 2, subunit 3, structural gene Y-linked |
Y | 0 | 14.4 | |
| 1426438_at | Ddx3y | DEAD (Asp-Glu-Ala-Asp) box polypeptide 3, Y-linked |
Y | 0 | 16.4 | |
| 1457945_at | 0 | 11.6 | ||||
| 1452077_at | Ddx3y | DEAD (Asp-Glu-Ala-Asp) box polypeptide 3, Y-linked |
Y | 0 | 9.6 | |
| 1426598_at | Uty | ubiquitously transcribed tetratricopeptide repeat gene, Y- chromosome |
Y | 0 | 8.0 | |
| 1426439_at | Ddx3y | DEAD (Asp-Glu-Ala-Asp) box polypeptide 3, Y-linked |
Y | 0 | 9.4 | |
| 1442153_at | 0 | 7.5 | ||||
| 1457582_at | Uty | ubiquitously transcribed tetratricopeptide repeat gene, Y- chromosome |
Y | 0 | 7.8 | |
| 1421362_a_at | Frk | fyn-related kinase | 10 | 0 | −1.7 | |
| 1438139_at | Arhgap28 | Rho GTPase activating protein 28 | 17 | 0.002 | −1.5 | |
| 1446289_at | 0.002 | −0.5 | ||||
| 1436320_at | 0.003 | −1.9 | ||||
| 1430514_a_at | Cd99 | CD99 antigen | 4 | 0.007 | −3.2 | |
| 1428850_x_at | Cd99 | CD99 antigen | 4 | 0.008 | −2.9 | |
| 1450767_at | Nedd9 | neural precursor cell expressed, developmentally down-regulated gene 9 |
13 | 0.009 | −1.7 | |
| 1426519_at | P4ha1 | procollagen-proline, 2-oxoglutarate 4-dioxygenase (proline 4- hydroxylase), alpha 1 polypeptide |
10 | 0.011 | −1.5 | |
| 1422802_at | Defcr3 | defensin related cryptdin 3 | 8 | 0.012 | −3.8 | |
| 1449446_at | Ccdc59 | coiled-coil domain containing 59 | 10 | 0.012 | 1.5 | |
| 1459775_at | 0.012 | 1.6 | ||||
| 1448057_at | 0.014 | −1.7 | ||||
| 1441715_at | 0.018 | 1.8 | ||||
| 1444479_at | 0.022 | −1.9 | ||||
| 1437591_a_at | Wdr1 | WD repeat domain 1 | 5 | 0.028 | −2.3 | |
| 1424484_at | Mobkl1b | MOB1, Mps One Binder kinase activator-like 1B (yeast) |
6 | 0.096 | −2.3 | |
| 1453556_x_at | Cd99 | CD99 antigen | 4 | 0.128 | −2.2 | |
| 1434785_at | Cacng5 | calcium channel, voltage- dependent, gamma subunit 5 |
11 | 0.147 | −1.8 | |
| 1442398_at | LOC100047 829 |
similar to ubiquitin-conjugating enzyme E2T (putative) |
1 | 0.159 | 1.9 | |
| 1438133_a_at | Cyr61 | cysteine rich protein 61 | 3 | 0.167 | −1.6 | |
| 1439419_at | 2310057M2 1Rik |
RIKEN cDNA 2310057M21 gene | 7 | 0.169 | 1.6 | |
| 1449222_at | Ebi3 | Epstein-Barr virus induced gene 3 | 17 | 0.183 | 2.1 | |
| 1416213_x_at | Surf4 | surfeit gene 4 | 2 | 0.194 | −1.5 | |
| E11.5 XXY* vs. E11.5 XX | ||||||
| 1424903_at | Jarid1d | jumonji, AT rich interactive domain 1D (Rbp2 like) |
Y | 0 | 87.4 | |
| 1417210_at | Eif2s3y | eukaryotic translation initiation factor 2, subunit 3, structural gene Y-linked |
Y | 0 | 104.7 | |
| 1457945_at | 0 | 49.9 | ||||
| 1426438_at | Ddx3y | DEAD (Asp-Glu-Ala-Asp) box polypeptide 3, Y-linked |
Y | 0 | 136.2 | |
| 1452077_at | Ddx3y | DEAD (Asp-Glu-Ala-Asp) box polypeptide 3, Y-linked |
Y | 0 | 30.3 | |
| 1426598_at | Uty | ubiquitously transcribed tetratricopeptide repeat gene, Y- chromosome |
Y | 0 | 16.0 | |
| 1422894_at | Sfmbt1 | Scm-like with four mbt domains 1 | 14 | 0 | −1.5 | |
| 1426439_at | Ddx3y | DEAD (Asp-Glu-Ala-Asp) box polypeptide 3, Y-linked |
Y | 0 | 17.6 | |
| 1457582_at | Uty | ubiquitously transcribed tetratricopeptide repeat gene, Y- chromosome |
Y | 0 | 11.5 | |
| 1442153_at | 0 | 9.2 | ||||
| 1419952_at | Stx5a | syntaxin 5A | 19 | 0 | −1.5 | |
| 1422802_at | Defcr3 | defensin related cryptdin 3 | 8 | 0.004 | −4.7 | |
| 1436320_at | 0.005 | −1.9 | ||||
| 1448057_at | 0.008 | −1.8 | ||||
| 1415861_at | Tyrp1 | tyrosinase-related protein 1 | 4 | 0.022 | −1.6 | |
| 1420720_at | Nptx2 | neuronal pentraxin 2 | 5 | 0.022 | 2.8 | |
| 1438227_at | She | src homology 2 domain-containing transforming protein E |
3 | 0.029 | −1.6 | |
| 1445419_at | Gtpbp8 | GTP-binding protein 8 (putative) | 16 | 0.046 | −1.9 | |
| 1421117_at | Dst | dystonin | 1 | 0.058 | 1.7 | |
| 1459290_at | C030015D1 9Rik |
RIKEN cDNA C030015D19 gene | 2 | 0.071 | 1.6 | |
| 1428850_x_at | Cd99 | CD99 antigen | 4 | 0.071 | −2.4 | |
| 1422247_a_at | Uty | ubiquitously transcribed tetratricopeptide repeat gene, Y- chromosome |
Y | 0.078 | 4.3 | |
| 1458880_at | 0.085 | −1.7 | ||||
| 1456020_at | Sh3tc2 | SH3 domain and tetratricopeptide repeats 2 |
18 | 0.086 | −1.6 | |
| 1420786_a_at | Rbmy1a1 | RNA binding motif protein, Y- chromosome, family 1, member A1 |
Y | 0.087 | 3.1 | |
| 1453556_x_at | Cd99 | CD99 antigen | 4 | 0.099 | −2.3 | |
| 1437531_at | Trpm1 | transient receptor potential cation channel, subfamily M, member 1 |
7 | 0.129 | −2.0 | |
| 1454447_at | 5830434F19 Rik |
RIKEN cDNA 5830434F19 gene | 2 | 0.164 | −1.6 | |
| E18.5 XY* vs. E18.5 XY*X | ||||||
| 1424903_at | Jarid1d | jumonji, AT rich interactive domain 1D (Rbp2 like) |
Y | 0 | 52.3 | |
| 1417210_at | Eif2s3y | eukaryotic translation initiation factor 2, subunit 3, structural gene Y-linked |
Y | 0 | 226.0 | |
| 1426438_at | Ddx3y | DEAD (Asp-Glu-Ala-Asp) box polypeptide 3, Y-linked |
Y | 0 | 296.1 | |
| 1452077_at | Ddx3y | DEAD (Asp-Glu-Ala-Asp) box polypeptide 3, Y-linked |
Y | 0 | 32.4 | |
| 1457945_at | 0 | 22.2 | ||||
| 1426439_at | Ddx3y | DEAD (Asp-Glu-Ala-Asp) box polypeptide 3, Y-linked |
Y | 0 | 47.8 | |
| 1426598_at | Uty | ubiquitously transcribed tetratricopeptide repeat gene, Y- chromosome |
Y | 0 | 8.6 | |
| 1425162_at | Rorb | RAR-related orphan receptor beta | 19 | 0.001 | −1.7 | |
| 1442153_at | 0.001 | 6.7 | ||||
| 1422196_at | Htr5b | 5-hydroxytryptamine (serotonin) receptor 5B |
1 | 0.001 | 1.7 | |
| 1436320_at | 0.001 | −2.1 | ||||
| 1457582_at | Uty | ubiquitously transcribed tetratricopeptide repeat gene, Y- chromosome |
Y | 0.001 | 6.7 | |
| 1431642_at | Eif2s3y | eukaryotic translation initiation factor 2, subunit 3, structural gene Y-linked |
Y | 0.001 | 6.1 | |
| 1448057_at | 0.005 | −1.8 | ||||
| 1453556_x_at | Cd99 | CD99 antigen | 4 | 0.006 | −2.9 | |
| 1416754_at | Prkar1b | protein kinase, cAMP dependent regulatory, type I beta |
5 | 0.011 | −1.6 | |
| 1430514_a_at | Cd99 | CD99 antigen | 4 | 0.017 | −3.0 | |
| 1437644_at | B3galt2 | UDP-Gal:betaGlcNAc beta 1,3- galactosyltransferase, polypeptide 2 |
1 | 0.033 | −1.9 | |
| 1429730_at | 1810009N0 2Rik |
RIKEN cDNA 1810009N02 gene | 12 | 0.047 | −2.1 | |
| 1441949_x_at | Slc39a6 | solute carrier family 39 (metal ion transporter), member 6 |
18 | 0.098 | −1.5 | |
| 1428850_x_at | Cd99 | CD99 antigen | 4 | 0.116 | −2.3 | |
| 1453429_at | EG665787 | predicted gene, EG665787 | 8 | 0.118 | 1.7 | |
| 1440716_at | 6430604M1 1Rik |
RIKEN cDNA 6430604M11 gene | 6 | 0.171 | 1.8 | |
| E18.5 XXY* vs. E18.5 XX | ||||||
| 1424903_at | Jarid1d | jumonji, AT rich interactive domain 1D (Rbp2 like) |
Y | 0 | 51.3 | |
| 1417210_at | Eif2s3y | eukaryotic translation initiation factor 2, subunit 3, structural gene Y-linked |
Y | 0 | 196.7 | |
| 1426438_at | Ddx3y | DEAD (Asp-Glu-Ala-Asp) box polypeptide 3, Y-linked |
Y | 0 | 195.4 | |
| 1452077_at | Ddx3y | DEAD (Asp-Glu-Ala-Asp) box polypeptide 3, Y-linked |
Y | 0 | 27.9 | |
| 1457945_at | 0 | 21.7 | ||||
| 1426439_at | Ddx3y | DEAD (Asp-Glu-Ala-Asp) box polypeptide 3, Y-linked |
Y | 0 | 33.1 | |
| 1450285_at | Ube1y1 | ubiquitin-activating enzyme E1, Chr Y 1 |
Y | 0 | 4.9 | |
| 1426598_at | Uty | ubiquitously transcribed tetratricopeptide repeat gene, Y- chromosome |
Y | 0 | 7.8 | |
| 1442153_at | 0 | 8.2 | ||||
| 1436320_at | 0 | −2.3 | ||||
| 1440192_at | Ttc39b | tetratricopeptide repeat domain 39B |
4 | 0.001 | −1.5 | |
| 1448057_at | 0.003 | −1.9 | ||||
| 1457582_at | Uty | ubiquitously transcribed tetratricopeptide repeat gene, Y- chromosome |
Y | 0.004 | 5.7 | |
| 1431642_at | Eif2s3y | eukaryotic translation initiation factor 2, subunit 3, structural gene Y-linked |
Y | 0.004 | 5.2 | |
| 1443545_at | 0.004 | −1.9 | ||||
| 1450181_at | Cux2 | cut-like homeobox 2 | 5 | 0.009 | −1.6 | |
| 1430206_at | 4933407L21 Rik |
RIKEN cDNA 4933407L21 gene | 1 | 0.014 | −1.9 | |
| 1453556_x_at | Cd99 | CD99 antigen | 4 | 0.029 | −2.6 | |
| 1428575_at | Fcho1 | FCH domain only 1 | 8 | 0.032 | −1.9 | |
| 1457555_at | Gpr151 | G protein-coupled receptor 151 | 18 | 0.034 | −1.7 | |
| 1440054_at | Pik3ca | phosphatidylinositol 3-kinase, catalytic, alpha polypeptide | 3 | 0.043 | −1.7 | |
| 1460030_at | Hecw1 | HECT, C2 and WW domain containing E3 ubiquitin protein ligase 1 |
13 | 0.074 | 1.7 | |
| 1428850_x_at | Cd99 | CD99 antigen | 4 | 0.075 | −2.4 | |
| 1444025_at | Kcnj3 | potassium inwardly-rectifying channel, subfamily J, member 3 |
2 | 0.078 | 2.2 | |
| 1425790_a_at | Grik2 | glutamate receptor, ionotropic, kainate 2 (beta 2) |
10 | 0.085 | 1.9 | |
| 1438685_at | Zmym6 | zinc finger, MYM-type 6 | 4 | 0.096 | 1.6 | |
| 1417489_at | Npy2r | neuropeptide Y receptor Y2 | 3 | 0.114 | 2.1 | |
| 1438710_at | Htr1a | 5-hydroxytryptamine (serotonin) receptor 1A |
13 | 0.127 | 1.6 | |
| 1429249_at | 4833424O1 5Rik |
RIKEN cDNA 4833424O15 gene | 3 | 0.134 | 1.7 | |
| 1429730_at | 1810009N0 2Rik |
RIKEN cDNA 1810009N02 gene | 12 | 0.134 | −1.9 | |
| 1421519_a_at | Zfp120 | zinc finger protein 120 | 2 | 0.134 | 1.6 | |
| 1457523_at | 9530056K1 5Rik |
RIKEN cDNA 9530056K15 gene | 5 | 0.136 | −1.6 | |
| 1452623_at | Zfp759 | zinc finger protein 759 | 13 | 0.146 | 1.7 | |
| 1449634_a_at | Anks1b | ankyrin repeat and sterile alpha motif domain containing 1B |
10 | 0.146 | 3.4 | |
| 1432329_a_at | Matk | megakaryocyte-associated tyrosine kinase |
10 | 0.146 | 2.2 | |
| 1432836_at | 4833410I11 Rik |
RIKEN cDNA 4833410I11 gene | 0.152 | −1.6 | ||
| 1440457_at | 0.152 | 1.6 | ||||
| 1417852_x_at | Clca1 | chloride channel calcium activated 1 |
3 | 0.154 | 1.9 | |
| 1421606_a_at | Sult4a1 | sulfotransferase family 4A, member 1 |
15 | 0.154 | 1.7 | |
| 1427227_at | Gabrg1 | gamma-aminobutyric acid (GABA- A) receptor, subunit gamma 1 |
5 | 0.164 | 1.8 | |
| 1421138_a_at | Pkib | protein kinase inhibitor beta, cAMP dependent, testis specific |
10 | 0.168 | −1.8 | |
| 1442956_at | 0.182 | 1.5 | ||||
| 1428775_at | 1110008L16 Rik |
RIKEN cDNA 1110008L16 gene | 12 | 0.182 | 1.7 | |
| 1458534_at | Rgs7bp | regulator of G-protein signalling 7 binding protein |
13 | 0.183 | 2.4 | |
| 1456637_at | Lrrtm2 | leucine rich repeat transmembrane neuronal 2 |
18 | 0.195 | 1.5 | |
At E11.5, comparisons between XXY* and XX mice revealed 28 differentially expressed transcripts (Table 2); 13 autosomal genes were significantly different. In general, genes involved in signaling and transport within the cell (i.e. syntaxin 5a and dystonin) or involved in synaptic plasticity and myelination (neuronal pentraxin 2, Nptx2, and SH3 domain and tetratricopeptide repeat 2, Sh3tc2) differed in males and female with two X-chromosomes. Src homology2 domain (She), GTP-binding protein 8 (Gtpbp8) and Scm-like with four mbt domains (Sfmbt1), all genes that encode for proteins involved in tyrosine kinase signaling and transcriptional repression were decreased in XXY* males. Two genes with putative roles in melanin synthesis, Trpm1, transient receptor potential cation channel m1, and Tyrp1, tyrosinase-related protein 1 are also decreased in XXY* males as compared to XX females.
Four Y-chromosome genes represented by 7 probe sets were higher in both XY* and XXY* males when compared to their female counterparts. Kdm5d, Eif2s3y, Ddx3y, and Uty, all have paralogs on the X chromosome that escape X-inactivation. One additional Y gene, RNA binding motif protein, Y chromosome, member A1, (Rbmy1a1) was elevated in XXY* vs. XX.
At embryonic day 18.5, following gonadal differentiation, 24 transcripts were differentially expressed between males and females with one X-chromosome (Figure 1). Two transcripts encode receptors: Ht5b, serotonin receptor 5b, and Rorb, a nuclear receptor with no currently defined function, but associated with neurological disease. One protein kinase A subunit, Prkar1b, was increased in XY*X females as compared to XY* males. As in the E11.5 comparisons, four Y-linked transcripts, Kdm5d, Eif2s3y, Ddx3y and Uty, were expressed in both XY* and XXY* males, but not in females.
When XXY* males and XX females were compared, 45 transcripts were differentially expressed (Table 2). One of these genes, Cux2, cut-like homeobox 2, was higher in XX females when compared to XXY* males and recently this same sex difference was noted in female mouse liver (Conforto and Waxman 2012). In our study, Cux2 was also increased in XX females when compared to XXY* males and XY*X females. This gene is involved in dendritic spine morphology in brain and could be important for sex differences. A few receptors important for neuronal signaling were influenced by sex in this comparison as well. The ionotropic glutamate receptor, AMPA (Grik2), GABA A receptor gamma subunit (Gabrg1), the serotonin receptor (Htr1a), neuropeptide Y receptor 2 (Npy2r), and an inwardly rectifying potassium channel (Kcnj3) were increased in E18.5 XXY* as compared to XX brains. Tetracoid repeat domain 39B (Tct39b) was higher in XX females compared to XXY* males and is reported to be sensitive to estrogens, suggesting that estrogens could depress this mRNA in brain. Finally, Cd99 is an interesting gene candidate; it encodes a surface glycoprotein, and in humans it resides within the pseudoautosomal region (PAR) thus escaping X-inactivation. In mouse, however, it resides on Chromosome 4, and is increased in females compared to males at both ages regardless of sex chromosome complement.
Gene expression affected by number of X-chromosomes prior to gonad differentiation
At embryonic day 11.5, gonadal tissues have not yet differentiated into testes or ovaries. Presumably any differences in gene expression profiles would be from the contribution of sex chromosomes. Within each sex, we identified genes affected by X-chromosome number (Figure 1 and Table 3). We identified 22 probe sets with significantly altered transcript levels between XY*X and XX females. About half of the probe sets (9 out of 22) were located on the X-chromosome, and a few of these have been identified as genes that escape X-inactivation (Table 2 and Figure 2). Most of the autosomal genes we discovered are not well characterized. But two of these genes, tyrosinase-related protein (Tyrp1) and neural precursor (Nedd9) are binding partners. Nedd9 is a scaffolding protein involved in tyrosine kinase activity and neuronal development (Vogel et al. 2010). Other annotated autosomal genes such as Fyn-related kinase (Frk), neuronal pentraxin 2 (Nptx2) and ORAI calcium release-activated calcium channel (Orai1), are kinases or receptors that are involved in neuronal development. All of these genes were elevated in XY*X as compared to XX females. In male XY* vs. XXY* mice, expression of 16 transcripts was significantly different. Surprisingly, only two autosomal genes were differentially expressed: PTPRF interacting protein (Ppfibp1, a tyrosine kinase involved in axonal guidance) and pleckstrin homology domain containing member 2 (Plekhh2) were higher in XY* than XXY* males, but little is known about their function.
Table 3.
Genes significantly altered in 1X vs. 2X mice at prior to (E11.5) and following (E18.5) the onset of gonadal hormones. P-values are corrected for multiple tests and represent the False Discovery Rate (FDR). Fold changes above and below 1 are represented differently. Those above 1 are the expression value of the first genotype divided by the second in the comparison. Those below 1 are negative the expression value of the second genotype divided by the first in the comparison.
| Probe | Symbol | Gene Name | Chromosome | p- value |
Fold Change |
|
|---|---|---|---|---|---|---|
| E11.5 XY*X vs. E11.5 XX | ||||||
| 1427263_at | Xist | inactive X specific transcripts | X | 0.00 | −67.18 | |
| 1427262_at | Xist | inactive X specific transcripts | X | 0.00 | −249.00 | |
| 1448645_at | Msl3 | male-specific lethal 3 homolog (Drosophila) |
X | 0.00 | 1.88 | |
| 1421362_a_at | Frk | fyn-related kinase | 10 | 0.00 | 1.62 | |
| 1420087_at | Fzd3 | frizzled homolog 3 (Drosophila) | 14 | 0.00 | −1.75 | |
| 1420890_at | Hccs | holocytochrome c synthetase | X | 0.01 | 2.07 | |
| 1427198_at | BC022960 | cDNA sequence BC022960 | X | 0.01 | 2.06 | |
| 1436936_s_at | Tsix | X (inactive)-specific transcript, antisense |
X | 0.01 | −167.73 | |
| 1415861_at | Tyrp1 | tyrosinase-related protein 1 | 4 | 0.02 | −1.72 | |
| 1444479_at | 0.05 | 1.96 | ||||
| 1457433_x_at | Zfp120 | zinc finger protein 120 | 2 | 0.05 | −1.51 | |
| 1427672_a_at | Kdm6a | ubiquitously transcribed tetratricopeptide repeat gene, X- chromosome |
X | 0.05 | −1.83 | |
| 1452750_at | 5530601H04 Rik |
RIKEN cDNA 5530601H04 gene |
X | 0.05 | −1.87 | |
| 1459290_at | C030015D19 Rik |
RIKEN cDNA C030015D19 gene |
2 | 0.05 | 1.69 | |
| 1420720_at | Nptx2 | neuronal pentraxin 2 | 5 | 0.05 | 2.66 | |
| 1450767_at | Nedd9 | neural precursor cell expressed, developmentally down-regulated gene 9 |
13 | 0.07 | 1.57 | |
| 1458880_at | 0.10 | −1.72 | ||||
| 1423744_x_at | Eif2s3x | eukaryotic translation initiation factor 2, subunit 3, structural gene X-linked |
X | 0.12 | −1.55 | |
| 1430116_at | Cyp4f41-ps | cytochrome P450, family 4, subfamily f, polypeptide 41 pseudogene |
17 | 0.13 | −1.56 | |
| 1442245_at | 0.13 | 1.55 | ||||
| 1419712_at | Il3ra | interleukin 3 receptor, alpha chain |
14 | 0.18 | −1.51 | |
| 1424990_at | Orai1 | ORAI calcium release-activated calcium modulator 1 |
5 | 0.19 | 2.08 | |
| E11.5 XY* vs. E11.5 XXY* | ||||||
| 1427263_at | Xist | inactive X specific transcripts | X | 0.00 | −118.60 | |
| 1427262_at | Xist | inactive X specific transcripts | X | 0.00 | −254.23 | |
| 1448645_at | Msl3 | male-specific lethal 3 homolog (Drosophila) |
X | 0.00 | 2.01 | |
| 1427198_at | BC022960 | cDNA sequence BC022960 | X | 0.00 | 2.39 | |
| 1420890_at | Hccs | holocytochrome c synthetase | X | 0.00 | 2.25 | |
| 1436936_s_at | Tsix | X (inactive)-specific transcript, antisense |
X | 0.00 | −149.09 | |
| 1459775_at | 0.01 | 1.72 | ||||
| 1441715_at | 0.03 | 1.79 | ||||
| 1443029_at | Ppfibp1 | PTPRF interacting protein, binding protein 1 (liprin beta 1) |
6 | 0.04 | 1.53 | |
| 1446289_at | 0.05 | 1.60 | ||||
| 1427672_a_at | Kdm6a | ubiquitously transcribed tetratricopeptide repeat gene, X- chromosome |
X | 0.06 | −1.69 | |
| 1423744_x_at | Eif2s3x | eukaryotic translation initiation factor 2, subunit 3, structural gene X-linked |
X | 0.09 | −1.51 | |
| 1435348_at | D930009K15 Rik |
RIKEN cDNA D930009K15 gene |
X | 0.09 | −1.51 | |
| 1452750_at | 5530601H04 Rik |
RIKEN cDNA 5530601H04 gene |
X | 0.09 | −1.68 | |
| 1451090_a_at | Eif2s3x | eukaryotic translation initiation factor 2, subunit 3, structural gene X-linked |
X | 0.11 | −1.52 | |
| 1444817_at | Plekhh2 | pleckstrin homology domain containing, family H (with MyTH4 domain) member 2 |
17 | 0.12 | 1.84 | |
| E18.5 XY*X vs. E18.5 XX | ||||||
| 1427263_at | Xist | inactive X specific transcripts | X | 0.00 | −81.01 | |
| 1427262_at | Xist | inactive X specific transcripts | X | 0.00 | −498.00 | |
| 1427198_at | BC022960 | cDNA sequence BC022960 | X | 0.00 | 3.46 | |
| 1436936_s_at | Tsix | X (inactive)-specific transcript, antisense |
X | 0.00 | −1209.34 | |
| 1448645_at | Msl3 | male-specific lethal 3 homolog (Drosophila) |
X | 0.00 | 2.04 | |
| 1420890_at | Hccs | holocytochrome c synthetase | X | 0.00 | 2.53 | |
| 1425384_a_at | Ube4a | ubiquitination factor E4A, UFD2 homolog (S. cerevisiae) |
9 | 0.00 | 1.74 | |
| 1425162_at | Rorb | RAR-related orphan receptor beta |
19 | 0.00 | 1.74 | |
| 1430206_at | 4933407L21R ik |
RIKEN cDNA 4933407L21 gene | 1 | 0.00 | −2.41 | |
| 1450181_at | Cux2 | cut-like homeobox 2 | 5 | 0.00 | −1.82 | |
| 1443545_at | 0.01 | −1.84 | ||||
| 1423125_at | Dclk1 | doublecortin-like kinase 1 | 3 | 0.03 | 2.25 | |
| 1458499_at | Pde10a | phosphodiesterase 10A | 17 | 0.03 | 1.60 | |
| 1457555_at | Gpr151 | G protein-coupled receptor 151 | 18 | 0.04 | −1.78 | |
| 1443802_at | 0.09 | −1.58 | ||||
| 1428775_at | 1110008L16R ik |
RIKEN cDNA 1110008L16 gene | 12 | 0.10 | 1.92 | |
| 1418268_at | Htr3a | 5-hydroxytryptamine (serotonin) receptor 3A |
9 | 0.11 | 2.20 | |
| 1458534_at | Rgs7bp | regulator of G-protein signalling 7 binding protein |
13 | 0.13 | 2.69 | |
| 1429249_at | 4833424O15 Rik |
RIKEN cDNA 4833424O15 gene |
3 | 0.13 | 1.73 | |
| 1440429_at | Arpp21 | cyclic AMP-regulated phosphoprotein, 21 |
9 | 0.14 | 1.99 | |
| 1457523_at | 9530056K15R ik |
RIKEN cDNA 9530056K15 gene | 5 | 0.15 | −1.64 | |
| 1440054_at | Pik3ca | phosphatidylinositol 3-kinase, catalytic, alpha polypeptide |
3 | 0.15 | −1.64 | |
| 1449634_a_at | Anks1b | ankyrin repeat and sterile alpha motif domain containing 1B |
10 | 0.17 | 3.68 | |
| 1440457_at | 0.17 | 1.69 | ||||
| 1426246_at | Pros1 | protein S (alpha) | 16 | 0.17 | 1.79 | |
| 1452597_at | 2310061C15 Rik |
RIKEN cDNA 2310061C15 gene |
8 | 0.17 | −1.51 | |
| 1440871_at | Magi1 | membrane associated guanylate kinase, WW and PDZ domain containing 1 |
6 | 0.17 | 1.60 | |
| 1456637_at | Lrrtm2 | leucine rich repeat transmembrane neuronal 2 |
18 | 0.18 | 1.60 | |
| 1425790_a_at | Grik2 | glutamate receptor, ionotropic, kainate 2 (beta 2) |
10 | 0.18 | 1.85 | |
| 1432836_at | 4833410I11Ri k |
RIKEN cDNA 4833410I11 gene | 0.18 | −1.58 | ||
| 1438344_at | 4833424O15 Rik |
RIKEN cDNA 4833424O15 gene |
3 | 0.19 | 1.58 | |
| 1451867_x_at | Arhgap6 | Rho GTPase activating protein 6 |
X | 0.20 | 1.88 | |
| E18.5 XY* vs. E18.5 XXY* | ||||||
| 1427263_at | Xist | inactive X specific transcripts | X | 0.00 | −84.45 | |
| 1427262_at | Xist | inactive X specific transcripts | X | 0.00 | −541.19 | |
| 1448645_at | Msl3 | male-specific lethal 3 homolog (Drosophila) |
X | 0.00 | 2.11 | |
| 1436936_s_at | Tsix | X (inactive)-specific transcript, antisense |
X | 0.00 | −935.76 | |
| 1450285_at | Ube1y1 | ubiquitin-activating enzyme E1, Chr Y 1 |
Y | 0.00 | −3.05 | |
| 1427198_at | BC022960 | cDNA sequence BC022960 | X | 0.00 | 2.30 | |
| 1420890_at | Hccs | holocytochrome c synthetase | X | 0.00 | 2.04 | |
| 1427242_at | Ddx4 | DEAD (Asp-Glu-Ala-Asp) box polypeptide 4 |
13 | 0.15 | 1.54 | |
| 1429452_x_at | 4933439C20 Rik |
RIKEN cDNA 4933439C20 gene |
Y | 0.17 | −1.83 | |
Figure 2. Genes escaping X-inactivation at E11.5 and E18.5.

Quantitative PCR of relative gene expression for X-inactive specific transcript (Xist) at A. E11.5 and B. E18.5, eukaryotic translation initiation factor 2 subunit 3 X-linked (Eif2s3x) at C. E11.5 and D. E18.5, lysine(K)-specific demethylase 6a (Kdm6a) at E. E11.5 and F. E18.5 and lysine(K)-specific demethylase 6a (Kdm5c) at G. E11.5 and H. E18.5. Expression is relative to peptidylprolyl isomerase B (Ppib) and normalized to XX females. * p<0.05 main effect of X-chromosome number.
Four of the 13 mouse genes known to escape X-inactivation, Xist, Tsix, Kdm6a, and Eif2s3x (Yang et al. 2006; Reinius et al. 2010), were higher in tissues from mice with two X-chromosomes (Figure 2). Interestingly, we also observed X-chromosome genes with higher transcript levels in XY*X and XY* mice as compared with XX and XXY* mice: Msl3, Hccs, and BC022960 . These genes tended to be located on the distal tip of the X-chromosome (Figures 3 and 5). One of these genes, Msl3, male-specific lethal-3, in Drosophila targets the dosage compensation complex (DCC) to the X-chromosome.
Figure 3. Genes located on distal tip of X-chromosome with expression higher in 1X mice at E11.5 and E18.5.

Quantitative PCR of relative gene expression for BC022960 , an uncharacterized transcript at A. E11.5 and B. E18.5, holocytochrome c synthase (Hccs) at C. E11.5 and D. E18.5, male specific lethal 3 (Msl3) at E. E11.5 and F. E18.5, and midline-1 (Mid1) at G. E11.5 and H. E18.5. Expression is relative to peptidylprolyl isomerase B (Ppib) and normalized to XX females. * p<0.05 main effect of X-chromosome number.
Figure 5. Schematic of the mouse X-chromosome with an overlay of genes reported to escape X-inactivation.
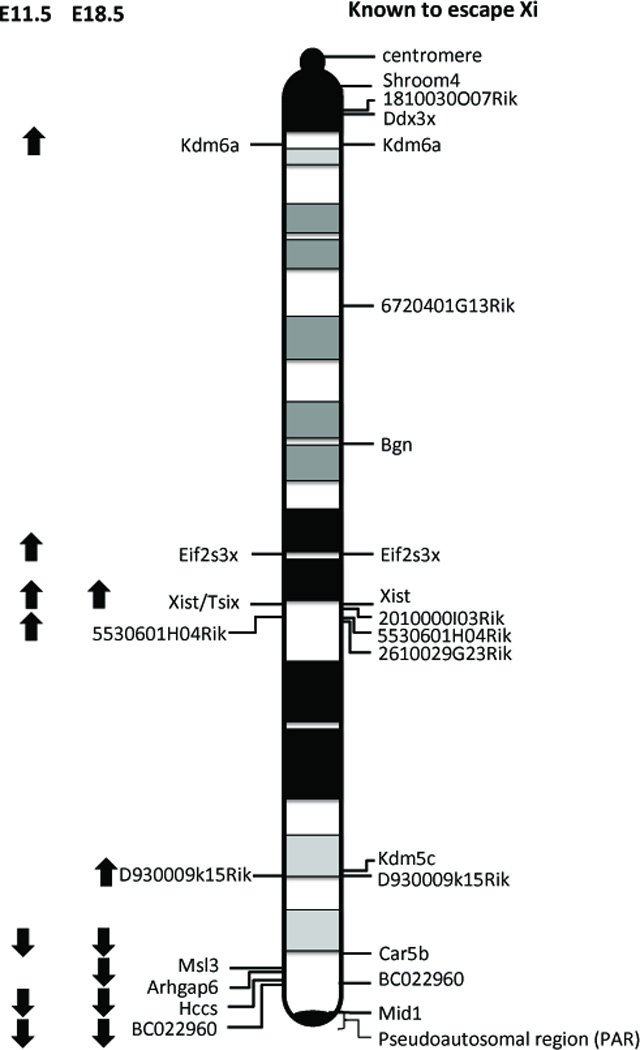
Transcripts significantly altered in 1X vs. 2X mice at embryonic day 11.5 and 18.5 as described. Up arrows indicate gene expression levels are higher in 2X mice versus 1X mice and escape X-inactivation. Down arrows indicate decreased gene expression in 2X vs. 1X mice. On the right of the schematic, we show the name and location of genes previously reported to escape X-inactivation (Reinius et al. 2010; Yang et al. 2010).
Differential gene expression in mice with one versus two X-chromosomes following gonadal differentiation
When comparing gene expression profiles of whole brains at E18.5, XY*X and XX females, had 32 unique transcripts that were significantly different. A majority of these genes reside on autosomes (21 transcripts out of 32). Of the differentially expressed X-linked genes, Xist and Tsix, as expected had much higher expression in tissues with two X-chromosomes (Figure 2). Genes located on the distal tip of the X-chromosome, Msl3, BC022960, Arhgap6 and Hccs had higher expression in XY*X and XY* mice versus XX and XXY* mice (Table 3 and Figure 3). Many of the autosomal genes affected by X-chromosome number, in females, can be divided into three main categories: neurogenesis and neuronal differentiation, G-protein mediated cell signaling, and genes associated with mood disorders. Four genes were consistently increased in XY*X females including a kinase, double-cortin like kinase (Dclk1) and a calmodulin regulator cAMP regulated phosphoprotein (Arpp21). Both play a role in neuronal migration and neurogenesis. The ionotropic AMPA glutamate receptor (Grik2) and neuronal leucine rich repeat transmembrane 2 (Lrrtm2) which regulates the surface expression of AMPA, were also higher in XY*X females. Four genes may play a role in schizophrenia and bipolar disorders; serotonin receptor 3 (Htr3a), transcription factor cut-like 2 (Cux2), a phosphodiesterase (Pde10a), and a nuclear hormone receptor (Rorb). A final category of genes significantly affected by X-chromosome number in females included genes involved in G protein coupled signaling such as the catalytic subunit of PI3 kinase (Pik3c), membrane associated guanylate kinase (Magi1), an uncharacterized G-protein (Gpr151), and regulator of G-protein signaling binding protein (Rgs7bp).
In the male XY* vs. XXY* comparison at E18.5, 9 genes were differentially expressed, similar to the E11.5 comparison where 16 genes were changed prior to the onset of gonad development. Of these 9 transcripts, five genes reside on the X-chromosome (Xist, Msl3, Tsix, B022960, and Hccs). These same genes were affected by X-chromosome number in females (XX and XY*X). In addition, two genes that reside on the Y chromosome, ubiquitin activating enzyme E1 (Ube1y1) and an uncharacterized cDNA clone, 4933439C20Rik, were different in the male comparison. One autosomal gene, DEAD box polypeptide 4 (Ddx4) that in the gonad plays a role in germ cell development and sperm motility was higher in XY* versus XXY* males. However, Ube1y1 is increased 3-fold in XXY* males while Ddx4 is decreased 1.5-fold. Further studies examining the actions of these genes in the brain are needed to understand these findings.
Overview of gene expression differences between ages and genotypes
As shown in Figure 1, on the order of half the genes in the genome (i.e., ~15,000 probe sets) were differentially expressed on the development scale between E11.5 to E18.5 for each genotype. We observed about twice the number of differentially expressed genes between females (54 total) with the same number of X-chromosomes as compared to males (22 total). Because development had a larger effect on gene expression profiles than genotype, a principle component plot using all probe sets only revealed differences between the ages (data not shown). Therefore, we generated a principle component plot using the expression profiles of only X- and Y-chromosome genes (Supplemental Figure 1). As expected, the individual biological replicates grouped together. Of note, XX females and XY* males, cluster together while XY*X females and XXY* males are the furthest apart. Perhaps this is due to gene expression programs evolving to reduce the differences between males and females on the sex chromosomes. Finally, we observed higher variability in the E11.5 tissue as compared to the E18.5 brains. This may be due to differences in the source of the tissue, which could have introduced greater variability in the expression data from the E11.5 embryos.
Confirmation of selected genes by RT qPCR
Microarray data were confirmed by quantitative RT PCR for several genes at both embryonic ages (Figures 2 and 3). In the microarray analysis, Xist mRNA expression was assessed by three different probe sets. Fold change differences between mice with one or two X-chromosomes ranged from 67 to more than 500 depending on the probe set, age and comparison (Table 3 and Supplemental Table 2). Using quantitative PCR on cDNA, we observed a similar range of 59 to 158-fold increase in Xist transcript in mice with two X-chromosomes at both developmental ages. Although, Eif2s3x and Kdm5c have been reported to escape X-inactivation, only Eif2s3x was significant for each comparison in the microarray analysis. Using qPCR, however, Eif2s3x and Kdm5c were significantly increased in 2X mice compared to 1X for both sexes and ages (i.e., Eif2s3x fold increase between 1.4 and 1.7, and Kdm5c fold increase between 1.3 and 2.1 in mice with two X-chromosomes at both ages). Kdm6a was only significantly increased in the XX and XXY* E11.5 embryos in the microarray dataset, but using qPCR it was significantly elevated at both ages. Genes located on the distal tip of the X-chromosome, Msl3, Hccs and BC022960, were increased on average about two-fold in embryos with one X-chromosome. These genes are increased two-fold in the confirmatory qPCR as well.
Expression and copy number analysis of genes on the distal tip of the X-chromosome
In Drosophila, Msl-3 targets the DCC to the X-chromosome and is responsible for dosage compensation (Lucchesi 1998). Because the DCC deposits marks that lead to increased transcription of the X-chromosome in male Drosophila, we measured expression in adult brain for Msl3 and the other members of the complex to determine if the whole complex was elevated in XY*X and XY* mouse brain. The DCC is comprised of 5 proteins, Msl1, Msl2, Msl3, Mof and Mle; but mRNA of these transcripts was not significantly altered by sex or genotype (Figure 4).
Figure 4. Gene expression levels of the DCC complex in adult cerebellum.

Quantitative PCR of relative gene expression for A. male specific lethal 3, (Msl3), B. Relative copy number of genomic DNA for Msl3, C. male specific lethal 1 (Msl1), D. male specific lethal 2 (Msl2). E. dead box polypeptide 9 (Dhx9), F. Myst histone acetyltransferase 1 (Myst1). Expression is relative to peptidylprolyl isomerase B (Ppib) and normalized to XX females. * p<0.05 main effect of X-chromosome number.
Msl3 is present on the distal tip of the X-chromosome and lies very close to the region where X- and Y-chromosomes have a translocation event in the Y* mouse model (Eicher et al. 1991; Isles et al. 2004). Two nearby X-genes, holocytochrome c synthase (Hccs) and BC022960 , fit a similar profile for mRNA expression both in the microarray data and in confirming qPCR (Supplemental Table 2). In the Y* model, Hccs and BC022960 also lie within the small X-chromosome section on the Y* chromosome (Isles et al. 2004). BC022960 has previously been identified to escape X-inactivation. However, BC022960 shows expression levels two-fold higher in mice with only one vs. two X-chromosomes, obviously not fitting an X-inactivation escapee profile in the Y* model. Hccs has not previously been shown to be an X-inactivation escapee, and its relative transcript level changes are similar to that of BC022960 and Msl3.
Using genomic DNA from adult cerebellar tissue, we asked if copy number for Msl3, Hccs, and BC022960 was different in mice possessing one or two X-chromosomes. In normal C57BL/6 embryonic male and female brain tissue, which does not contain the unique Y* chromosome, we expected all three genes would be present in one copy in males and two copies in females. Indeed, the relative copy numbers of Msl3, Hccs, and BC022960 were twice as high in female C57BL/6 brains as compared to males (Supplemental Figure 3), as expected for genes residing on the X-chromosome.
The relative copy number of Msl3 was not different between any of the Y* genotypes (p>0.05), indicating two copies of Msl3 in mice with one complete X-chromosome (XX), and mice with one complete X-chromosome and an additional few X-genes attached to a portion of the PAR (XY*X). In the Y* mice, mRNA expression and copy number data strongly suggest that all three genes, Msl3, Hccs and BC022906 are present in equivalent amounts. One copy of each gene appears to be inactivated when two X-chromosomes are present (XX and XXY*). In the case of Y* mice with only one X-chromosome (XY* and XY*X), these genes are present in two copies, one on the X-chromosome and one on the Y* chromosome (see Figures 3 and 4). The copy on the Y* chromosome is not subjected to X-inactivation, leading to higher mRNA expression in mice with one X-chromosome.
Transcript levels of Mid1, which is located distal to Hccs, warrant further investigation since the levels are almost 50% higher in XY*x, XY* and XXY* brains compared to XX at E18.5, but are the same across all four genotypes at E11.5. Mid1 sits very close to the pseudo-autosomal region (PAR). At the regions interrogated by our probe sets, portions of Mid1 may not be present on the small X-chromosome section of the Y* chromosome, giving the observed expression levels.
Discussion
Sex chromosome complement modulates a variety of behaviors (Gatewood et al. 2006; Quinn et al. 2007; Gioiosa et al. 2008; Grgurevic et al. 2008; Park et al. 2008; Liu et al. 2010; Cox and Rissman 2011; Bonthuis et al. 2012; Grgurevic et al. 2012). Using the Y* mouse model, we identified genes that are sexually dimorphic and/or differed by X-chromosome number prior to and just after gonadal differentiation. Few autosomal genes were changed by X-chromosome dosage in males while 10 genes were altered in females. Following gonadal differentiation, many autosomal genes changed in females only. Three of these, Rorb, Cux2 and Htr3a have been associated with mood disorders (Niesler et al. 2001; Glaser et al. 2005; Mansour et al. 2009; McGrath et al. 2009; Gatt et al. 2010), while the remaining genes primarily function in G-protein signaling and neuronal development. These targets may contribute to the behavioral phenotypes previously described.
About 15% of human genes escape X-inactivation (Carrel and Willard 2005) and it is believed that this contributes to sexual dimorphism within the brain and behavior. In mice, far fewer genes escape X-inactivation. The largest lists catalogue 13 potential escapees (Lopes et al. 2010; Yang et al. 2010) and most studies consistently validate five (Reinius et al. 2010; Werler et al. 2011). Many X-escapees have a paralog on the Y-chromosome (Kdm5c-Kdm5d, Eif2s3x-Eif2s3y, and Kdm6a/Utx-Uty) that in theory could compensate for the inactivated copy (Xu and Disteche 2006). In Y* mice, regardless of age or X-chromosome complement, four Y-linked paralogs (Kdm5d, Eif2s3y, Uty and Ddx3y) were increased in males compared to females but were not differentially expressed in males at either age. Other X-inactivation escapees, such as Shroom4 and Car5b, do not have expressed Y-paralogs and expression differences between males and females may contribute to sexual dimorphism.
An earlier study examining sexually dimorphic gene expression (Dewing et al. 2003) reported 51 altered genes in CD-1 mouse heads prior to gonad differentiation. Of these only three X-linked genes, Xist, Eif2s3x, and Kdm6a were in our study and were elevated in mice with two X-chromosomes. Two Y-chromosome genes, Eif2s3y and Dby, were increased in CD-1 males; we replicated only Eif2s3y. None of the autosomal genes reported in Dewing et al. were replicated in our dataset. Experimental differences such as mouse strain, embryo ages and an older microarray design, could account for these discrepancies. More importantly, both studies confirm the potential for sex differences in neural development prior to gonadal differentiation.
Before gonadal differentiation, six transcripts known to escape X-inactivation were detected at higher levels in mice with two X-chromosomes; Xist, Kdm5c, Kdm6a, Eif2s3x, Tsix and one uncharacterized transcript, 5530601H04Rik. Following gonadal differentiation, only Xist and Tsix remained significantly different. If organizational gonadal hormones promote multiple changes in gene transcripts, this could result in region-specific changes in gene expression, reducing our power to detect genome-wide differences. Another limitation of our design is that we used whole head or brain and thus, we can only detect the most robust differences in gene expression (Reinius et al. 2010). Moreover, different regions in the developing brain may express different X-inactivation escaping genes (Xu et al. 2006) and/or steroid receptors that together create differential gene expression profiles in discrete brain regions. Additionally, E11.5 heads included various non-neural tissues whereas the E18.5 samples were brain only. Finally, the use of 2–4 samples per group may have limited our power to detect differentially expressed genes. Given these limitations, it is interesting that specific X-inactivation escaping genes are temporally segregated.
Three X-chromosome genes in our data set produce proteins that act on chromatin to regulate gene transcription. Two histone demethylases, Kdm5c and Kdm6a, escape X-inactivation and have Y-paralogs. Previous studies have suggested, as we do here, that Y-paralogs may not compensate for lower levels of transcript in 1X individuals (Xu et al. 2008; Xu et al. 2008). Msl3 acts within the DCC to upregulate transcription of the X-chromosome in male Drosophila (Lucchesi 1998). Paradoxically, few autosomal genes/potential targets were changed in any genotype. Given that these genes regulate transcription, are differentially expressed in 1X vs. 2X mice and are not compensated by Y-paralogs, we suggest that the complex in which each functions does not form (e.g., no DCC in mice) or that other mechanisms act in a compensatory manner.
In fact, X-chromosome dosage significantly altered expression of few genes in the Y* model. Less than 80 total transcripts were differentially expressed between mice with one or two X-chromosomes. Similarly, a study investigating sex differences in a cross between two inbred mouse strains (C57BL/6 and C3H) found that differences between sexually dimorphic genes were modest in brain (Yang et al. 2006). In the Four Core Genotype, a transgene for Sry has been inserted to rescue the spontaneous deletion of this Y-chromosome gene, and may modulate autosomal gene expression (Wijchers et al. 2010). In the Y* mouse, Sry is expressed from the endogenous gene in both male genotypes. Only three autosomal genes differed between XY* and XXY* males, raising the possibility that the presence of Sry affects expression of autosomal genes which are responding to one versus two copies of the X-chromosome. Alternatively, the lack of large perturbations in gene profiles could indicate that addition or deletion of sex chromosomes does not globally disrupt gene regulation. Importantly, gonadal hormones are also a likely factor since more autosomal genes were affected in E11.5 than E18.5 brains.
Expression of 3 genes, Msl3, Hccs and BC022960 was 2-fold higher in mice with one X-chromosome regardless of age. All three are located on the distal tip of the X-chromosome, near PAR and may be part of the X-chromosome region crossing over with the Y* chromosome. Hccs and BC022960 reside on the small Y*X and Y* chromosomes (Isles et al. 2004) which are not subject to X-inactivation (Davies et al. 2007). Msl3 was not previously reported to be on the Y*X chromosome (Burgoyne et al. 1998). Genomic DNA analysis confirmed that there are two copies of Msl3 in each genotype. One copy is silenced on the inactivated X-chromosome, which explains the 2-fold higher expression in mice with only one X-chromosome. Our data suggest that Msl3 resides on the Y*X chromosome, since it is present in two copies and there is no X-inactivated chromosome in 1X mice. Thus, higher expression of Msl3, Hccs, and BC022960 in the XY* and XY*X is likely unique to the Y* model due to the contribution of the few near-PAR X-chromosome genes involved in the translocation.
Msl3 is of particular interest because it is known to participate in the DCC, a complex responsible for dosage compensation in Drosophila. Male flies never have more than one X-chromosome. To compensate, X-genes are increased two-fold by the DCC (Akhtar and Becker 2000; Smith et al. 2000). The DCC is comprised of 5 proteins: Msl1, Msl2, Msl3, Mof and Mle (Lucchesi 1998). Notably, mice lack roX1 and roX2—two noncoding RNAs that target the complex to chromatin (Alekseyenko et al. 2008). None of the other members of the mammalian complex (Msl1, Msl2, Mof and Mle) were significantly affected by sex or genotype. Thus, we do not expect increased Msl3 levels to have an effect on X-chromosome expression in 1X mice, consistent with our analysis.
Behavioral differences between animals with one versus two X-chromosomes have been found in Y* mice. An extra X-chromosome in adult males tends to increase aggression and in mating tests XXY* mice are significantly faster to display most aspects of male sexual behavior (Bonthuis et al. 2012). In a novel object recognition task, XXY* mice fail to discriminate (Lewejohann et al. 2009). We observed few genes to be differentially regulated between XY* and XXY* males at either age of development (i.e., only X-escapees and near-PAR X-chromosome genes). Several limitations of our study may account for this lack of robust differences. For example, whole head or whole brain was used for gene expression analysis that would preclude detection of difference in specific brain regions. Also, the ages used to measure gene expression may not be pertinent to these adult behaviors.
Female mice with only one X-chromosome are more anxious than normal females with two X-chromsomes (Isles et al. 2004). Our gene profiling identified a few autosomal genes (Nptx2, Nedd9, Rorb, Cux2 and Htr3a; all genes involved in neuronal development or associated with neurological disease) that were differentially expressed between XY*X and XX female embryos; these might be, at least in part, responsible for the differences in adult behavior. Prior to gonadal differentiation, genes altered by sex chromosome number in females are involved in neuronal differentiation and migration. It is reasonable to presume that these genes play a role in brain organization. Following the onset of gonadal differentiation, three main classes of genes are altered in females: genes involved in G-protein coupled signaling, neurogenesis and mood disorders. All of these observed changes occur prior to activational hormones at puberty. Together, these findings add to the theory that sex chromosomes contribute to brain organization and could ultimately lead to changes in social, cognitive and sexual behavior.
Supplementary Material
Acknowledgements
We thank Aileen Ryalls and Savera Shetty for technical assistance. We would also like to thank two reviewers for significantly improving this manuscript. This work was supported by NIMH R01 MH057759. JTW is supported by F32 ES019404.
References
- Akhtar A, Becker PB. Activation of transcription through histone h4 acetylation by mof an acetyltransferase essential for dosage compensation in drosophila. Mol Cell. 2000;5(2):367–375. doi: 10.1016/s1097-2765(00)80431-1. [DOI] [PubMed] [Google Scholar]
- Alekseyenko AA, Peng S, Larschan E, Gorchakov AA, Lee OK, Kharchenko P, McGrath SD, Wang CI, Mardis ER, Park PJ, Kuroda MI. A sequence motif within chromatin entry sites directs msl establishment on the drosophila x chromosome. Cell. 2008;134(4):599–609. doi: 10.1016/j.cell.2008.06.033. [DOI] [PMC free article] [PubMed] [Google Scholar]
- Arnold AP. Mouse models for evaluating sex chromosome effects that cause sex differences in non-gonadal tissues. J Neuroendocrinol. 2009;21(4):377–386. doi: 10.1111/j.1365-2826.2009.01831.x. [DOI] [PMC free article] [PubMed] [Google Scholar]
- Benjamini Y, Hochberg Y. Controlling the false discovery rate - a practical and powerful approach to multiple testing. J Roy Stat Soc B Met. 1995;57(1):289–300. [Google Scholar]
- Bonthuis PJ, Cox KH, Rissman EF. X-chromosome dosage affects male sexual behavior. Horm Behav. 2012;61(4):565–572. doi: 10.1016/j.yhbeh.2012.02.003. [DOI] [PMC free article] [PubMed] [Google Scholar]
- Budefeld T, Tobet SA, Majdic G. Steroidogenic factor 1 and the central nervous system. J Neuroendocrinol. 2012;24(1):225–235. doi: 10.1111/j.1365-2826.2011.02174.x. [DOI] [PubMed] [Google Scholar]
- Burgoyne PS, Mahadevaiah SK, Perry J, Palmer SJ, Ashworth A. The y* rearrangement in mice: New insights into a perplexing par. Cytogenet Cell Genet. 1998;80(1–4):37–40. doi: 10.1159/000014954. [DOI] [PubMed] [Google Scholar]
- Carrel L, Willard HF. X-inactivation profile reveals extensive variability in x-linked gene expression in females. Nature. 2005;434(7031):400–404. doi: 10.1038/nature03479. [DOI] [PubMed] [Google Scholar]
- Conforto TL, Waxman DJ. Sex-specific mouse liver gene expression: Genome-wide analysis of developmental changes from pre-pubertal period to young adulthood. Biol Sex Differ. 2012;3:9. doi: 10.1186/2042-6410-3-9. [DOI] [PMC free article] [PubMed] [Google Scholar]
- Cox KH, Rissman EF. Sex differences in juvenile mouse social behavior are influenced by sex chromosomes and social context. Genes, brain, and behavior. 2011;10(4):465–472. doi: 10.1111/j.1601-183X.2011.00688.x. [DOI] [PMC free article] [PubMed] [Google Scholar]
- Davies W, Humby T, Isles AR, Burgoyne PS, Wilkinson LS. X-monosomy effects on visuospatial attention in mice: A candidate gene and implications for turner syndrome and attention deficit hyperactivity disorder. Biol Psychiatry. 2007;61(12):1351–1360. doi: 10.1016/j.biopsych.2006.08.011. [DOI] [PubMed] [Google Scholar]
- De Vries GJ, Rissman EF, Simerly RB, Yang LY, Scordalakes EM, Auger CJ, Swain A, Lovell-Badge R, Burgoyne PS, Arnold AP. A model system for study of sex chromosome effects on sexually dimorphic neural and behavioral traits. J Neurosci. 2002;22(20):9005–9014. doi: 10.1523/JNEUROSCI.22-20-09005.2002. [DOI] [PMC free article] [PubMed] [Google Scholar]
- Dewing P, Shi T, Horvath S, Vilain E. Sexually dimorphic gene expression in mouse brain precedes gonadal differentiation. Brain Res Mol Brain Res. 2003;118(1–2):82–90. doi: 10.1016/s0169-328x(03)00339-5. [DOI] [PubMed] [Google Scholar]
- Eicher EM, Hale DW, Hunt PA, Lee BK, Tucker PK, King TR, Eppig JT, Washburn LL. The mouse y* chromosome involves a complex rearrangement, including interstitial positioning of the pseudoautosomal region. Cytogenet Cell Genet. 1991;57(4):221–230. doi: 10.1159/000133152. [DOI] [PubMed] [Google Scholar]
- Eicher EM, Lee BK, Washburn LL, Hale DW, King TR. Telomere-related markers for the pseudoautosomal region of the mouse genome. Proc Natl Acad Sci U S A. 1992;89(6):2160–2164. doi: 10.1073/pnas.89.6.2160. [DOI] [PMC free article] [PubMed] [Google Scholar]
- Gatewood JD, Wills A, Shetty S, Xu J, Arnold AP, Burgoyne PS, Rissman EF. Sex chromosome complement and gonadal sex influence aggressive and parental behaviors in mice. J Neurosci. 2006;26(8):2335–2342. doi: 10.1523/JNEUROSCI.3743-05.2006. [DOI] [PMC free article] [PubMed] [Google Scholar]
- Gatt JM, Williams LM, Schofield PR, Dobson-Stone C, Paul RH, Grieve SM, Clark CR, Gordon E, Nemeroff CB. Impact of the htr3a gene with early life trauma on emotional brain networks and depressed mood. Depress Anxiety. 2010;27(8):752–759. doi: 10.1002/da.20726. [DOI] [PubMed] [Google Scholar]
- Gentleman R, Carey VJ, Huber W, Irizarry RA, Dudoit S. Bioinformatics and computational biology solutions using r and bioconductor. New York, NY: Springer Science + Business Media Inc.; 2005. [Google Scholar]
- Gioiosa L, Chen X, Watkins R, Umeda EA, Arnold AP. Sex chromosome complement affects nociception and analgesia in newborn mice. J Pain. 2008;9(10):962–969. doi: 10.1016/j.jpain.2008.06.001. [DOI] [PMC free article] [PubMed] [Google Scholar]
- Glaser B, Kirov G, Green E, Craddock N, Owen MJ. Linkage disequilibrium mapping of bipolar affective disorder at 12q23-q24 provides evidence for association at cux2 and flj32356. Am J Med Genet B Neuropsychiatr Genet. 2005;132B(1):38–45. doi: 10.1002/ajmg.b.30081. [DOI] [PubMed] [Google Scholar]
- Grgurevic N, Budefeld T, Rissman EF, Tobet SA, Majdic G. Aggressive behaviors in adult sf-1 knockout mice that are not exposed to gonadal steroids during development. Behav Neurosci. 2008;122(4):876–884. doi: 10.1037/0735-7044.122.4.876. [DOI] [PMC free article] [PubMed] [Google Scholar]
- Grgurevic N, Budefeld T, Spanic T, Tobet SA, Majdic G. Evidence that sex chromosome genes affect sexual differentiation of female sexual behavior. Horm Behav. 2012;61(5):719–724. doi: 10.1016/j.yhbeh.2012.03.008. [DOI] [PMC free article] [PubMed] [Google Scholar]
- Isles AR, Davies W, Burrmann D, Burgoyne PS, Wilkinson LS. Effects on fear reactivity in xo mice are due to haploinsufficiency of a non-par x gene: Implications for emotional function in turner's syndrome. Hum Mol Genet. 2004;13(17):1849–1855. doi: 10.1093/hmg/ddh203. [DOI] [PubMed] [Google Scholar]
- Koopman P, Munsterberg A, Capel B, Vivian N, Lovell-Badge R. Expression of a candidate sex-determining gene during mouse testis differentiation. Nature. 1990;348(6300):450–452. doi: 10.1038/348450a0. [DOI] [PubMed] [Google Scholar]
- Lewejohann L, Damm OS, Luetjens CM, Hamalainen T, Simoni M, Nieschlag E, Gromoll J, Wistuba J. Impaired recognition memory in male mice with a supernumerary x chromosome. Physiol Behav. 2009;96(1):23–29. doi: 10.1016/j.physbeh.2008.08.007. [DOI] [PubMed] [Google Scholar]
- Liu PY, Erkkila K, Lue Y, Jentsch JD, Schwarcz MD, Abuyounes D, Hikim AS, Wang C, Lee PW, Swerdloff RS. Genetic, hormonal, and metabolomic influences on social behavior and sex preference of xxy mice. Am J Physiol Endocrinol Metab. 2010;299(3):E446–E455. doi: 10.1152/ajpendo.00085.2010. [DOI] [PMC free article] [PubMed] [Google Scholar]
- Livak KJ, Schmittgen TD. Analysis of relative gene expression data using real-time quantitative pcr and the 2(-delta delta c(t)) method. Methods. 2001;25(4):402–408. doi: 10.1006/meth.2001.1262. [DOI] [PubMed] [Google Scholar]
- Lopes AM, Burgoyne PS, Ojarikre A, Bauer J, Sargent CA, Amorim A, Affara NA. Transcriptional changes in response to x chromosome dosage in the mouse: Implications for x inactivation and the molecular basis of turner syndrome. BMC Genomics. 2010;11:82. doi: 10.1186/1471-2164-11-82. [DOI] [PMC free article] [PubMed] [Google Scholar]
- Lucchesi JC. Dosage compensation in flies and worms: The ups and downs of x-chromosome regulation. Curr Opin Genet Dev. 1998;8(2):179–184. doi: 10.1016/s0959-437x(98)80139-1. [DOI] [PubMed] [Google Scholar]
- Majdic G, Tobet S. Cooperation of sex chromosomal genes and endocrine influences for hypothalamic sexual differentiation. Front Neuroendocrinol. 2011;32(2):137–145. doi: 10.1016/j.yfrne.2011.02.009. [DOI] [PMC free article] [PubMed] [Google Scholar]
- Mansour HA, Talkowski ME, Wood J, Chowdari KV, McClain L, Prasad K, Montrose D, Fagiolini A, Friedman ES, Allen MH, Bowden CL, Calabrese J, El-Mallakh RS, Escamilla M, Faraone SV, Fossey MD, Gyulai L, Loftis JM, Hauser P, Ketter TA, Marangell LB, Miklowitz DJ, Nierenberg AA, Patel J, Sachs GS, Sklar P, Smoller JW, Laird N, Keshavan M, Thase ME, Axelson D, Birmaher B, Lewis D, Monk T, Frank E, Kupfer DJ, Devlin B, Nimgaonkar VL. Association study of 21 circadian genes with bipolar i disorder, schizoaffective disorder, and schizophrenia. Bipolar Disord. 2009;11(7):701–710. doi: 10.1111/j.1399-5618.2009.00756.x. [DOI] [PMC free article] [PubMed] [Google Scholar]
- McGrath CL, Glatt SJ, Sklar P, Le-Niculescu H, Kuczenski R, Doyle AE, Biederman J, Mick E, Faraone SV, Niculescu AB, Tsuang MT. Evidence for genetic association of rorb with bipolar disorder. BMC Psychiatry. 2009;9:70. doi: 10.1186/1471-244X-9-70. [DOI] [PMC free article] [PubMed] [Google Scholar]
- Niesler B, Flohr T, Nothen MM, Fischer C, Rietschel M, Franzek E, Albus M, Propping P, Rappold GA. Association between the 5' utr variant c178t of the serotonin receptor gene htr3a and bipolar affective disorder. Pharmacogenetics. 2001;11(6):471–475. doi: 10.1097/00008571-200108000-00002. [DOI] [PubMed] [Google Scholar]
- Park JH, Burns-Cusato M, Dominguez-Salazar E, Riggan A, Shetty S, Arnold AP, Rissman EF. Effects of sex chromosome aneuploidy on male sexual behavior. Genes, brain, and behavior. 2008;7(6):609–617. doi: 10.1111/j.1601-183X.2008.00397.x. [DOI] [PMC free article] [PubMed] [Google Scholar]
- Phoenix CH, Goy RW, Gerall AA, Young WC. Organizing action of prenatally administered testosterone propionate on the tissues mediating mating behavior in the female guinea pig. Endocrinology. 1959;65:369–382. doi: 10.1210/endo-65-3-369. [DOI] [PubMed] [Google Scholar]
- Quinn JJ, Hitchcott PK, Umeda EA, Arnold AP, Taylor JR. Sex chromosome complement regulates habit formation. Nat Neurosci. 2007;10(11):1398–1400. doi: 10.1038/nn1994. [DOI] [PubMed] [Google Scholar]
- Reinius B, Shi C, Hengshuo L, Sandhu KS, Radomska KJ, Rosen GD, Lu L, Kullander K, Williams RW, Jazin E. Female-biased expression of long non-coding rnas in domains that escape x-inactivation in mouse. BMC Genomics. 2010;11:614. doi: 10.1186/1471-2164-11-614. [DOI] [PMC free article] [PubMed] [Google Scholar]
- Smith ER, Pannuti A, Gu W, Steurnagel A, Cook RG, Allis CD, Lucchesi JC. The drosophila msl complex acetylates histone h4 at lysine 16, a chromatin modification linked to dosage compensation. Mol Cell Biol. 2000;20(1):312–318. doi: 10.1128/mcb.20.1.312-318.2000. [DOI] [PMC free article] [PubMed] [Google Scholar]
- Smyth GK. Linear models and empirical bayes methods for assessing differential expression in microarray experiments. Stat Appl Genet Mol Biol. 2004;3 doi: 10.2202/1544-6115.1027. Article3. [DOI] [PubMed] [Google Scholar]
- Vazquez MD, Bouchet P, Foliguet B, Gerard H, Mallet JL, Leheup B. Differentiated aspect of female and male mouse mesonephroi. Int J Dev Biol. 1998;42(4):621–624. [PubMed] [Google Scholar]
- Vogel T, Ahrens S, Buttner N, Krieglstein K. Transforming growth factor beta promotes neuronal cell fate of mouse cortical and hippocampal progenitors in vitro and in vivo: Identification of nedd9 as an essential signaling component. Cereb Cortex. 2010;20(3):661–671. doi: 10.1093/cercor/bhp134. [DOI] [PMC free article] [PubMed] [Google Scholar]
- vom Saal FS. Sexual differentiation in litter-bearing mammals: Influence of sex of adjacent fetuses in utero. J Anim Sci. 1989;67(7):1824–1840. doi: 10.2527/jas1989.6771824x. [DOI] [PubMed] [Google Scholar]
- vom Saal FS, Bronson FH. Sexual characteristics of adult female mice are correlated with their blood testosterone levels during prenatal development. Science. 1980;208(4444):597–599. doi: 10.1126/science.7367881. [DOI] [PubMed] [Google Scholar]
- Werler S, Poplinski A, Gromoll J, Wistuba J. Expression of selected genes escaping from x inactivation in the 41, xx(y)* mouse model for klinefelter's syndrome. Acta Paediatr. 2011;100(6):885–891. doi: 10.1111/j.1651-2227.2010.02112.x. [DOI] [PubMed] [Google Scholar]
- Wijchers PJ, Yandim C, Panousopoulou E, Ahmad M, Harker N, Saveliev A, Burgoyne PS, Festenstein R. Sexual dimorphism in mammalian autosomal gene regulation is determined not only by sry but by sex chromosome complement as well. Dev Cell. 2010;19(3):477–484. doi: 10.1016/j.devcel.2010.08.005. [DOI] [PubMed] [Google Scholar]
- Xu J, Deng X, Disteche CM. Sex-specific expression of the x-linked histone demethylase gene jarid1c in brain. PLoS One. 2008;3(7):e2553. doi: 10.1371/journal.pone.0002553. [DOI] [PMC free article] [PubMed] [Google Scholar]
- Xu J, Deng X, Watkins R, Disteche CM. Sex-specific differences in expression of histone demethylases utx and uty in mouse brain and neurons. J Neurosci. 2008;28(17):4521–4527. doi: 10.1523/JNEUROSCI.5382-07.2008. [DOI] [PMC free article] [PubMed] [Google Scholar]
- Xu J, Disteche CM. Sex differences in brain expression of x- and y-linked genes. Brain Res. 2006;1126(1):50–55. doi: 10.1016/j.brainres.2006.08.049. [DOI] [PubMed] [Google Scholar]
- Xu J, Watkins R, Arnold AP. Sexually dimorphic expression of the x-linked gene eif2s3x mrna but not protein in mouse brain. Gene Expr Patterns. 2006;6(2):146–155. doi: 10.1016/j.modgep.2005.06.011. [DOI] [PubMed] [Google Scholar]
- Yang F, Babak T, Shendure J, Disteche CM. Global survey of escape from x inactivation by rna-sequencing in mouse. Genome Res. 2010;20(5):614–622. doi: 10.1101/gr.103200.109. [DOI] [PMC free article] [PubMed] [Google Scholar]
- Yang X, Schadt EE, Wang S, Wang H, Arnold AP, Ingram-Drake L, Drake TA, Lusis AJ. Tissue-specific expression and regulation of sexually dimorphic genes in mice. Genome Res. 2006;16(8):995–1004. doi: 10.1101/gr.5217506. [DOI] [PMC free article] [PubMed] [Google Scholar]
Associated Data
This section collects any data citations, data availability statements, or supplementary materials included in this article.