

Summary
Background
Multiple system atrophy (MSA) is a fatal and still poorly understood degenerative movement disorder that is characterised by autonomic failure, cerebellar ataxia, and parkinsonism in various combinations. Here we present the final analysis of a prospective multicentre study by the European MSA Study Group to investigate the natural history of MSA.
Methods
Patients with a clinical diagnosis of MSA were recruited and followed up clinically for 2 years. Vital status was ascertained 2 years after study completion. Disease progression was assessed using the unified MSA rating scale (UMSARS), a disease-specific questionnaire that enables the semiquantitative rating of autonomic and motor impairment in patients with MSA. Additional rating methods were applied to grade global disease severity, autonomic symptoms, and quality of life. Survival was calculated using a Kaplan-Meier analysis and predictors were identified in a Cox regression model. Group differences were analysed by parametric tests and non-parametric tests as appropriate. Sample size estimates were calculated using a paired two-group t test.
Findings
141 patients with moderately severe disease fulfilled the consensus criteria for MSA. Mean age at symptom onset was 56·2 (SD 8·4) years. Median survival from symptom onset as determined by Kaplan-Meier analysis was 9·8 years (95% CI 8·1–11·4). The parkinsonian variant of MSA (hazard ratio [HR] 2·08, 95% CI 1·09–3·97; p=0·026) and incomplete bladder emptying (HR 2·10, 1·02–4·30; p=0·044) predicted shorter survival. 24-month progression rates of UMSARS activities of daily living, motor examination, and total scores were 49% (9·4 [SD 5·9]), 74% (12·9 [8·5]), and 57% (21·9 [11·9]), respectively, relative to baseline scores. Autonomic symptom scores progressed throughout the follow-up. Shorter symptom duration at baseline (OR 0·68, 0·5–0·9; p=0·006) and absent levodopa response (OR 3·4, 1·1–10·2; p=0·03) predicted rapid UMSARS progression. Sample size estimation showed that an interventional trial with 258 patients (129 per group) would be able to detect a 30% effect size in 1-year UMSARS motor examination decline rates at 80% power.
Interpretation
Our prospective dataset provides new insights into the evolution of MSA based on a follow-up period that exceeds that of previous studies. It also represents a useful resource for patient counselling and planning of multicentre trials.
Funding
Fifth Framework Programme of the European Union, the Oesterreichische Nationalbank, and the Austrian Science Fund.
Introduction
Multiple system atrophy (MSA) is a rare but distinctive and fatal α-synucleinopathy characterised by autonomic failure, parkinsonism, cerebellar ataxia, and pyramidal signs in various combinations. These symptoms are the result of overlapping pathologies including striatonigral, olivopontocerebellar, and central autonomic degeneration.1, 2 Two phenotypes can be distinguished clinically by the predominant motor symptom: the parkinsonian variant (MSA-P) and the cerebellar variant (MSA-C).3 However, autonomic features can predate motor impairment.4, 5 Premotor MSA is increasingly recognised as a cluster of symptoms including not only progressive autonomic failure, but also sleep disorders such as rapid eye movement sleep behaviour disorder, central sleep apnoea, and stridor.6
With two exceptions that we are aware of,7, 8, 9 the natural history of MSA has been addressed only in single-centre clinical studies.10, 11 Additionally, disease progression and prognostic predictors have been investigated in retrospective clinicopathological series.4, 12, 13, 14, 15, 16 These studies found shorter survival in patients with early autonomic failure13, 15 and a more pronounced functional deterioration in patients with MSA-P than in patients with MSA-C.15 Rates of functional decline and their determinants were not established using validated disease-specific rating scales.4, 12, 13, 14, 15, 16 Recognising this unmet need, a consortium of dedicated MSA research groups (European MSA Study Group [EMSA-SG]) established a large patient registry,17 developed and validated an MSA-specific rating scale (unified MSA rating scale [UMSARS]),18 and launched a large prospective natural history study with 2 years of follow-up. With this study we aimed to address the following objectives: to determine prospectively clinical predictors of disease progression; to validate the disease-specific UMSARS18 longitudinally, thereby deriving rates of decline; to facilitate counselling of patients about disease stage (early or advanced disease) and milestones (such as falls or dysphagia); and to promote basic-research driven19, 20, 21, 22 clinical trial activity23, 24 within EMSA-SG or other related networks. Preliminary results in 50 patients were previously reported.25 Here we present the final results of the full analysis.
Methods
Study design and patients
15 EMSA-SG centres participated in this prospective natural history study. Recruitment lasted from January, 2003, to July, 2004. Study duration was 2 years with a follow-up every 6 months. Additionally, a vital status survey was done 2 years after the end of the study. Survival and UMSARS decline rates were predefined primary outcome measures. In a post-hoc analysis of UMSARS items, important preterminal clinical milestones as suggested by O'Sullivan and colleagues13 were probed. The study was approved by local ethics committees, and written informed consent was obtained from each patient.
All patients were interviewed and examined by board-certified neurologists from the study group who had experience in movement disorders; patients with a clinical diagnosis of MSA as judged by these neurologists were enrolled in the present study. The following features were considered as exclusion criteria: onset under 30 years of age, family history of a movement disorder, secondary cause of parkinsonism (by history or investigation), prominent slowing of vertical saccades, vertical supranuclear palsy (downward or upward gaze palsy), aphasia, alien limb syndrome, parietal dysfunction, generalised areflexia, and any condition which would make the patient, in the opinion of the treating investigator, unsuitable for an MSA natural history study. However, reasons to refrain from recruitment were not recorded systematically. The initial consensus criteria3 were subsequently applied to confine the analysed cohort to patients with MSA. At each study visit the EMSA-SG minimal dataset26 was used to document basic clinical features and diagnostic procedures as well as the current medication. Moreover, validated rating instruments were applied during the follow-up examination by the investigator, patient, or caregiver, as appropriate. Causes of death, MRI findings, and results from post-mortem examinations were not systematically recorded.
Symptom onset was defined as the initial presentation of any motor symptom (ie, parkinsonism or cerebellar ataxia) or selected autonomic features including orthostatic hypotension or neurogenic bladder disturbances (urge incontinence and incomplete bladder emptying). Absent levodopa response was defined as no clinical improvement on chronic treatment as judged by the treating investigator.
Rating scales
Overall disease severity was assessed by the Hoehn and Yahr Parkinson's disease staging scheme (range 1–5, with higher scores indicating greater impairment),27 the Schwab and England activities of daily living scale (range 0–100, with lower scores reflecting greater disease burden),28 and a three-point global disability scale (mild, moderate, severe).18 We assessed severity of clinical features using a disease specific rating scale (total UMSARS, with scores ranging from 0 to 104; higher scores indicate greater impairment) that includes autonomic symptoms (questions 9–12 of the UMSARS activities of daily living subscale [range 0–16]) and motor symptoms (questions 1–8 of the UMSARS activities of daily living subscale [range 0–32] and the UMSARS motor examination subscale, range 0–56), as well as their effect on activities of daily life (UMSARS activities of daily living subscale, range 0–48). Probability of clinical milestone events was estimated in a post-hoc analysis of UMSARS items 2 (swallowing) and 8 (falling) of the activities of daily living subscale and items 2 (speech) and 14 (gait) of the motor examination subscale. Health-related quality of life was assessed by the medical study short form (SF-36)29 and the five-dimensional EuroQoL (EQ-5D).30
Autonomic failure was assessed with the composite autonomic symptom scale (COMPASS)31 as well as the COMPASS change scale31 in a sub-protocol of the present study that was done in five EMSA-SG sites. The 6-month data for COMPASS decline rates have partly been published elsewhere.32 Here, we present the 24-month follow-up data.
Statistical analysis
Hardcopies of case report forms were returned to the study secretariat to ensure data quality. Any shortcoming was subsequently discussed by investigators through email conversations, telephone calls, and at annual EMSA-SG meetings. Data were entered into an ACCESS Database (Microsoft, Redmond, WA, USA) and analysed with SPSS 19.0 (SPSS, Chicago, IL, USA). Statistical analysis of disease progression was done for all patients for whom data for two UMSARS motor examination and activities of daily life assessments were available. Missing values of the two UMSARS subscales during the follow-up were estimated using linear interpolation of neighbouring measurements. Missing values of baseline and ultimate measurements in patients known to be alive were analogously extrapolated by using two succeeding or preceding measurements. The final rating score was calculated as sum of the two UMSARS subscale measurements per patient.
To validate the interpolation approach we undertook two sensitivity analyses. First, we did a complete-case per-protocol analysis to validate the results received by the linear interpolation procedure, and we compared observed (non-missing) and imputed values at each timepoint with the t test. Cases with missing observations, where the missing-at-random assumption came into question, were reviewed manually. Second, we estimated missing values of potential predicting variables for MSA progression using a fully conditional specification33 multiple imputation procedure assuming that those values were missing at random. The fully conditional specification procedure first substituted missing data of potential predictors by plausible values using an iterative stochastic algorithm, which results in ten multiple complemented replications of the original dataset. These datasets were then separately analysed with a logistic-regression model to obtain the estimates of interest. The estimates from these imputed datasets are then combined (pooled) into one overall estimate and variance, and then compared with the original dataset.
Progression of scores was defined as mean difference between baseline and follow-up values. Annualised slopes of change were presented as comparison of baseline values and the last follow-up examination available and expressed as score change per year. The following formula was used:
Gaussian distribution was confirmed by visual analysis of the Q-Q plots and the Kolmogorov–Smirnov test. With respect to the two distinct motor variants, two subgroups were formed. Time effects were analysed by repeated measures ANOVA. Group differences of normally distributed data were analysed by parametric tests (repeated measures ANOVA or Student's t test as applicable), non-Gaussian distributed variables by non-parametric tests (Kruskal–Wallis one-way ANOVA by ranks or Mann–Whitney U test as applicable), and distributional differences by the Pearson's χ2 test for independence. Logistic regression analysis was used to determine predictors of fast or slow motor progression. Consistent with Seppi and colleagues,10 the cutoff point between fast and slow progression was defined by the median value of annualised progression rates.
Survival from symptom onset was calculated using Kaplan-Meier analysis; covariates were compared with the log-rank test and Cox regression analysis. To reduce the number of censored observations, we surveyed vital status 24 months after study end. Patients lost to follow-up were censored at the last known date alive.
Clinical milestones of preterminal disease that were derived from previous clinicopathological studies13 were analysed by retrospective analysis of the UMSARS questionnaires. Each of the four clinical milestones were modelled as binary response variables during different time intervals (symptom onset to baseline visit, during first year of follow-up, and during second year of follow-up) applying a complementary log-log link function to estimate the probability of experiencing one of them.34 Events were defined as progression to the maximum score in the four UMSARS items (feeding by nasogastric tube or gastrostomy because of severe dysphagia, falls at least once a day, unintelligible speech, and the inability to walk).
Sample size estimates were done using two-group t test, accepting a two-sided type one error of 5%. The significance level was set at p<0·05.
Role of the funding source
Funds from the European Union supported the development of the study design, study conduct (patient recruitment, study visits), database development, and data collection. The Oesterreichische Nationalbank and Austrian Science Fund supported data analysis, data interpretation, and drafting of the manuscript. The sponsors had no role in the study design, data collection, data analysis, data interpretation, or writing of the report. The corresponding author had full access to all the data in the study and had final responsibility for the decision to submit for publication.
Results
151 consecutive eligible patients were initially recruited at the participating centres (figure 1). During the study period, the clinical diagnosis was revised in five cases, and further efforts to retrieve survival information in the post-study survival survey revealed another five misdiagnosed patients. These patients were reclassified during follow-up on the basis of changes in their clinical presentation. 79 (56%) of the remaining 141 patients were men and 62 (44%) were women. Mean age at symptom onset was 56·2 (SD 8·4) years; mean duration of symptoms at baseline was 5·5 (SD 3·8) years (table 1). These findings were not significantly different between MSA-C and MSA-P patients. According to consensus criteria,3 62% of the patients were classified as having MSA-P and 38% as having MSA-C. 32 patients (23%) fulfilled criteria for possible MSA (possible MSA-P 25%, possible MSA-C 19%) and 109 (77%) for probable MSA (probable MSA-P 75%, probable MSA-C 81%) according to the initial consensus criteria.3 Degree of diagnostic certainty did not differ between MSA-P and MSA-C (p=0·351). There were no sex differences between the two motor presentations (p=0·929).
Figure 1.
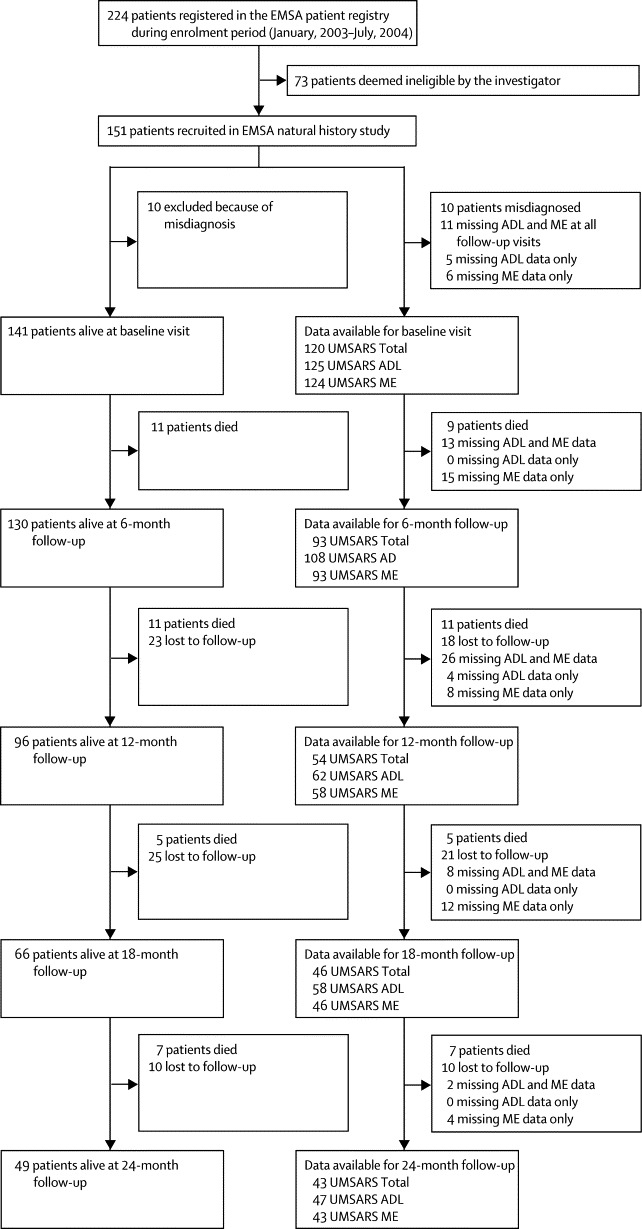
Study flow diagram
Data refer to non-interpolated case numbers. Thus, patients who had incomplete data at one assessment could be included again later. EMSA=European MSA Study Group. ADL=activities of daily living. ME=motor examination. UMSARS=unified MSA rating scale.
Table 1.
Population characteristics at baseline
| Overall | MSA-P | MSA-C | p | ||
|---|---|---|---|---|---|
| N (%) | 141 (100) | 87 (61·7) | 54 (38·3) | ||
| Diagnostic certainty | 0·351 | ||||
| Possible, n (%) | 32 (22·7) | 22 (25·3) | 10 (18·5) | ||
| Probable, n (%) | 109 (77·3) | 65 (74·7) | 44 (81·5) | ||
| Sex | 0·929 | ||||
| Women, n (%) | 62 (44) | 38 (44) | 24 (44) | ||
| Men, n (%) | 79 (56) | 49 (56) | 30 (56) | ||
| Age | |||||
| Study entry, years (mean [SD]) | 62·1 (7·7) | 62·6 (8·2) | 61·3 (7·1) | 0·367 | |
| Symptom onset, years (mean [SD]) | 56·2 (8·4) | 56·8 (9·0) | 55·4 (7·4) | 0·378 | |
| Duration of symptoms at entry, years (mean [SD]) | 5·5 (3·8) | 5·1 (3·7) | 6·1 (3·9) | 0·134 | |
| Global disability scale (mean [SD]) | 2·3 (0·7) | 2·3 (0·7) | 2·2 (0·7) | 0·388 | |
| Mild, n (%) | 17 (12·1) | 9 (10·3) | 8 (14·8) | ||
| Moderate, n (%) | 60 (42·6) | 33 (37·9) | 27 (50) | ||
| Severe, n (%) | 48 (34·0) | 30 (34·5) | 18 (33·3) | ||
| Missing values, n (%) | 16 (11·3) | 15 (17·2) | 1 (1·9) | ||
| Schwab and England activities of daily living (mean [SD]) | 48·9 (22·1) | 46·0 (22·2) | 52·8 (21·5) | 0·088 | |
| Hoehn and Yahr (mean [SD]) | 3·7 (1·0) | 3·7 (0·9) | 3·8 (1·1) | 0·431 | |
| Stage 0, n (%) | 1 (0·7) | 0 (0) | 1 (1·9) | ||
| Stage 1, n (%) | 2 (1·4) | 0 (0) | 2 (3·7) | ||
| Stage 2, n (%) | 6 (4·3) | 6 (6·9) | 0 (0) | ||
| Stage 3, n (%) | 46 (32·6) | 30 (34·5) | 16 (29·6) | ||
| Stage 4, n (%) | 41 (29·1) | 21 (24·1) | 20 (37·0) | ||
| Stage 5, n (%) | 32 (22·7) | 19 (21·8) | 13 (24·1) | ||
| Missing values, n (%) | 13 (9·2) | 11 (12·6) | 2 (3·7) | ||
| Autonomic failure, n (%) | 136 (96·5) | 84 (96·6) | 52 (96·3) | 0·936 | |
| Urinary incontinence, n (%) | 103 (73·0) | 66 (75·9) | 37 (68·5) | 0·241 | |
| Orthostatic hypotension, n (%) | 80 (56·7) | 51 (58·6) | 29 (53·7) | 0·341 | |
| Incomplete bladder emptying, n (%) | 72 (51·1) | 49 (56·3) | 23 (42·6) | 0·538 | |
| Constipation, n (%) | 82 (58·2) | 52 (59·8) | 30 (55·6) | 0·145 | |
| Parkinsonism, n (%) | 128 (90·8) | 87 (100·0) | 41 (75·9) | 0·0001 | |
| Bradykinesia, n (%) | 128 (90·8) | 87 (100·0) | 41 (75·9) | 0·0002 | |
| Rigidity, n (%) | 117 (83·0) | 88 (100·0) | 30 (55·6) | <0·0001 | |
| Postural instability, n (%) | 115 (81·6) | 75 (86·2) | 40 (74·1) | 0·607 | |
| Postural tremor, n (%) | 79 (56·0) | 55 (63·2) | 24 (44·4) | 0·090 | |
| Rest tremor, n (%) | 50 (35·5) | 35 (40·2) | 15 (27·8) | 0·243 | |
| Gait freezing, n (%) | 56 (39·7) | 45 (51·7) | 11 (20·4) | <0·0001 | |
| Levodopa treatment | <0·0001 | ||||
| Yes, n (%) | 91 (64·5) | 71 (81·6) | 20 (37·0) | ||
| No, n (%) | 44 (31·2) | 12 (13·8) | 32 (59·3) | ||
| Unknown, n (%) | 6 (4·3) | 4 (4·6) | 2 (3·7) | ||
| Dopamine agonist treatment | 0·012 | ||||
| Yes, n (%) | 31 (22·0) | 24 (27·6) | 7 (13·0) | ||
| No, n (%) | 91 (64·5) | 47 (54·0) | 44 (81·5) | ||
| Unknown, n (%) | 19 (13·5) | 16 (18·4) | 3 (5·6) | ||
| Levodopa response | |||||
| Beneficial response, n (%) | 44 (31·2) | 37 (42·5) | 7 (13·0) | 0·086 | |
| Response duration, years (mean [SD]) | 3·5 (2·7) | 3·5 (2·7) | 3·3 (2·7) | 0·908 | |
| Cerebellar symptoms, n (%) | 101 (71·6) | 47 (54·0) | 54 (100·0) | <0·0001 | |
| Gait ataxia, n (%) | 87 (61·7) | 35 (40·2) | 52 (96·3) | <0·0001 | |
| Limb ataxia, n (%) | 79 (56·0) | 31 (35·6) | 48 (88·9) | <0·0001 | |
| Ataxic dysarthria, n (%) | 77 (54·6) | 29 (33·3) | 48 (88·9) | <0·0001 | |
| Pyramidal involvement, n (%) | 70 (49·6) | 39 (44·8) | 31 (57·4) | 0·146 | |
| Babinski sign, n (%) | 38 (27·0) | 21 (24·1) | 17 (31·5) | 0·274 | |
| Hyper-reflexia, n (%) | 58 (41·1) | 31 (35·6) | 27 (50·0) | 0·076 | |
| Dystonia, n (%) | 43 (30·5) | 28 (32·2) | 15 (27·8) | 0·403 | |
47 (54%) patients with MSA-P had cerebellar symptoms, and 41 (76%) patients with MSA-C frequently showed parkinsonism. Symptoms of autonomic failure were present in most of the patients studied (136 [96%]). Urinary symptoms (124 patients [88%]) including urinary incontinence (103 [73%]) and incomplete bladder emptying (72 [51%]) combined were more common than orthostatic hypotension (80 [57%]). Irregular postural tremor of the outstretched arms was more common than resting tremor (56% vs 35%). A beneficial response to levodopa was reported in 31% lasting for a mean period of 3·5 years. Some of the patients with a beneficial levodopa response (44 patients, table 1) had motor complications, with wearing-off fluctuations (ten patients [23%]) and off-dystonia (nine [20%]) being the most common. On-off motor fluctuations (six patients [14%]) and peak-dose dyskinesias (five [11%]) were less frequently present. Further baseline characteristics of the study population are shown in table 1. Dynamics of characteristic motor features throughout the study period are listed in the appendix.
During the study period, including a stand-alone vital status survey 2 years after study end, we recorded 61 deaths in the study population of 141 patients. Neuropathological assessment confirmed the clinical diagnosis in two patients who underwent post-mortem verification. Overall, median survival from symptom onset as determined by Kaplan-Meier analysis was 9·8 years (95% CI 8·1–11·4). Univariable regression analysis adjusted for sex and age at symptom onset identified a diagnosis of MSA-P (hazard ratio [HR] 1·84, 95% CI 1·05–3·25, p=0·034), presence of urinary incontinence (2·45, 1·19–5·04, p=0·015), presence of incomplete bladder emptying (2·16, 1·08–4·34, p=0·030), presence of pyramidal signs (1·60, 0·92–2·79, p=0·099), presence of hyper-reflexia (2·62, 0·94–2·81, p=0·085), and higher baseline scores for the UMSARS activities of daily living subscale (1·04, 1·01–1·07, p=0·021) as predictors of shorter survival at p<0·1 (the cutoff criterion). Hyper-reflexia was excluded because of colinearity with pyramidal signs. All parameters with a p<0·1 in the univariable regression analysis were entered in a Cox regression model adjusted for age at symptom onset and sex, which identified a diagnosis of MSA-P (HR 2·08, 95% CI 1·09–3·97, p=0·026, figure 2) and the presence of incomplete bladder emptying (2·10, 1·02–4·30, p=0·044) as the strongest predictors of shorter survival.
Figure 2.
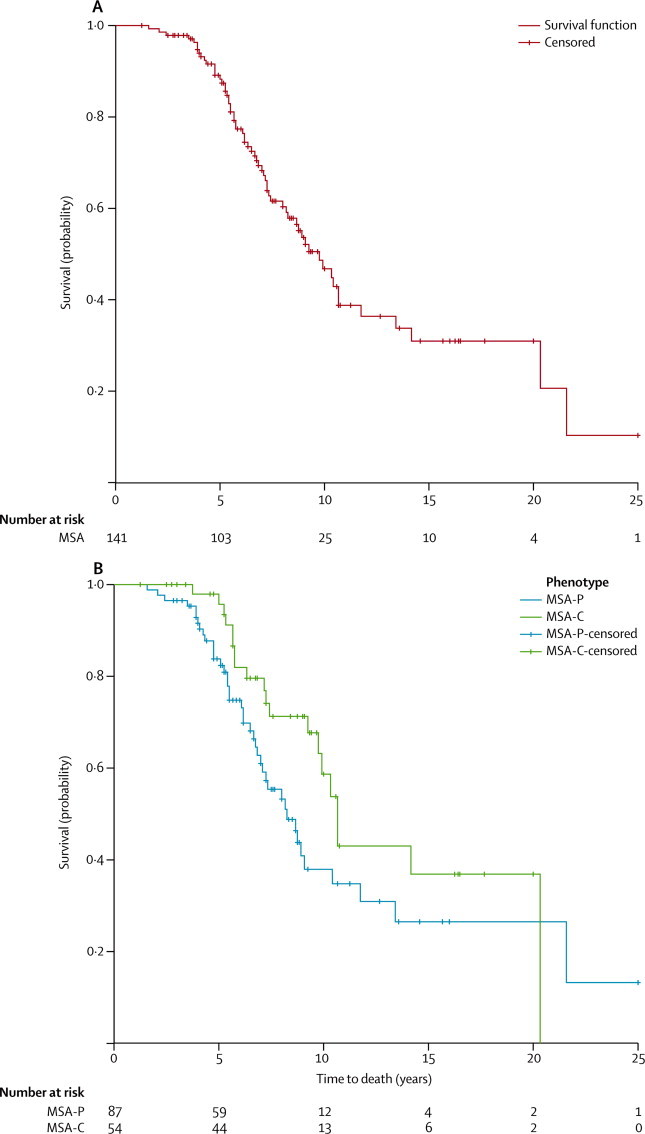
Kaplan-Meier survival plot
Overall survival analysis from symptom onset (A). Survival analysis stratified by phenotype (B).
An interval-censored survival model was applied to patients with milestone events (complete loss of function) at the beginning or during the study period. The estimated probabilities of clinical milestone events including falls at least once a day, wheelchair dependency, nasogastric tube placement or gastrostomy, and unintelligible speech are shown in table 2.
Table 2.
Estimated probability of clinical milestones
|
From symptom onset to baseline visit |
During first year of follow-up |
During second year of follow-up |
||||
|---|---|---|---|---|---|---|
| Number of events/patients at risk | Estimated probability (95% CI) of an event* | Number of events/patients at risk | Estimated probability (95% CI) of an event* | Number of events/patients at risk | Estimated probability (95% CI) of an event* | |
| Falls at least once a day | 34/105 | 23% (13·3– 40·0%)† | 11/42 | 21% (10·7–40·2%)† | 8/16 | 45% (20·4–98·4%)‡ |
| Feeding by nasogastric tube or gastrostomy | 3/83 | 3% (0·7–12·9%)† | 7/51 | 13% (4·5–38·0%)§ | 2/29 | 6% (1·4–30·0%)¶ |
| Unintelligible speech | 12/117 | 7% (3·2–15·9%)† | 11/59 | 13% (6·0–28·7%)† | 5/26 | 15% (5·3–39·9%)§ |
| Wheelchair dependency | 17/123 | 9% (4·3–18·4%)† | 11/59 | 13% (6·3–28·3%)† | 5/25 | 14% (5·2–37·9%)‖ |
Estimated probabilities of an event fitted by an interval-censored survival model applying a complementary log-log link function. p values are Wald-χ2.
p<0·0001.
p=0·046.
p=0·0002.
p=0·0005.
p=0·0001.
Progression rates are shown in table 3 and figure 3. First year progression rate for the UMSARS activities of daily living subscale was 32·3% (mean 6·5 points [SD 6·0]) and for the motor examination subscale was 44·9% (8·2 points [7·0]), relative to baseline. In the second year, we recorded attenuated UMSARS decline rates of 11·2% (2·9 points [SD 3·4]) on the activities of daily living subscale and 17·2% (5·0 points [5·4]) on the motor subscale, relative to 12-month scores. The repeated measures ANOVA involving UMSARS measurements at baseline, after 1 year, and at the end of the study yielded a significant time effect (p<0·0001) including a second-order term (p=0·002) confirming the second year attenuation. Overall 2-year progression rate for UMSARS activities of daily living, motor examination, and total scores were 49·0% (9·4 [SD 5·9]), 74·2% (12·9 [8·5]), and 57·3% (21·9 [11·9]), respectively, relative to baseline. The sensitivity complete-case per protocol analysis (appendix) confirmed the findings of the linear interpolation analysis. Additionally, we did not find any significant differences between observed (non-missing) and imputed values at each timepoint. In a univariable binary logistic regression analysis, symptom duration at baseline (OR1 year [OR for each additional year since symptom onset] 0·81, 95% CI 0·71–0·93, p=0·003), the absence of MSA-P (OR 0·51, 0·24–1·08, p=0·077), a beneficial levodopa response (2·52, 1·03–6·18, p=0·044), and the presence of sleep disturbances (1·92, 0·91–4·09, p=0·09) were found to be associated with slower disease progression (annualised progression rates below the median value) at p<0·1.
Table 3.
UMSARS score decline rates comparing follow-up versus baseline values
| Total | Activities of daily living | Motor examination | ||
|---|---|---|---|---|
| Baseline | ||||
| N | 126 | 127 | 129 | |
| Score, mean (SD) | 51·2 (17) | 25·2 (8·8) | 25·9 (9) | |
| Score, median | 49 | 25 | 25 | |
| 95% CI | 48·2–54·2 | 23·7–26·8 | 24·3–27·5 | |
| 6-month follow-up | ||||
| N | 103 | 111 | 105 | |
| Score, mean (SD) | 59·3 (17·7) | 28·4 (8·9) | 30·6 (9·5) | |
| Score, median | 59 | 28 | 29 | |
| 95% CI | 55·8–62·8 | 26·7–30 | 28·8–32·5 | |
| Score difference, mean (SD) | 9·2 (8·9) | 3·9 (4·6) | 5·3 (5·6) | |
| Score difference, median | 8 | 4 | 4 | |
| 95% CI | 7·5–11 | 3–4·8 | 4·2–6·4 | |
| Mean percent change | 22% | 19·1% | 28·2% | |
| 12-month follow-up | ||||
| N | 85 | 87 | 87 | |
| Score, mean (SD) | 64·7 (18·8) | 30·9 (9·5) | 33·7 (10) | |
| Score, median | 64 | 31 | 33 | |
| 95% CI | 60·6–68·7 | 28·9–32·9 | 31·6–35·8 | |
| Score difference, mean (SD) | 14·6 (11·8) | 6·5 (6) | 8·2 (7) | |
| Score difference, median | 12·5 | 5·5 | 7 | |
| 95% CI | 12·1–17·2 | 5·2–7·8 | 6·7–9·7 | |
| Mean percent change | 36·4% | 32·3% | 44·9% | |
| 18-month follow-up | ||||
| N | 64 | 65 | 64 | |
| Score, mean (SD) | 69·5 (17·1) | 33·3 (8·4) | 36·2 (9·9) | |
| Score, median | 68·5 | 32·3 | 36 | |
| 95% CI | 65·2–73·7 | 31·3–35·4 | 33·7–38·6 | |
| Score difference, mean (SD) | 19·9 (12·2) | 8·6 (5·9) | 11·4 (7·7) | |
| Score difference, median | 17·5 | 8 | 10 | |
| 95% CI | 16·9–22·9 | 7·1–10·1 | 9·5–13·3 | |
| Mean percent change | 51·2% | 44·3% | 63·3% | |
| 24-month follow-up | ||||
| N | 49 | 49 | 49 | |
| Score, mean (SD) | 69·5 (17·1) | 33·3 (8·2) | 36·6 (11) | |
| Score, median | 68 | 33 | 37 | |
| 95% CI | 64·6–74·5 | 31–35·7 | 33·4–39·7 | |
| Score difference, mean (SD) | 21·9 (11·9) | 9·4 (5·9) | 12·9 (8·5) | |
| Score difference, median | 20 | 9 | 12 | |
| 95% CI | 18·5–25·3 | 7·7–11·1 | 10·5–15·3 | |
| Mean percent change | 57·3% | 49% | 74·2% | |
Figure 3.
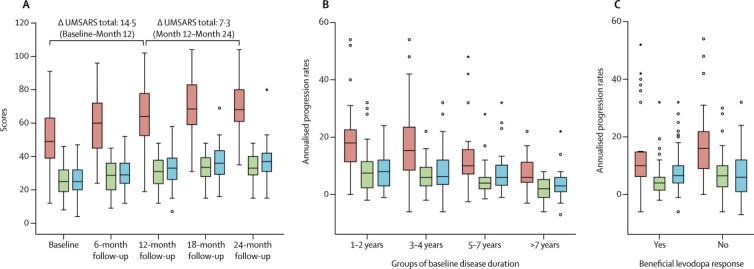
Unified MSA rating scale progression
Box plot of unified MSA rating scale (UMSARS) scores throughout the study period (A). Annualised progression rates stratified by categories of symptom duration (B). Annualised progression rates split by present or absent levodopa response (C). Red=UMSARS total. Green=UMSARS activities of daily living. Blue=UMSARS motor examination.
These parameters were entered in a multivariable binary logistic regression model adjusted for UMSARS baseline score and age at symptom onset, revealing that symptom duration at baseline (OR1 year 0·68, 95% CI 0·52–0·90, p=0·006) and an absent levodopa response (3·38, 1·12–10·22, p=0·03) were associated with rapid disease progression. Data for quality of life in patients with MSA are shown in the appendix. Subgroup analysis of 24-month follow-up data of the COMPASS change scale showed a continuous increase of self-perceived autonomic symptoms (appendix).
Required sample sizes for interventional trials with 1-year follow-up were estimated based on 12-month UMSARS total, motor examination, and activity decline rates. Estimated sample sizes per group to achieve 80% and 90% power with effect sizes ranging from 20% to 100% are shown in figure 4. For example, an interventional trial with 258 patients (129 per group) would be able to detect a 30% reduction in annual UMSARS motor examination decline rates at 80% power.
Figure 4.
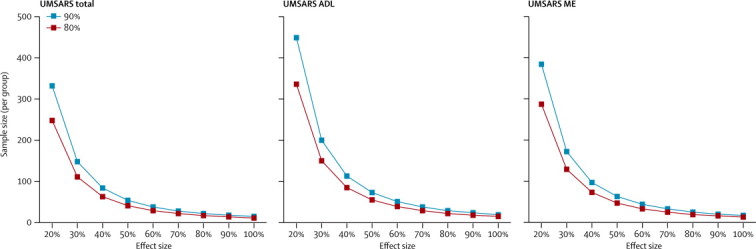
Sample size estimates
Required sample size per group for various effect sizes and different scores. ADL=activities of daily living. ME=motor examination.
Discussion
This multicentre prospective natural history study in a European cohort of MSA patients showed a reduced median survival of 9·8 years and rapid disease progression as determined by the UMSARS rating scale during an extended 24-month follow-up period. MSA-P and urinary retention were associated with poor survival. Accelerated UMSARS progression was predicted by shorter symptom duration at baseline and an absent levodopa response.
The clinical presentation of the present series corroborates: that MSA is a progressive and fatal disorder; that MSA-P is more common than MSA-C in Europe; that the motor disorder is often mixed, with cerebellar features in MSA-P and parkinsonian features in MSA-C; that MSA-P can mimic Parkinson's disease-like features, including a sustained levodopa response and levodopa-induced motor complications such as fluctuations and peak-dose dyskinesias, which could result in invasive therapies such as fetal mesencephalic grafts35 or deep brain stimulation with short-lived or absent benefit;36, 37, 38, 39, 40, 41 and that autonomic failure is a characteristic and common feature of both MSA motor subtypes. These observations are consistent with previously published cohorts.4, 7, 15, 16, 17, 42 However, most of these studies are limited by short follow-up periods and small case numbers.
Panel. Research in context.
Systematic review
We searched PubMed with the following search terms [(MSA OR “multiple system atrophy”) AND (progression OR survival)] for reports published before Oct 31, 2012. Only peer-reviewed, English language reports were considered. We included natural history studies reporting survival or disease progression as determined by semiquantitative rating scales. In our search we identified 11 observational studies.4, 7, 8, 9, 10, 11, 12, 14, 15, 16, 25
Interpretation
The natural history of MSA is still poorly understood. Our current knowledge is limited by the study design of published work, which includes retrospective case series with incomplete recordings of clinical features and single-centre studies that are limited by case numbers and only 12-month follow-up. The only multicentre prospective study we found7, 8 used a non-specific Parkinson plus scale that included features poorly reflective of MSA. The present multicentre study is the first natural history study that analyses survival and prognostic predictors in a large homogeneous cohort of European patients with MSA. It further reports semiquantitative decline rates using UMSARS, the only validated disease-specific rating scale available. Our findings suggest that disease progression slows down in the second year of follow-up, which is important to consider when embarking on therapeutic trials. We also provide the first evidence in a prospective European MSA cohort that baseline parkinsonism and neurogenic bladder disturbance are linked to poor survival. Further, a shorter baseline symptom duration and absent levodopa response proved to be independent predictors of faster UMSARS progression. These insights have important implications for patient counselling and planning of drug trials. Finally, our prospective dataset enables sample size calculations for future interventional trials. The reported example shows that MSA trials require large cohorts that can be generated only in a multicentre set-up based on international networks such as EMSA-SG.
The amount of progression is below the previously published intermediate analysis in a smaller subset of the present cohort.25 However, the present progression rates exceed previous observations by May and colleagues,9 who reported an increase of 17·2% within 12 months of follow-up, by roughly two-fold. This difference could be caused by more rapid decline early in the disease in the EMSA-SG cohort, reflecting a mixed study population of possible and probable cases with more rapid loss of greater baseline function during the first year, whereas the cohort of the North American study9 exclusively involved probable (ie, more advanced) MSA cases. This interpretation is further supported by attenuated progression rates in the second year of follow-up of the EMSA-SG cohort. Moreover, the present UMSARS decline rates are similar in magnitude to those for the united Parkinson's disease rating scale reported by Seppi and colleagues,10 showing an annual increase of 28·3% compared with baseline. A recent publication reported clinical progression using the Parkinson plus scale.8 Although direct comparison of the two scales is not possible, the ratio between annual slope of change and baseline score was similar in both studies. In summary, the variation in scale decline rates is likely to reflect both disease-related and scale-related factors. The rapid deterioration as shown by the UMSARS scores in our study was also mirrored by decline rates in both the Hoehn and Yahr scale and the Schwab and England activities of daily living scale. Remarkably, systolic blood pressure drop, as measured by part III of UMSARS, did not change significantly over time (data not shown), possibly as a result of adaptations in antiorthostatic hypotension therapy that were incompletely recorded. By contrast, COMPASS change scale scores that determine subjective impairment resulting from autonomic failure including orthostatic hypotension increased during follow-up in the present study. Mismatch between the objective presence of orthostatic hypotension and subjective impairment has long been recognised. In general, our COMPASS CSS data confirm previous studies,43, 44 including a preliminary 6-month follow-up report from the EMSA-SG32 demonstrating that MSA represents a progressive disorder that includes both autonomic and motor domains.
Shorter duration from symptom onset at baseline and an unsatisfactory levodopa response were shown to be the strongest predictors of a rapidly progressive disease course in the present study. These findings suggest that decline is more rapid in patients with greater functional reserve at baseline.25, 45, 46
In a previous clinicopathological study,13 four clinical milestones of advanced MSA were identified. In the current study, we estimated the probability of developing these milestones by retrospective analysis of selected UMSARS items and found that the likelihood of falling at least once a day increased with follow-up, particularly during the second year of follow-up. The probability of reaching the other milestones remained similar between years 1 and 2.
Previous studies indicate substantial impairment of health-related quality of life rating scales in early MSA.47, 48, 49, 50 Thus far, little was known about the progression of these scales over time. As expected, EQ-5D scores were already impaired at baseline. Nonetheless, a further decline in quality of life was observed in three out of five EQ-5D dimensions including mobility, self-care, and usual activities. Comparably, SF-36 items—particularly those requiring preserved motor function—showed progression to more severe impairment (appendix). The continuous clinical deterioration, indicated by the UMSARS motor and activities of daily living scores, supports the findings of May and colleagues,9 who state that UMSARS could serve as a favourable and disease-specific outcome measure in interventional trials. The number of patients with MSA we estimate to be needed was substantially lower than those in the reports by May and colleagues9 and Payan and colleagues,8 highlighting differences of patient cohorts and score variabilities.
Our study has some limitations. The patients were all drawn from highly specialised outpatient clinics lacking the random distribution of prospective population-based study designs. Moreover, restriction of data analysis to patients fulfilling diagnostic criteria resulted in a selection of patients with advanced MSA; thus, mild disease stages might be under-represented in the present study. 2 years of clinical follow-up might also be too short to identify the overall progression and prognosis of MSA. Patients were assembled at a mean (SD) symptom duration of 5·5 (3·8) years, indicating that 16·7% of patients had MSA-related symptoms for over 8 years. These findings suggest that the current study should not be interpreted as an inception-type cohort study. Thus, very early deaths—those happening within a few years of symptom onset, which are likely to be the more severe cases—might be under-represented. Patients were assessed on regular therapy; consequently, treatment effects, although unlikely, cannot be excluded. In the absence of post-mortem verification, misdiagnosis in some of the clinically diagnosed patients might occur. Likewise, MRI findings and causes of death were not predefined outcomes and, thus, were not systematically recorded, restricting conclusions drawn from the latter investigations. Attrition rates were considerable in our study. This was largely caused by death occurring during the study period and the inability of patients to attend study visits, reflecting the major challenge of avoiding dropout in prospective long-term MSA trials. Consequently, progression rates could have been affected by dropout of patients. Despite these limitations, this academically driven natural history study, involving 15 highly experienced study centres, defines the spectrum of disease courses in European patients with MSA. Our data suggest that both mild and severe forms of MSA exist. Future clinicopathological studies are needed to determine whether the neuropathological lesion distribution, load, and type differ in patients. Our study is also the first that we know of to prospectively apply UMSARS, a carefully validated rating scale, longitudinally over a period of 2 years in a large cohort. The observed clinical decline rates will facilitate planning of future interventional trials in patients with MSA.
Acknowledgments
Acknowledgments
We would like to thank all patients and families as well as referring physicians for their support. This study was supported by funds of the 5th Framework Programme of the European Community (QLK6-CT-2000-00661) and the Oesterreichische Nationalbank (Anniversary Fund, project number: 13946) and the Austrian Science Fund (FWF, F04404-B19).
Contributors
GKW and WP designed the study. All authors collected data and provided critical revision of manuscript. GKW, FK, KS, MK, GG, and KPP analysed the data. GKW, FK, KS, GG, KPP, and WP interpreted the data. GKW and FK did the literature search. FK was responsible for figures. GKW, FK, and MK drafted the manuscript. All authors approved the final version of the manuscript.
Conflicts of interest
KS has been on advisory boards for Novartis, GlaxoSmithKline (GSK), and Lundbeck, had consultancies with AstraZeneca and Teva, and received lecture fees from UCB, GSK, Boehringer Ingelheim, and Lundbeck. SB has been on advisory boards for Novartis, Cephalon, GSK, Lundbeck, Merz, and Allergan. PB has received honoraria from Merck Serono, Boehringer Ingelheim, and Novartis. WO has received honoraria for consultancy and for serving on scientific advisory boards, and travel support from UCB, honoraria for consultancy and lecture fees from Teva, Novartis, GSK, Boehringer Ingelheim, Orion Pharma, and Merck Serono. KME has had consultancies with Orion Pharma, Schwarz Pharma Neuroscience (UCB), Solvay Pharmaceuticals, Valeant Pharmaceuticals International, Desitin, Novartis), has been on advisory boards for Orion Pharma, Schwarz Pharma Neuroscience (UCB), Valeant Pharmaceuticals International, and Novartis, has received honoraria from Orion Pharma, Schwarz Pharma Neuroscience (UCB), Solvay Pharmaceuticals, Valeant Pharmaceuticals International, Desitin, Novartis, Boehringer Ingelheim, GlaxoSmithKline, Abbott, Meda Pharma, and Teva, and received grants from the German Ministry of Health, Pitzer foundation, and Rhon foundation. AA received honoraria from Merz, Ipsen, and TEVA pharmaceuticals. GD has received lecture fees from Orion, Lundbeck, Teva, and Pfizer, has been serving as a consultant for TEVA, has received royalties from Thieme Publishers, is a government employee, and receives funding for his research from the German Research Council, the German Ministry of Education and Health, and Medtronic. RDo is on advisory boards for Solvay, Affiris, GE Healthcare, Lilly, and Baxter, has consultancies with Octapharma, Lilly, Teva/Lundbeck, Pfizer, and Baxter, received grants from UKGM, ZLB Behring, CSL Behring, Behring-Röntgen Stiftung, Michael J Fox Foundation, Rentschler, Deutsche Parkinson Vereinigung, International Parkinson Fond, Faber Stiftung, Movement Disorder Society, Novartis, Hector-Stiftung, Alzheimer Forschung Initiative, DGSM, Lundbeck, Abbott, and Baxter, lecture fees from Boehringer Ingelheim, Novartis, Pfizer, Baxter, GSK, Lundbeck, Merz, Solvay, Eisai, Octapharma, Orion Pharma, UCB, CSL Behring, and Teva Pharma, and prepared manuscripts for Springer Verlag, Westermayer Verlag, Thieme Verlag, and Elsevier. TGa has received speaker's honoraria from Novartis, Merck-Serono, Schwarz Pharma, Boehringer Ingelheim, and Valeant Pharma, and consultancies for Cephalon and Merck-Serono. CK has received speaker's honoraria from Ipsen, UCB, Merz, and GSK, and travel grants from Ipsen and Merz Pharmaceuticals. OR has received scientific grant and consultancy fees from Abbott, Addex, Boehringer Ingelheim, Eisai, GSK, Impax Pharmaceuticals, Lundbeck, Merck Serono, Movement Disorders Society, Novartis, Oxford Biomedica, Schering-Plough, Servier, Teva Neuroscience, UCB, and XenoPort, academic support from France Parkinson, the Michael J Fox Foundation, the Movement Disorders Society, and the Programme Hospitalier de Recherche Clinique, has received consulting and advisory board membership with honoraria from Asubio, Campbell Alliance, CNS Therapeutics, Curry Rockefeller Group, Health Advances, Impax Pharmaceuticals, Ingenix, Juvantia Pharmaceuticals, Neurim Pharmaceuticals, Novartis Pharmaceuticals, Ono Pharmaceuticals, Oxford Biomedica, Santhera, Solvay Pharmaceuticals, United Biosource Corportation, and UCB, and grants and research funding from NIH and the Michael J Fox Foundation. WGM has received teaching honoraria and travel grants from Boehringer Ingelheim, GSK, Lundbeck, Novartis, TEVA, and UCB, research funding from the Michael J Fox Foundation, the University Hospital Bordeaux, the French Health Ministry, APTES (French patients association for essential tremor), and PSP-France, research grants from Novartis and TEVA/Lundbeck, and is an advisory board member of ANM GmbH. FT has received honoraria for consultancy from ADDEX Pharma, honoraria for serving on scientific advisory boards for Novartis, GSK, and Boehringer Ingelheim, lecture fees from Novartis, GSK, and UCB, travel grants from Novartis, Lundbeck, and UCB, and a research grant from the Michael J Fox Foundation. WP has had consultancies with AstraZeneca, Teva, Novartis, GSK, Boehringer Ingelheim, UCB, Orion Pharma, and Merck Serono, and received lecture fees from AstraZeneca, Teva, Novartis, GSK, Boehringer Ingelheim, UCB, Orion Pharma, and Merck Serono. GKW, FG, FK, SD, MK, GG, KPP, MTP, NPQ, VK, CJF, AS, CJM, NG, TGu, ED, KO, CFN, HW, FdS, ET, AC, HH, TK, CS, MC, RDj, EM, GM, and CC declare that they have no conflicts of interest.
Supplementary Material
References
- 1.Wenning GK, Colosimo C, Geser F, Poewe W. Multiple system atrophy. Lancet Neurol. 2004;3:93–103. doi: 10.1016/s1474-4422(03)00662-8. [DOI] [PubMed] [Google Scholar]
- 2.Quinn N. Multiple system atrophy—the nature of the beast. J Neurol Neurosurg Psychiatry. 1989;(suppl):78–89. doi: 10.1136/jnnp.52.suppl.78. [DOI] [PMC free article] [PubMed] [Google Scholar]
- 3.Gilman S, Low PA, Quinn N. Consensus statement on the diagnosis of multiple system atrophy. J Neurol Sci. 1999;163:94–98. doi: 10.1016/s0022-510x(98)00304-9. [DOI] [PubMed] [Google Scholar]
- 4.Wenning GK, Ben Shlomo Y, Magalhaes M, Daniel SE, Quinn NP. Clinical features and natural history of multiple system atrophy. An analysis of 100 cases. Brain. 1994;117:835–845. doi: 10.1093/brain/117.4.835. [DOI] [PubMed] [Google Scholar]
- 5.Colosimo C. Nonmotor presentations of multiple system atrophy. Nature Rev Neurol. 2011;7:295–298. doi: 10.1038/nrneurol.2011.5. [DOI] [PubMed] [Google Scholar]
- 6.Jecmenica-Lukic M, Poewe W, Tolosa E, Wenning GK. Premotor signs and symptoms of multiple system atrophy. Lancet Neurol. 2012;11:361–368. doi: 10.1016/S1474-4422(12)70022-4. [DOI] [PubMed] [Google Scholar]
- 7.Bensimon G, Ludolph A, Agid Y, Vidailhet M, Payan C, Leigh PN. Riluzole treatment, survival and diagnostic criteria in Parkinson plus disorders: the NNIPPS study. Brain. 2009;132:156–171. doi: 10.1093/brain/awn291. [DOI] [PMC free article] [PubMed] [Google Scholar]
- 8.Payan CA, Viallet F, Landwehrmeyer BG. Disease severity and progression in progressive supranuclear palsy and multiple system atrophy: validation of the NNIPPS—Parkinson Plus Scale. PLoS One. 2011;6:e22293. doi: 10.1371/journal.pone.0022293. [DOI] [PMC free article] [PubMed] [Google Scholar]
- 9.May S, Gilman S, Sowell BB. Potential outcome measures and trial design issues for multiple system atrophy. Mov Disord. 2007;22:2371–2377. doi: 10.1002/mds.21734. [DOI] [PubMed] [Google Scholar]
- 10.Seppi K, Yekhlef F, Diem A. Progression of parkinsonism in multiple system atrophy. J Neurol. 2005;252:91–96. doi: 10.1007/s00415-005-0617-2. [DOI] [PubMed] [Google Scholar]
- 11.Klockgether T, Ludtke R, Kramer B. The natural history of degenerative ataxia: a retrospective study in 466 patients. Brain. 1998;121:589–600. doi: 10.1093/brain/121.4.589. [DOI] [PubMed] [Google Scholar]
- 12.Muller J, Wenning GK, Jellinger K, McKee A, Poewe W, Litvan I. Progression of Hoehn and Yahr stages in Parkinsonian disorders: a clinicopathologic study. Neurology. 2000;55:888–891. doi: 10.1212/wnl.55.6.888. [DOI] [PubMed] [Google Scholar]
- 13.O'Sullivan SS, Massey LA, Williams DR. Clinical outcomes of progressive supranuclear palsy and multiple system atrophy. Brain. 2008;131:1362–1372. doi: 10.1093/brain/awn065. [DOI] [PubMed] [Google Scholar]
- 14.Schrag A, Wenning GK, Quinn N, Ben-Shlomo Y. Survival in multiple system atrophy. Mov Disord. 2008;23:294–296. doi: 10.1002/mds.21839. [DOI] [PubMed] [Google Scholar]
- 15.Watanabe H, Saito Y, Terao S. Progression and prognosis in multiple system atrophy: an analysis of 230 Japanese patients. Brain. 2002;125:1070–1083. doi: 10.1093/brain/awf117. [DOI] [PubMed] [Google Scholar]
- 16.Wenning GK, Tison F, Ben Shlomo Y, Daniel SE, Quinn NP. Multiple system atrophy: a review of 203 pathologically proven cases. Mov Disord. 1997;12:133–147. doi: 10.1002/mds.870120203. [DOI] [PubMed] [Google Scholar]
- 17.Kollensperger M, Geser F, Ndayisaba JP. Presentation, diagnosis, and management of multiple system atrophy in Europe: final analysis of the European multiple system atrophy registry. Mov Disord. 2010;25:2604–2612. doi: 10.1002/mds.23192. [DOI] [PubMed] [Google Scholar]
- 18.Wenning GK, Tison F, Seppi K. Development and validation of the Unified Multiple System Atrophy Rating Scale (UMSARS) Mov Disord. 2004;19:1391–1402. doi: 10.1002/mds.20255. [DOI] [PubMed] [Google Scholar]
- 19.Stefanova N, Poewe W, Wenning GK. Rasagiline is neuroprotective in a transgenic model of multiple system atrophy. Exp Neurol. 2008;210:421–427. doi: 10.1016/j.expneurol.2007.11.022. [DOI] [PubMed] [Google Scholar]
- 20.Stefanova N, Reindl M, Neumann M, Kahle PJ, Poewe W, Wenning GK. Microglial activation mediates neurodegeneration related to oligodendroglial alpha-synucleinopathy: implications for multiple system atrophy. Mov Disord. 2007;22:2196–2203. doi: 10.1002/mds.21671. [DOI] [PubMed] [Google Scholar]
- 21.Ubhi K, Rockenstein E, Mante M. Rifampicin reduces alpha-synuclein in a transgenic mouse model of multiple system atrophy. Neuroreport. 2008;19:1271–1276. doi: 10.1097/WNR.0b013e32830b3661. [DOI] [PMC free article] [PubMed] [Google Scholar]
- 22.Wenning GK, Stefanova N. Recent developments in multiple system atrophy. J Neurol. 2009;256:1791–1808. doi: 10.1007/s00415-009-5173-8. [DOI] [PubMed] [Google Scholar]
- 23.Dodel R, Spottke A, Gerhard A. Minocycline 1-year therapy in multiple-system-atrophy: effect on clinical symptoms and [(11)C] (R)-PK11195 PET (MEMSA-trial) Mov Disord. 2010;25:97–107. doi: 10.1002/mds.22732. [DOI] [PubMed] [Google Scholar]
- 24.Holmberg B, Johansson JO, Poewe W. Safety and tolerability of growth hormone therapy in multiple system atrophy: a double-blind, placebo-controlled study. Mov Disord. 2007;22:1138–1144. doi: 10.1002/mds.21501. [DOI] [PubMed] [Google Scholar]
- 25.Geser F, Wenning GK, Seppi K. Progression of multiple system atrophy (MSA): a prospective natural history study by the European MSA Study Group (EMSA SG) Mov Disord. 2006;21:179–186. doi: 10.1002/mds.20678. [DOI] [PubMed] [Google Scholar]
- 26.Geser F, Seppi K, Stampfer-Kountchev M. The European Multiple System Atrophy-Study Group (EMSA-SG) J Neural Transm. 2005;112:1677–1686. doi: 10.1007/s00702-005-0328-y. [DOI] [PubMed] [Google Scholar]
- 27.Hoehn MM, Yahr MD. Parkinsonism: onset, progression and mortality. Neurology. 1967;17:427–442. doi: 10.1212/wnl.17.5.427. [DOI] [PubMed] [Google Scholar]
- 28.Schwab RS, England AC. In: Third Symposium on Parkinson's Disease. Gillingham FJ, Donaldson IML, editors. Livingstone; Edinburgh: 1969. Projection technique for evaluating surgery in Parkinson's disease; pp. 152–157. [Google Scholar]
- 29.Ware JE, Jr, Sherbourne CD. The MOS 36-item short-form health survey (SF-36). I. Conceptual framework and item selection. Med Care. 1992;30:473–483. [PubMed] [Google Scholar]
- 30.Group TE. EuroQol-a new facility for the measurement of health-related quality of life. Health Policy. 1990;16:199–208. doi: 10.1016/0168-8510(90)90421-9. [DOI] [PubMed] [Google Scholar]
- 31.Suarez GA, Opfer-Gehrking TL, Offord KP, Atkinson EJ, O'Brien PC, Low PA. The Autonomic Symptom Profile: a new instrument to assess autonomic symptoms. Neurology. 1999;52:523–528. doi: 10.1212/wnl.52.3.523. [DOI] [PubMed] [Google Scholar]
- 32.Kollensperger M, Stampfer-Kountchev M, Seppi K. Progression of dysautonomia in multiple system atrophy: a prospective study of self-perceived impairment. Eur J Neurol. 2007;14:66–72. doi: 10.1111/j.1468-1331.2006.01554.x. [DOI] [PubMed] [Google Scholar]
- 33.van Buuren S. Multiple imputation of discrete and continuous data by fully conditional specification. Stat Methods Med Res. 2007;16:219–242. doi: 10.1177/0962280206074463. [DOI] [PubMed] [Google Scholar]
- 34.Collett D. Modelling survival data in medical research. second edn. Chapman & Hall; 2003. [Google Scholar]
- 35.Spencer DD, Robbins RJ, Naftolin F. Unilateral transplantation of human fetal mesencephalic tissue into the caudate nucleus of patients with Parkinson's disease. N Engl J Med. 1992;327:1541–1548. doi: 10.1056/NEJM199211263272201. [DOI] [PubMed] [Google Scholar]
- 36.Ullman M, Vedam-Mai V, Resnick AS. Deep brain stimulation response in pathologically confirmed cases of multiple system atrophy. Parkinsonism Relat Disord. 2012;18:86–88. doi: 10.1016/j.parkreldis.2011.09.008. [DOI] [PMC free article] [PubMed] [Google Scholar]
- 37.Berciano J, Valldeoriola F, Ferrer I. Presynaptic parkinsonism in multiple system atrophy mimicking Parkinson's disease: a clinicopathological case study. Mov Disord. 2002;17:812–816. doi: 10.1002/mds.10190. [DOI] [PubMed] [Google Scholar]
- 38.Tarsy D, Apetauerova D, Ryan P, Norregaard T. Adverse effects of subthalamic nucleus DBS in a patient with multiple system atrophy. Neurology. 2003;61:247–249. doi: 10.1212/01.wnl.0000073986.74883.36. [DOI] [PubMed] [Google Scholar]
- 39.Lezcano E, Gomez-Esteban JC, Zarranz JJ. Parkinson's disease-like presentation of multiple system atrophy with poor response to STN stimulation: a clinicopathological case report. Mov Disord. 2004;19:973–977. doi: 10.1002/mds.20108. [DOI] [PubMed] [Google Scholar]
- 40.Talmant V, Esposito P, Stilhart B, Mohr M, Tranchant C. Subthalamic stimulation in a patient with multiple system atrophy: a clinicopathological report. Rev Neurol. 2006;162:363–370. doi: 10.1016/s0035-3787(06)75023-8. (in French). [DOI] [PubMed] [Google Scholar]
- 41.Chou KL, Forman MS, Trojanowski JQ, Hurtig HI, Baltuch GH. Subthalamic nucleus deep brain stimulation in a patient with levodopa-responsive multiple system atrophy. Case report. J Neurosurg. 2004;100:553–556. doi: 10.3171/jns.2004.100.3.0553. [DOI] [PubMed] [Google Scholar]
- 42.Schulz JB, Klockgether T, Petersen D. Multiple system atrophy: natural history, MRI morphology, and dopamine receptor imaging with 123IBZM-SPECT. J Neurol Neurosurg Psychiatry. 1994;57:1047–1056. doi: 10.1136/jnnp.57.9.1047. [DOI] [PMC free article] [PubMed] [Google Scholar]
- 43.Lipp A, Sandroni P, Ahlskog JE. Prospective differentiation of multiple system atrophy from Parkinson disease, with and without autonomic failure. Arch Neurol. 2009;66:742–750. doi: 10.1001/archneurol.2009.71. [DOI] [PMC free article] [PubMed] [Google Scholar]
- 44.Iodice V, Lipp A, Ahlskog JE. Autopsy confirmed multiple system atrophy cases: Mayo experience and role of autonomic function tests. J Neurol Neurosurg Psychiatry. 2012;83:453–459. doi: 10.1136/jnnp-2011-301068. [DOI] [PMC free article] [PubMed] [Google Scholar]
- 45.Lee CS, Schulzer M, Mak EK. Clinical observations on the rate of progression of idiopathic parkinsonism. Brain. 1994;117:501–507. doi: 10.1093/brain/117.3.501. [DOI] [PubMed] [Google Scholar]
- 46.Poewe WH, Wenning GK. The natural history of Parkinson's disease. Ann Neurol. 1998;44(3 Suppl 1):S1–S9. doi: 10.1002/ana.410440703. [DOI] [PubMed] [Google Scholar]
- 47.Schrag A, Geser F, Stampfer-Kountchev M. Health-related quality of life in multiple system atrophy. Mov Disord. 2006;21:809–815. doi: 10.1002/mds.20808. [DOI] [PubMed] [Google Scholar]
- 48.Schrag A, Selai C, Mathias C. Measuring health-related quality of life in MSA: the MSA-QoL. Mov Disord. 2007;22:2332–2338. doi: 10.1002/mds.21649. [DOI] [PubMed] [Google Scholar]
- 49.Schrag A, Sheikh S, Quinn NP. A comparison of depression, anxiety, and health status in patients with progressive supranuclear palsy and multiple system atrophy. Mov Disord. 2010;25:1077–1081. doi: 10.1002/mds.22794. [DOI] [PubMed] [Google Scholar]
- 50.Winter Y, Spottke AE, Stamelou M. Health-related quality of life in multiple system atrophy and progressive supranuclear palsy. Neurodegener Dis. 2011;8:438–446. doi: 10.1159/000325829. [DOI] [PubMed] [Google Scholar]
Associated Data
This section collects any data citations, data availability statements, or supplementary materials included in this article.