

Significance
This article presents a unique genome-wide transcriptome and cistrome analysis for thyroid hormone receptors. It defines 3,3′,5-triiodo-L-thyronine (T3) target genes in a neural cell line expressing either TRα1 or TRβ1. A substantial fraction of the T3 target genes display a marked preference for one of the two receptors. However, receptor-selective regulation of T3 target genes does not result from receptor-selective chromatin occupancy of their promoter regions. We conclude that modification of TRα1 and TRβ1 intrinsic properties contributes to the divergent evolution of the receptors’ function.
Abstract
TRα1 and TRβ1, the two main thyroid hormone receptors in mammals, are transcription factors that share similar properties. However, their respective functions are very different. This functional divergence might be explained in two ways: it can reflect different expression patterns or result from different intrinsic properties of the receptors. We tested this second hypothesis by comparing the repertoires of 3,3′,5-triiodo-L-thyronine (T3)-responsive genes of two neural cell lines, expressing either TRα1 or TRβ1. Using transcriptome analysis, we found that a substantial fraction of the T3 target genes display a marked preference for one of the two receptors. So when placed alone in identical situations, the two receptors have different repertoires of target genes. Chromatin occupancy analysis, performed at a genome-wide scale, revealed that TRα1 and TRβ1 cistromes were also different. However, receptor-selective regulation of T3 target genes did not result from receptor-selective chromatin occupancy of their promoter regions. We conclude that modification of TRα1 and TRβ1 intrinsic properties contributes in a large part to the divergent evolution of the receptors’ function, at least during neurodevelopment.
Thyroid hormone [3,3′,5-triiodo-L-thyronine (T3)] exerts a broad influence on vertebrate development and maintains adult homeostasis. It directly transactivates gene expression by binding to nuclear receptors (TRα1, TRβ1, and TRβ2, collectively called TRs). TRs display extensive structural similarity. They are encoded by two paralogous genes, Thra and Thrb, which evolved from a common ancestor gene, duplicated 500 Mya (1). In mammals, TRα1 mRNA is nearly ubiquitous. Its expression starts during early development and then varies in different cell types. TRβ1 expression pattern is more contrasted. Expression is high in liver, pituitary, inner ear, retina, and several brain areas. TRβ2 is confined to the pituitary, hypothalamus, cone cells of the retina, and the auditory cells of the cochlea (2).
Although they can bind DNA as homodimers in vitro, TRs are thought to mainly transactivate target genes’ expression after heterodimerization with another member of the nuclear receptor family, the retinoid X receptor (RXR). Heterodimers bind T3 response elements (TREs) that usually associate two tandem 5′AGGTCA3′ half-sites separated by 4 nt (called DR4 elements) (3). However, natural response elements often diverge from the consensus DR4 element, and other combinations of half-sites, everted and inverted repeats have been described (4). TRs contain two highly structured domains, separated by a flexible hinge. The N-terminal domain ensures binding to DNA, which takes place both in the presence and the absence of T3 in a highly dynamic manner. The C-terminal domain ensures both heterodimer formation and ligand binding. It contains a binding pocket in which T3 entry induces the displacement of the terminal helix. This conformational change modifies the interaction surface of TRs, favoring the recruitment of transcription coactivators at the expense of corepressors. This general model (5) has been verified in transfected cells for a few well-characterized T3 target genes, but the likely existence of thousands of other T3 target genes raises the possibility that alternate models exist.
Clarifying TRα1 and TRβ1 respective functions, and defining the molecular basis of the functional differences, is an important issue. It would help to develop new selective ligands (6). It might also help to predict the possible detrimental side effects of these synthetic ligands in heart and brain (7) and the toxicity of some environmental contaminants supposed to interfere with TR functions (8). The primary sequence and 3D structure of TRα1 and TRβ1 are very similar, although differences are observed for key amino acids in the DNA-binding domain (9–12). In most in vitro and cellular assays, they behave equally, even if TRα1 has a slightly higher affinity for T3 and is less prone to form homodimers in the absence of ligand (13). By contrast, genetic data indicate that the two receptors have very different functions in vivo. Two germ-line mutations have been reported recently for the human Thra gene (14, 15). The patients share typical symptoms of congenital hypothyroidism, including cognitive impairments. By contrast, numerous Thrb germ-line mutations have been reported in patients, leading to a complex syndrome known as resistance to thyroid hormone. Patients with Thrb mutation have elevated circulating levels of T3, due to altered feedback regulation. The syndrome therefore associates both hyper- and hypothyroidism symptoms, depending on the ability of different tissues to maintain a sensitivity to the excess of T3, through TRα1 (16). Neurocognitive characteristics similar to attention-deficit hyperactivity disorder are often observed (17). The respective functions of TRα1 and TRβ1 have been analyzed in great detail, using a reverse genetic approach in mice. To date, 22 germ-line mutations have been created (18), and a number of phenotypic alterations have been reported (19). Most of the reported phenotypic traits are different in Thra and Thrb mutants. However, neurodevelopmental defects can be present in both cases, suggesting that, at least in the developing brain, the functions of TRα1 and TRβ1 partially overlap. In cerebellum, for example, point mutations abolishing the transactivation ability of either TRα1 (20, 21) or TRβ1 (22) lead to distinct phenotypes, resembling congenital hypothyroidism.
Two nonexclusive and general hypotheses can explain the functional divergence between the two receptors. The first possibility is that TRα1 and TRβ1 share a common repertoire of target genes and that their specific function is governed only by their respective abundance in a given cell type. As expected from this hypothesis, the phenotypic alteration of Thra and Thrb mutants is usually observed where their expression is predominant: heart, intestine, and bone for Thra and liver and retina for Thrb. Combining Thra and Thrb germ-line mutations in mice indicates a functional redundancy in cell types that express both receptors (23, 24). The alternative hypothesis is that divergent evolution of the Thra and Thrb genes resulted in differences in the intrinsic properties of TRα1 and TRβ1 and the existence of distinct repertoires of target genes. Although rarely considered, this proposal would explain why, in tissues where TRα1 and TRβ1 expression is apparently balanced, a mutation of only one of the genes is sufficient to alter the phenotype. It would also account for several puzzling observations: in the inner ear outer hair cells, Prestin expression is altered by mutation of TRβ1, but not of TRα1, whereas the opposite is observed for Kcnq4 (25, 26). In hepatocytes, where TRβ1 represents more than 80% of the T3 receptors, a fraction of the T3 responsive genes cannot be activated by a TRβ selective ligand (27). That TRα1 or TRβ1 might possess distinct repertoires of target genes has been illustrated by a study performed in human hepatoma HepG2 cells, which spontaneously express only TRβ1. Microarray RNA analysis performed after overexpression of either TRα1 or TRβ1 revealed the existence of a small set of genes, for which the amplitude of the T3 response is receptor-dependent (28).
In the present study, we analyzed the repertoires of genes that can be regulated by a single receptor introduced in a neural cell line expressing no endogenous TRs. For this, we restored T3 response in these cells by expressing a tagged version of either TRα1 or TRβ1 and performed a time-course analysis of T3 response. By using high-throughput DNA sequencing, we reached a genome-wide view of the induced changes in transcriptome. We also performed what is, to our knowledge, a unique genome-wide analysis of chromatin occupancy by TRs (cistromes). Although the respective repertoires of TRα1 and TRβ1 extensively overlap in this cellular system, a number of genes display a marked preference for one receptor. Moreover, our results show that differential transactivation by T3 is unlikely to result from differential occupancy of proximal genomic regions by TRα1 and TRβ1.
Results
Cellular System to Compare Receptors’ Functions.
The TRα1 and TRβ1 receptors display extensive sequence homology, with mismatches scattered in the DNA-binding domain and the ligand-binding domain (Fig. 1A). To address the possibility that these structural differences entail a divergence in their respective repertoire of target genes, we designed two isogenic cellular models, differing only by the receptor that they express. C17.2 cells are immortalized cells obtained after retrovirus transduction of the v-myc oncogene into newborn mouse cerebellum (29). When grafted in vivo, or when deprived of serum, they stop proliferating and differentiate into neuron-like cells within 1 wk. C17.2 cells probably originate from the cerebellum external granular layer, a transient structure populated by granular neuron precursors, and like these natural progenitors, express few if any TRs (30–32). We transfected these cells to express in a stable manner either TRα1 or TRβ1 and the reporter enhanced green fluorescent protein (Fig. 1B). We introduced the N-terminal tag (GS encoding fragments of protein G and streptavidin), allowing us to use identical protocols to address chromatin occupancy by the two receptors. We used fluorescence-activated cell sorting to isolate cells that permanently express either TRα1 (C17.2α cells) or TRβ1 (C17.2β cells) on the basis of concomitant EGFP expression. Western blotting analysis confirmed that the two C17.2-derived cell lines expressed the tagged TRα1 and TRβ1 at equivalent levels (Fig. 1C). The expression level was fivefold higher than the one measured for TRα1 from whole mouse cerebellum at P15. As TRα1 mRNA level is very heterogeneous in cerebellum, the level in C17.2α cells is probably equivalent to the one observed in the neuronal populations with high expression level. Quantitative (Q)-RT-PCR was also used to verify that, unlike the original C17.2 cells, C17.2α and C17.2β cells respond to T3 stimulation by a robust induction of Hr gene expression, encoding the Hairless corepressor (Fig. 1D), which is a direct TR target gene in most neuronal cell types (33). As T3 response was higher after serum removal, all subsequent inductions were performed 24 h after serum deprivation, i.e., several days before the cells display obvious signs of differentiation. We also used 10−7 M of T3, a saturating dose that allowed us to neglect differences in T3 binding affinity. In these conditions, C17.2α and C17.2β cells are suitable models to compare T3 response mediated by either TRα1 or TRβ1 in the same context.
Fig. 1.

Isogenic neural cell lines expressing either TRα1 or TRβ1. (A) Primary sequence of the mouse TRα1 receptor. Italics correspond to the unique N terminus. Red amino acids are different in TRα1 and TRβ1 in both human and mouse receptors. The blue box corresponds to the DNA-binding domain. Within this domain the P box (yellow) and the D box (green) are key elements of the two zinc fingers formed by the DNA-binding domain. Note the divergence in the D box, which has been shown to be important in the in vitro DNA-binding properties of the TR/RXR heterodimers. (B) Expression vector used in C17.2 cells. TRα1 or TRβ1 cDNA is inserted in frame with the GS tag sequence encoding a fragment of protein-G (G) peptide and a streptavidine-binding peptide (S). Transcription is under the control of the CMV promoter. A downstream cassette coding for the enhanced green fluorescent protein (EGFP), translated via an independent internal ribosome entry site (IRES), was used to select TR-expressing cells by fluorescence-assisted cell sorting. (C) C17.2α and C17.2β cells express equal levels of either GS-TRα1 or GS-TRβ1 after two rounds of cell sorting, as judged by Western blotting (based on IgG/protein-G interaction). A faint nonspecific band is observed in both control and transfected cells. (D) Q-RT-PCR confirms that T3 transactivation of Hr expression is restored in both C17.2α and C17.2β cells. Time course of response (10−7 M T3, Upper) and dose dependence (Lower) are shown. Error bars indicate SD for three independent experiments. Maximum response is achieved at T3 doses superior to 10−8 M and slowly increases beyond 6 h. Naive C17.2 cells do not display a significant response.
Transcriptome Analysis Identifies a Number of New T3 Target Genes.
RNAs were extracted from control and T3-stimulated (6, 12, or 24 h) C17.2α and C17.2β cells. Transcriptome was then analyzed using digital gene expression (DGE), a protocol adapting serial analysis of gene expression to high-throughput DNA sequencing. As sequencing is limited to the last 25 nt of polyadenylated mRNA, DGE provides a global view of gene expression, is not biased by transcript length, and can be analyzed without taking into account alternative splicing and promoter use. A total of 12 cDNA libraries were submitted to DGE, providing each time more than 7 × 10⁶ sequence reads (Table S1). Reads were aligned with the mouse RefSeq database (mm9 assembly, release 48), revealing the expression of more than 10,000 genes. T3-regulated genes were then selected by using the following filters: read frequency should be superior to 3 × 10⁻⁶ in at least one library, the combined fold change (regulation radius R > 1; Materials and Methods), and a consistent induction should be observed at least at two consecutive time points (as each condition was not duplicated).
Plotting T3 response of C17.2α and C17.2β cells (Fig. 2) revealed that induction is already visible at 6 h and that average induction is equivalent in both cell types. Both up- and down-regulations of gene expression were observed. A large number of genes (1,125) responded to T3 stimulation (10% of the expressed genes) and the divergence between T3-treated and untreated cells rapidly grew over time. To recognize the genes whose expression persists in adult cerebellum, which mainly contains granule neurons, we used the available ENCODE chromatin immunoprecipitation (ChIP)-Seq dataset describing chromatin occupancy for RNA polymerase II and found that the promoter sequences were occupied for 250 (22%) genes of the 1,125 T3-responsive genes.
Fig. 2.

Genome-wide analysis of TRα1 and TRβ1 and T3-mediated response. Only the 1,125 genes for which T3 has a significant influence at two consecutive time points are represented. The plots report the log2 of the induction rate for C17.2α (x axis) and C17.2β cells (y axis) at three different time points. Gray circle corresponds to genes without significant regulation (R < 1; Materials and Methods). Vertical lines and horizontal lines delimit areas with apparent TRβ1-selective and TRα1-selective regulation, respectively.
T3 response was noted in both cell lines for the majority of the genes. Strikingly however, a marked preference for one receptor was often observed. In some cases T3 response was clearly receptor specific. We used Q-RT-PCR to confirm the validity of our conclusions for selected examples (Fig. 3A). Receptor-selective response was observed within a wide range of T3 concentrations (Fig. 3B), ruling out the possibility that it is the result of differential sensitivity to T3 of DNA-bound TRs. We used the same set of genes on naive C17.2 cells to ascertain that exogenous TR must be present for T3 response (Fig. S1).We also verified for some genes that T3 response was maintained in the presence of cycloheximide (Klf9, Dbp), an inhibitor of protein synthesis, and thus likely to be the direct result of TR-mediated transactivation (Fig. S1). Other genes had a blunted response after cycloheximide treatment (Zbtb20) and might represent secondary targets.
Fig. 3.

Q-RT-PCR confirmation of receptor-specific regulation. Bars with light shading, C17.2α cells; bars with dark shading, C17.2/β cells. y axis: log2 of fold change after T3 stimulation. Error bars indicate SD for three independent experiments. (A) Time-course analysis 6,12, and 24 h after T3 addition reveals receptor selective response. (B) Receptor selective response persists within a wide range of T3 concentrations (10−10 M, 10−9 M, 10−8 M, 5.10−8 M, and 10−7 M for 24 h). TRα1 selective response is observed for Slc26a1, B3galt5, and EphB3. TRβ1 selective response is observed for Adamtsl4, Aoc3, Htra1, Megf6, and Tgm2.
Diversity of T3 Response.
Individual genes differ not only by the fact that they are activated or repressed preferentially in C17.2α or C17.2β cells, but also by the kinetics of the response and the temporal stability of the expression. A clustering analysis identified 10 different groups of T3 responsive genes (Fig. 4). We applied Gene Ontology analysis (Table 1) to these groups and found that two of the down-regulated clusters (K7 and K9) contain genes that are involved in neurite extension and neurogenesis, whereas energetic metabolic processes were up-regulated in many ways, as observed in other cell types upon T3 stimulation. The hypoxia-response pathway was also highly enriched in cluster K1 with up-regulated genes. This is a likely consequence of the early and robust up-regulation of hypoxia-inducible transcription factor Epas1/Hif2a, which is a key upstream element of this pathway (Fig. S2).
Fig. 4.

Clustering analysis of T3 responsive genes. Heat map (Center) and average behavior of the 10 different clusters of genes obtained after k-means clustering analysis are shown. Blue, low levels of expression; yellow, high levels of expression (normalized and mean-centered values). C17.2α cells are on the left and C17.2β cells on the right. For each cell line, untreated cells (−T3) are on the left and treated cells (+T3) on the right, each category being subdivided into three different columns corresponding to the duration of treatment (6, 12, or 24 h). Each cluster is numbered (K1–K10). Graphs represent the mean value of gene expression ±SD for each cluster at different time points. C17.2α are on the left and C17.2β on the right. Blue line, untreated cells; red line, T3-treated cells.
Table 1.
Clustering of genes regulated in C17.2α and C17.2β cells
| Cluster | K1 | K2 | K3 | K4 | K5 | K6 | K7 | K8 | K9 | K10 |
| No. genes | 90 | 97 | 103 | 75 | 106 | 147 | 138 | 53 | 106 | 146 |
| T3 regulation | Up | Up | Up | Up | Up | Up | Down | Down | Down | Down |
| No. with TR-binding site (%/no. genes) | 44 (48) | 45 (46) | 51 (49) | 30 (40) | 39 (36) | 61 (47) | 20 (14) | 7 (13) | 4 (4) | 15 (10) |
| No. with DR4 consensus (% /no. genes) | 22 (24) | 30 (31) | 29 (28) | 12 (16) | 16 (15) | 34 (23) | 9 (6) | 4 (7) | 2 (2) | 6 (4) |
| No. with TRα1-specific binding site | 21 | 21 | 20 | 18 | 17 | 34 | 13 | 3 | 3 | 8 |
| No. with TRβ1-specific binding site | 1 | 5 | 2 | 1 | 4 | 4 | 0 | 0 | 0 | 2 |
| Enriched pathway or biological processes (P values) | Hypoxia pathway (4 × 10⁻⁶); cellular metabolic process (10−10) | Regulation of cellular process (3 × 10⁻⁸) | Regulation of cellular metabolic process (5 × 10⁻⁷) | Cellular metabolic process (10−10) | Cellular metabolic processes (4 × 10⁻¹⁰) | Cellular metabolic processes (10−7) | Neuron projection development (10−8) | Regulation of cellular component organization (4 × 10⁻⁶) | Neurogenesis, neuron projection development (10−11) | Metabolic process (3 × 10⁻⁹) |
| Example of genes | Camk2d, Car9, Cpt1a, Dab2, Epas1, Hcn1, Jarid2, Lcat, Me1, Scarb1,Scd1, Smad7, Socs2 | Camk2a, Dbp, Eda, Fos, Kcna1, Nr1d1, Pfkfb2, Rara | Abca1, Foxc2, Nr1h4, Jmjd6, Klf9, Hr, Per3, Cdkn1a, Rb1, Zbtb20 | Vegfa, Egln1, Bmp4, Gli3, Homx1, Plp1, Slc2a1 | Cttnb1, Stat5a, igfbp3, Pdk1, Pgk1, Egr1, Lrx3, Bcl3, Brca1, Htra1, Pfkfb4 | Cpeb1, Pdgfb, Ppard, Slc25a29, Sirt4, Six4 | Chl1, Klf7, Notch1, Tgfb2, L1cam, Vim, Sema4f | Ngf, Notch4, Pax9, Slit2, Serpine1 | Jun, Nr4a2, Plxnb1, Plxna3, Plxna4, Serpine2, Sox2 | Hdac11, Tgfb1, Hes6, Mmp14, Fkbp2, Jag1, Nog |
Clustering was performed on the 1,125 T3-regulated genes using the k-means method. TRBS with different characteristics were then allocated to each cluster (Materials and Methods). Enriched pathways were identified by applying the GO tool from Genomatix.
TR Occupancy.
To identify the molecular mechanisms underlying the differential response of C17.2α and C17.2β cells, and to pinpoint the direct TR target genes among the T3 responsive genes, we addressed TR occupancy in a genome-wide manner. Chromatin was cross-linked and fragmented, and the TR-bound fraction was isolated by taking advantage of the affinity between GS tag and IgG-coupled beads [chromatin affinity purification (ChAP)]. Deep sequencing was then used to identify TRα1 and TRβ1 cistromes (ChAP-Seq libraries sizes, Table S2) and the MACS algorithm was used for peak calling. We used a 10−7 statistical threshold for peak calling when binding sites were identified in only one analysis, to limit the false discovery rate, whereas for the shared binding sites, a 10−4 threshold could be used with confidence, as the combined P value was below 10−8. Due to incidental technical variation, the average peak height was lower in the TRβ1 ChAP-Seq (Fig. 5A) and the number of detected TR binding sites (TRBS) more limited (Fig. 5B). Although many TRBS were shared by the two receptors, marked differences were observed between TRα1 and TRβ1 cistromes (Fig. 5B). Importantly, this conclusion remained valid when very stringent statistical thresholds were chosen for peak calling (Fig. 5C). We first ascertained that TRα1 and TRβ1 cistromes do not fully overlap by using data from a ChIP-Seq analysis aimed at addressing RXR occupancy in C17.2α cells, which provided a strong statistical basis for this conclusion (Fig. S3). We used the MACS algorithm again to detect TRBS that are present in one of the ChAP-Seq only, by defining the other dataset as a control, and therefore used a more stringent filter to search for receptor-selective TRBS. This identified 1,057 TRα1-selective binding sites and 16 TRβ1-selective binding sites. This method also identified 395 TRBS previously classified as shared bind sites, which display a marked preference for one receptor [listed in the supplementary files at Gene Expression Omnibus (GEO)]. Finally, we used quantitative (q)PCR to confirm that TRα1 and TRβ1 often display a marked selectivity for chromatin occupancy, although full specificity was not observed with this method (Table 2).
Fig. 5.

TRα1 and TRβ1 cistromes. (A) representative view of the UCSC mouse genome browser (http://genome.ucsc.edu/cgi-bin/hgGateway) around the Klf9 locus. (Bottom) Klf9 position and exon/intron composition are indicated by boxes (exons) and bars (introns). Mapability for 36-mer tags is indicated as a red line ranging from 0 (not mapable) to 1 (fully mapable) for every position. Each ChAP-Seq experiment is represented as a signal track, providing the number of tags sequenced on 10-bp sliding windows (scale on the right-hand side is the number of counted tags). Two shared TRBS and one binding site detected only for TRα1 are located upstream of Klf9. Note that for Klf9, the TRBS are not at the previously reported position (57). (B) Venn diagrams representing the number of binding sites for each ChAP/ChIP-Seq experiment and the number of shared TRBS. The threshold P value is 10−7 for the sites identified in a single experiment. Additional sites (in parentheses and italics) are the ones observed in more than one experiment, using a 10−4 threshold for peak calling, taking into account the data of the RXR ChIP-Seq experiment (Fig. S3). (C) Limited overlap between TRα1 and TRβ1 cistromes. Depending on the P value used for peak calling, the fraction of TRβ1-binding sites overlapping with TRα1-binding site varies. However, unlike what is observed between TRα1 and RXR (Fig. S3), overlap never exceeds 0.8 even for P value <10−7. The false discovery rate was calculated by assuming that all TRα1-binding sites should be also identified in the RXR ChIP-Seq experiment performed on C17.2α cells. (D) Consensus sequence defined by the CHIP-MEME algorithm using all of the TRBS is close to a direct repeat with a 4-nt spacer (DR4). According to structure analysis, RXR recognizes the 5′ half-site (5′AGGTCA) and TR recognizes the 3′ half-site (5′AGGNCA).
Table 2.
Properties of individual TRBS
| Binding site | Chr | Summit position | DR4-like sequence (similarity) | Gene (distance to TSS, kb) | mRNA induction rate, 12 h | ChAP-Seq, MACS score | ChAP enrichment, qPCR | |||
| C17.2α | C17.2β | C17.2α | C17.2β | C17.2α | C17.2β | |||||
| A-TRBS-5973 | 7 | 52,963,226 | CCGGGTCAGCCGAGGACAC (0.97) | Dbp (+2.6) | 1.3 | 2.1 | 211.6 | 93.4 | 5.7 ± 1.9 | 3.9 ± 0.8 |
| A-TRBS-3567 | 19 | 23,209,439 | CGGGGTTATGCGAGGTAAC (0.89) | Klf9 (−6.2) | 2.0 | 3.9 | 54.2 | 117.7 | 21.3 ± 1.6 | 20.2 ± 5.8 |
| A-TRBS-3568 | 19 | 23,210,491 | CAGGTTCATTTGAGGACAG (0.92) | Klf9 (−5.2) | 2.0 | 3.9 | 66.6 | 55.5 | 20.3 ± 1.8 | 20.2 ± 0.6 |
| B-TRBS-6508 | 4 | 94,719,071 | No DR4 | Jun (−0.1) | 0.4 | 0.4 | N/A | 111.3 | 1.2 ± 0.1 | 10.4 ± 2.3* |
| A-TRBS-4394 | 3 | 95,480,909 | ATTGGTCATCTGAGGACAG (1.0) | Adamtsl4 (−10.9) | 0.8 | 6.0 | 167.9 | 121.5 | 6.0 ± 1.9 | 4.6 ± 1.9 |
| A-TRBS-6181 | 7 | 138,112,268 | No DR4 | Htra1 (+32.5) | 1.9 | 3.0 | 172.3 | 91.55 | 23.2 ± 3.3 | 21.2 ± 0.1 |
| A-TRBS-6182 | 7 | 138,121,594 | TAAGGTCACCTGAGGCCGG (0.85) | Htra1 (+41.9) | 1.9 | 3.0 | 164.1 | 45.5 | 13.6 ± 1.3 | 8.9 ± 0.2 |
| A-TRBS-3280 | 17 | 87,268,845 | CGGGGTGACCTGGGGCCAC (0.98) | Epas1 (+115.6) | 21.4 | 25.9 | 250.3 | 160.2 | 4.8 ± 1.4 | 3.0 ± 1.0 |
| A-TRBS-3281 | 17 | 87,304,787 | No DR4 | Epas1 (+151.6) | 21.4 | 25.9 | 151.3 | 145.1 | 5.2 ± 0.9 | 3.4 ± 1.3 |
| A-TRBS-6445 | 8 | 93,967,978 | CAGGGTTACCTGGGGTCAG (0.80) | Fto (+130.5) | 1.1 | 1.0 | 170.5 | NA | 10.6 ± 2.8 | 2.4 ± 1.4* |
| B-TRBS-6937 | 5 | 37,682,481 | CTGGCTCATCTGAGGTCAA (0.85) | Crmp1 (+49.2) | 0.4 | 0.6 | N/A | 107.5 | 2.3 ± 0.7 | 6.6 ± 2.0* |
| A-TRBS-3729 | 2 | 11,457,332 | AGAGGTCAGCTCGGGACGC (0.90) | Pfkfb3 (+18.2) | 3.1 | 2.7 | 198.8 | 86.7 | 21.9 ± 3.5 | 19.7 ± 0.6 |
| A-TRBS-4531 | 3 | 142,218,834 | No DR4 | Gbp3 (−4.2) | NA | NA | 129.7 | NA | 1.4 ± 0.6 | 1.7 ± 1.1 |
TRBS numbering is either from the C17.2α (A-TRBS) or from the C17.2β (B-TRBS) ChAP-Seq experiment. DR4 sequences were found by the Genomatix software, using the MEME-generated matrix (similarity score indicated). P values for ChAP-Seq can be calculated from the MACS score ( ). Q-PCR confirmed the enrichment of TR in all cases and, for some peaks, a marked preference for one isotype (boldface type). NA: not applicable (isotype-specific TRBS or gene not expressed in C17.2 cells).
*T-test P value <0.05 between C17.2α and C17.2β cells.
The MEME-ChIP algorithm was then used to define consensus binding sites for TRα1 or TRβ1 in the shared and specific binding sites. In both cases, we identified only one consensus that strikingly resembles the known DR4 elements (Fig. 5D). We used the newly defined consensus to search for similar sequences in all of the identified TRBS, and found it in half of them. As published data indicate that other combinations of half-sites also (mainly ER6 and IR0) act as T3 response elements, we systematically scanned all TRBS for enrichment in various types of direct repeats (DR0–DR9), everted repeats (ER0–ER9), and inverted repeats (IR0–IR9), using receiver operating characteristic (ROC) curves (Fig. S4). This confirmed the surprising conclusion that only DR4 elements are overrepresented in TRBS. This was also true when TRα1-specific and shared TRBS were considered separately.
Receptor-Selective Response and Receptor-Selective Binding.
We merged cistrome and transcriptome data to ask whether differential T3 response could be explained by a different ability of TRα1 and TRβ1 to bind T3 response elements. We first selected genes that carry a TRBS shared by TRα1 and TRβ1 within 30 kb of the annotated transcription start site and are thus very likely to be directly regulated by T3 (listed in the supplementary data files at GEO). As expected, the frequency of these genes was significantly increased among genes that are up-regulated by T3 in both C17.2α and C17.2β cells (Table 1 and Fig. 6). Interestingly this was not the case for the genes with negative regulation (clusters K7–K10), suggesting that some alternative mechanisms of regulation are taking place for these genes. By contrast, when we analyzed in the same manner the isoform-selective TRBS, no obvious correlation was observed with the mode of regulation by T3 (Fig. 6B). In conclusion, the ChAP-Seq data do not support the hypothesis according to which receptor-selective transcriptional regulation results from receptor-selective chromatin occupancy of proximal regulatory sequences. Instead, receptor-selective transactivation was often observed in chromatin regions with shared TRBS, suggesting that TR binding was not sufficient to promote induction by T3. Although the underlying molecular mechanism remains to be identified, the fact that receptor-selective response was not observed in a transient expression assay using cloned TRBS (Table S3) rules out a number of simplistic hypotheses.
Fig. 6.

Correspondence between chromatin binding by TR and T3 regulation. The 1,125 genes for which T3 has a significant influence at two consecutive time points are represented as in Fig. 2 (gray). (A) Shared binding sites. Genes with a TRBS within 30 kb of the transcription start site are in red. Note the high enrichment (×10) for genes that are positively regulated. Triangles correspond to TRBS with a sequence similar to the consensus DR4 element, as defined in Fig. 5. The distribution of DR4 containing TRBS is not different from the others. (B) Receptor-specific TRBS. Triangles correspond to TRBS with a sequence similar to the consensus DR4 element. Genes with a TRα1-specific binding site are in green, and genes with a TRβ1-specific binding site are in orange. Note that, for technical reasons, we can identify a larger number of TRBS in C17.2α cells than in C17.2β cells. The distribution does not indicate a correlation between the presence of a proximal receptor-specific TRBS and receptor-selective regulation.
Discussion
By using two cell lines that express either TRα1 and TRβ1 we were able to address, in a global manner, the possibility that differences in intrinsic properties of the receptors govern their respective ability to transactivate gene expression. Although providing unprecedented precision and being performed at a genomic scale, our approach suffers from some limitations: by introducing an N-terminal GS tag, we do not address the possibility that the natural N-terminal tail of TRβ1 also participates in its specific function. Although enabling a broad survey of the transcriptome, sufficient to draw general conclusions, DGE does not provide a fully exhaustive view of the transcriptome: it is restricted to mRNA species with a poly(A) tail and does not take into account alternative splicing and alternate promoter use. Finally our analysis was designed to detect persistent changes in mRNA levels and not limited to one receptor and one time point. This choice impacts the clustering analysis: cluster K10 identity and the distinction between cluster K5 and K6 mainly rely on the strong expression observed in C17.2α cells 24 h after T3 stimulation and are thus questionable in statistical terms. Finally, we are studying cells expressing only one receptor, and whether our results can be extrapolated to situations where both receptors are present in the same cells remains to be addressed. The amount of transcriptome data that we gathered is nevertheless largely sufficient to firmly establish a surprising conclusion: an important part of T3 response in this system displays a marked preference for one TR receptor. A similar conclusion was reached by using a similar approach, not including chromatin occupancy analysis, in hepatoma HepG2 cells (28). However, the number of receptor-selective target genes seems to be much more limited in the HepG2 analysis. We believe that the two studies mainly differ in the technical choice for transcriptome analysis, for which DGE is more sensitive than microarray hybridization, and the fact that, unlike C17.2, untransfected HepG2 cells already express TRβ1 at a high level.
Functions of Shared and Specific Target Genes.
Although performed in an artificial in vitro system, our study pinpoints most of TR target genes that have been identified in the cerebellum granule cells (34) and therefore appears to have some relevance to the neurodevelopmental function of TR. It shows a large number of novel TR target genes that are likely to sustain this function. Among the genes that are activated by both TRα1 and TRβ1, many genes encode enzymes involved in mitochondria lipids and glucose metabolism. This trend is consistent with the known metabolic influence of T3 in other cell types and suggests some interesting links between two well-known properties of T3: stimulation of mitochondrial metabolism and promotion of neuronal differentiation. In that respect the ability of T3 to up-regulate Epas1/Hif2a expression, confirmed in the cerebellum, establishes a putatively meaningful link with the hypoxia pathway. EPAS1 protein stability is known to be enhanced by hypoxia and Krebs cycle metabolites, but the transcriptional regulation of Epas1/Hif2a is less documented. EPAS1 fulfills at least two important functions, both in hypoxic and in normoxic conditions: it promotes angiogenesis, notably by up-regulating Vegfa, which encodes the vascular endothelium growth factor. It also activates glycolysis, by up-regulating Pfkfb3, which encodes 6-phosphofructo-2-kinase/fructose-2,6-biphosphatase 3. This enzyme produces a metabolite, fructose 2,6-bisphosphate, which is a potent activator of phosphofructokinase, the rate-limiting enzyme of glycolysis (35). Therefore, the existence of a T3/TR/EPAS1 pathway in the developing brain provides a number of interesting working hypotheses linking two pathways with broad influence. In particular, it might participate in the regulation by T3 of glucose consumption (36), antioxydant status of cells (37), angiogenesis (38), and neuronal migration (39).
Mechanisms of TR-Mediated Transcriptional Regulation.
This study reports what is, to our knowledge, a unique description of the TR cistrome. The number of TRBS that we found, the presence of the DR4 consensus in many of these, and the enrichment in TRBS in the upstream or downstream proximal regions of genes activated by T3 are all observations that fulfill our expectations. On the basis of the analysis of individual target genes it has also been proposed that TR can interact with the CTCF zinc finger protein on chromatin. This would regulate the ability of CTCF to block enhancer functions, which is thought to define chromatin insulators (40). We thus crossed our cistrome data with publicly available data (ENCODE), which report chromatin occupancy by CTCF in mouse cerebellum. Although the coincidence of TR and CTCF occupancy was not observed frequently, this provided interesting new examples that might deserve deeper investigation (Table S4).
The unexpected part of our observation is the limited correlation that exists between the presence of a proximal TRBS and the up-regulation by T3. In fact, many genes that are up-regulated by T3 (70%) do not have a proximal TRBS. This can be explained in at least two ways. First in a number of cases, T3 regulation is not directly mediated by TR, but requires some intermediate event. Such secondary response already takes place 6 h after T3 stimulation, as evidenced for Zbtb20, and certainly becomes predominant over time. Second, the 30-kb upper limit chosen for the distance between TRBS and the transcription start site of the neighboring gene is arbitrary, and chromatin looping might enable interactions at a megabase distance, as shown for other nuclear receptors (41). However, the possibility for TR to transactivate at a long distance reinforces another paradox: many of the genes that are expressed and possess a proximal TRBS do not respond to T3 stimulation. This situation, also observed for other nuclear receptors, might result from chromatin compartmentalization by insulators (42) or from predominant influence of other transcription factors. Additionally, binding stability (43) may be a key parameter that is not captured by ChAP-Seq or ChIP-Seq.
DR4 element was the only consensus found in TRBS, which strongly suggests that the main, if not exclusive, mode of T3-induced transactivation is mediated by TR/RXR heterodimers. There are, however, enough TRBS without identifiable DR4 element to leave room for an alternate mode of transactivation (5). Interestingly, the frequency of proximal TRBS is low for genes that are negatively regulated by T3. Therefore, our data do not provide statistical support to the hypothesis that liganded TR can also act as a transcription repressor, as suggested for several genes in other systems (44).
Receptor-Specific TR Target Genes.
The TR cistromes provide us with an unprecedented set of 318 genes that are very likely to be direct TR target genes. However, this does not provide an immediate mechanistic explanation for the frequent receptor-selective response revealed by transcriptome analysis. Although we could establish receptor selectivity for a significant fraction of TRBS, we have no statistical indication or clear example supporting the simple hypothesis according to which isoform-selective response to T3 simply results from the existence of a proximal receptor-selective TRBS. If differential binding is not the cause of isoform selective response, what other hypothesis can be proposed? One clue comes from our transient expression experiments where we found that not all TRBS are able to transactivate when placed upstream of a minimal promoter. Although these results are obtained on DNA that is poorly chromatinized (45) and are thus of uncertain relevance, they may indicate that, on some TRBS, TR/RXR heterodimers are in a conformation unfavorable for coactivator recruitment. As discussed above, the possibility that a large fraction of DNA-bound TR-containing complexes are unable to transactivate is consistent with the frequent presence of TRBS next to genes that are not regulated by T3. This situation would be another illustration of the allosteric properties of the DNA/nuclear receptors/ligand/cofactor complexes, where the interface between DNA and nuclear receptors can influence not only the stability of the interaction with DNA but also the recruitment of coactivators and corepressors (10, 46–48). A recent analysis of regulation by T3 of the TSHβ gene in a pituitary cell line confirmed this general hypothesis, providing a clear example where both receptors can bind proximal sequences, with only TRβ1 being able to regulate transcription (49). We thus propose that a large fraction of the TRBS in the genome do not sustain transactivation and that, in many cases, their ability to transactivate depends on the TR receptor that is engaged in the complex.
Consequences of Receptor-Selective Response to T3.
Our observation that T3 can act in a receptor-selective manner suggests that ancestral gene duplication allowed each receptor to gain specific intrinsic properties and functions during vertebrate evolution. Further work is required to transpose our data from the C17.2 neural cell line to the developing brain and possibly to the other organs where both receptors are present. We believe, however, that the receptor-selective response is a major factor defining the respective developmental and physiological functions of TRα1 and TRβ1, which may have general consequences for our understanding of T3 signaling. Notably, it should clarify the links between the Thra or Thrb germ line and somatic mutations and their phenotypical/clinical manifestations. Another significant consequence is for the development of T3 analogs tested to treat dyslipidemia (50, 51). The possibility for these drugs to regulate only a subset of the T3 target might raise other putative indications. Finally, among the environmental pollutants identified as thyroid disruptors, some are able to antagonize TR (52). We believe that it would be useful to consider the possibility that some TR-interfering compounds display receptor selectivity, as already illustrated for some flame retardants (53).
Materials and Methods
C17.2α and C17.2β Cell Lines.
The pCEMM-GS-TRα1 and pCEMM-GS-TRβ1 vectors were constructed by inserting the murine TRα1 or TRβ1 reading frame amplified by PCR into the BamHI site of pCEMM-NTAP (54) to create a reading frame encoding GS-TRα1 or GS-TRβ1 proteins, tagged at their N terminus by a fragment of protein G (G) and the streptavidin binding peptide (S). A downstream IRES-gfp cassette located on the transcription unit ensures coexpression of a green fluorescent protein from the same cytomegalovirus transcription promoter. pCEMM-GS-TRα1 and pCEMM-GS-TRβ1 were independently transfected into C17.2 cells together with pPGK-Puro (Addgene) and puromycine-resistant cells (1 µg/mL) were submitted to two rounds of FACS sorting to select cells with stable expression of both GFP and GS-TRα1 or GS-TRβ1. TR protein expression was measured by Western blotting, using IgG/GS-tag interaction (Santa Cruz). For transcriptome analysis, cells were passed in medium depleted of T3 (by charcoal treatment) for 24 h and then incubated in medium containing 10−7 M T3 (or lower doses to test dose response). For each time point, a similarly handled untreated culture (medium without T3) was used as a control. When indicated, cycloheximide treatment (50 µg/mL) was added for 6 h together with T3.
RNA Extraction and qPCR Measurements.
Total RNA was extracted from cell cultures or mice cerebella with the Macherey-Nagel RNA II kit according to manufacturer’s recommendations. RNA quantities were measured with a Nanodrop (Thermo Scientific) spectrophotometer before reverse transcription. One microgram of each RNA sample was reverse transcribed using MLV reverse transcriptase (Promega). Quantitative PCRs were then performed in 96-well plates, using the hypoxanthine guanine phosphoribosyl transferase gene as a reference after carefully checking that our conditions did not significantly modify its expression level (less than one Ct of difference between samples), with the following mix: 2 µL of primers (primers listed in Tables S5 and S6) mix (1.2 mM), 5 µL of SYBRGreen mix (BioRad iQ supermix), and 2 µL of cDNA diluted 1 to 20. A standard curve was made for each gene and each measure was made in triplicate. Melting curves were analyzed to ascertain homogeneity of the amplified products. Expression levels were calculated using the 2−ΔΔ(Ct) method (55). Confirmation qPCR and dose–response studies were repeated on three independent cell cultures that were different from the ones used to build DGE and ChAP-Seq libraries.
ChAP and ChIP.
Unlike ChIP, ChAP relies on the affinity of the protein-G–tagged protein for IgG beads. For both ChAP and ChIP, nontreated C17.2 cells were rinsed with PBS and cross-linked with 1% paraformaldehyde in PBS for 10 min at 37 °C. Cells were then harvested and stored at −80 °C as pellets. Cell pellets were resuspended in 300 µL lysis buffer [1% SDS, 10 mM EDTA, 50 mM Tris (pH 8), 0 °C, for 5 min] and sonicated for 15 min (30 s on/30 s off, high intensity) with a bath sonicator (Bioruptor, Standard UCD200; Diagenode). A small aliquot of cell lysate was analyzed by gel electrophoresis to ascertain that the size of DNA fragments ranged between 200 and 800 bp. One hundred microliters of the cell lysate was kept as input and the rest was diluted (1 in 10) in dilution buffer (1% Triton X-100, 1 mM EDTA, 150 mM NaCl, 20 mM Tris, pH 8). For ChAP, cross-linked lysates were incubated with IgG-coated magnetic beads (Invitrogen) at 4 °C overnight. For ChIP, a 2-h incubation with a pan-RXR antibody (Reference sc-774x; Santa Cruz) was followed by overnight incubation at 4 °C with protein-A agarose beads. Negative controls were obtained with nontransfected C17.2 cells (ChAP) or with incubating samples with a nonspecific IgG (ChIP). Beads were then rinsed for 10 min in TSE1 buffer (0.1% SDS, 1% Triton X-100, 2 mM EDTA, 150 mM NaCl, 20 mM Tris, pH 8), 15 min in TSE2 buffer (0.1% SDS, 1% Triton X-100, 2 mM EDTA, 500 mM NaCl, 20 mM Tris, pH 8), 30 min in LiCl wash buffer (0.25 M LiCl, 1% Nonidet P-40, 1% sodium deoxycholate, 1 mM EDTA, 1 mM Tris, pH 8), and twice for 5 min with TE (10 mM Tris⋅HCl, 1 mM EDTA, pH 8) and DNA fragments were eluted in 0.1 M NaHCO3, 1% SDS (2.15 min). Cross-link was reversed by overnight incubation at 65 °C in 200 mM NaCl. All steps except DNA elution were performed at 4 °C, using ice-cold buffers containing Protease Inhibitor Mixture (Roche). DNA was purified using the Qiagen minElute kit and quantified by qPCR as described above. Calibration curves were made with dilutions of input DNA and purification rates were calculated as input percentages, using the 2−ΔΔ(Ct) method. For each gene, a distal promoter DNA sequence was used as a control for nonspecific background binding. Enrichment was calculated as the ratio between input percentages of specifically bound quantity and nonspecific binding.
Deep Sequencing.
For transcriptome analysis, DGE (SOLiD Serial Analysis of Gene Expression) was performed by the Institut de Pharmacologie Moléculaire et Cellulaire–Mediante sequencing facility (Sophia-Antipolis, France). Briefly, total RNA was reverse transcribed using oligo(dT) primers and cDNA digested with NlaIII restriction enzyme before ligation to adaptors for emulsion PCR. Deep sequencing of the terminal 25 nt was performed on a SOLiD3 Life Sciences sequencer. Sequences were aligned on the RefSeq mouse transcript database (mm9 release 48) using the SOLiD analysis pipeline, allowing one mismatch and dividing sequences matching different transcripts equally between each transcript. More than 7 × 10⁶ matching sequences were obtained for every cDNA library. For each gene present in the RefSeq library, the frequency was calculated.
For binding-sites analysis (ChAP- and ChIP-Seq), DNA was purified from the TR or RXR-bound chromatin and deep sequencing (36 bp) was performed on an Illumina Genome Analyzer IIx sequencer (Institut de Génétique et de Biologie Moléculaire et Cellulaire sequencing facility, Strasbourg, France). FastQ formatted files were generated with CASAVA v1.8 software. They were aligned on the mouse genome (mm9) with the Bowtie v0.12.7 software and provided as raw alignment files (bam), genomic coordinates files (bed), and signal or base coverage files (wig).
Sequence data and accompanying tables have been submitted to the National Center for Biotechnology Information (NCBI) GEO database, http://www.ncbi.nlm.nih.gov/geo/query/acc.cgi?acc=GSE41727, DGE under dataset no. GSE38539 and cistrome data under no. GSE38347.
Digital Gene Expression Analysis.
Whenever required, normalization was performed by using a linear regression model (treated cells vs. untreated at a given time point). Genes for which expression levels never achieve 3 × 10⁻⁶ reads per million (rpm) were not considered for further analysis. Ratios of treated and untreated cells were calculated for each gene at each time point in both C17.2α (ratio TRα) and C17.2β (ratio TRβ) cells. At each time point a “regulation radius” (R) was calculated as follows: 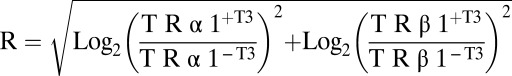 .
.
We defined as T3-regulated genes all of the genes for which R > 1 for at least two consecutive time points. This threshold corresponds to a minimum twofold change by one receptor or to one fourfold change for both TRα1 and TRβ1 [false discovery rate inferior to 0.05 was evaluated using the q-value methods (56)]. Clustering analysis was performed on normalized and mean-centered expression levels, using k-means (R software, version 2.13.2; www.r-project.org), excluding genes with missing data points. The definition of 10 clusters was found as an optimal choice, chosen by calculating the percentage of variability explained by k clusters, k ranging between 2 and 50. Genes were grouped according to their cluster class and sorted by alphabetical order. Results were displayed as heat maps, using Java Tree View software (http://jtreeview.sourceforge.net/manual.html).
ChIP-Seq and ChAP-Seq Analysis.
All analyses were done using the mm9 release of the mouse genome (NCBI37/mm9 assembly from July 2007). Binding sites were searched, using aligned sequence files (.bed formatted) as an input, with the MACS algorithm on the online Galaxy software suite (http://main.g2.bx.psu.edu/root, NGS: peak calling MACS tool). The following parameters were used: genome size, 2.7 × 10⁹; tag size, 36 bp; bandwidth, 500 bp; model fold, 5; P-value cutoff, 10−4; and ranges for calculating regional lambda, peak_region, 1,000, 5,000, 10,000. More than 16 × 106 tags were used for MACS peak calling for each receptor. Binding sites were then filtered using the “CRG align 36 mapability” track of the University of California, Santa Cruz (UCSC) genome browser: Only binding sites for which more than 90% of their nucleotides had a mapability of 0.5 or above were considered, to eliminate artifacts resulting from misalignment on repeated sequences. Overlap between the binding sites identified in independent experiments was then assessed using the Galaxy tool. Subsequent analysis used all binding sites either shared by TRα1 and TRβ1 or shared by TRα1 and RXR with a P value of 10−4 (so that the identification in two independent experiments was providing an estimated P value of 10−8). For binding sites identified in a single experiment, only P values inferior to 10−7 were considered. The Cistrome/Galaxy “integrative analysis – peak2gene” tool was used to retrieve all annotated genes located within 30 kb of the TR binding sites. Cistrome and transcriptome data were then merged, providing both a list of regulated genes with proximal binding sites and a list of binding sites with adjacent regulated genes (available at http://www.ncbi.nlm.nih.gov/geo/query/acc.cgi?acc=GSE41727).
De Novo Motif Search and Binding Sites Consensus Analysis.
Binding-site sequences were trimmed to 200 bp around the summit (calculated by the MACS algorithm) and processed through the MEME-ChIP software (http://meme.sdsc.edu/meme/cgi-bin/meme-chip.cgi). The output of this process was given as an IUPAC weight matrix, giving percentage of each base for every position of the found consensus. This matrix was then used to screen for the identified consensus in all TRBS with the MathInspector tool of the Genomatix software suite (www.genomatix.de).
Supplementary Material
Acknowledgments
We thank P. Barbry, V. Magnonne, and K. Le Brigand at the Mediante SOLiD sequencing facility for help regarding the DGE experiments (Institut de Pharmacologie Moléculaire et Cellulaire). We also thank S. Legras (Institut de Génétique et de Biologie Moléculaire et Cellulaire) for Illumina sequencing and mapping of the cistrome data; S. Dussurgey [Structure Fédérative de Recherche Biosciences Gerland-Lyon Sud (UMS344/US8)] for fluorescence-assisted cell sorting; and P. Veber (Pôle Rhône-Alpin de BioInformatique, Université Claude Bernard Lyon 1, Villeurbanne, France) for the consensus sequences scan. We thank B. Demeneix and L. Sachs for valuable discussion, and D. Blanchard, V. Ollion, and A. Verchère for technical assistance. F.C. was supported by the Association pour la Recherche contre le Cancer. This work was supported by the Agence Nationale pour la Recherche Thyrogenomics2 grant.
Footnotes
The authors declare no conflict of interest.
This article is a PNAS Direct Submission.
Data deposition: The data reported in this paper have been deposited in the Gene Expression Omnibus (GEO) database, www.ncbi.nlm.nih.gov/geo (accession nos. GSE41727, GSE38347, and GSE38539).
This article contains supporting information online at www.pnas.org/lookup/suppl/doi:10.1073/pnas.1210626110/-/DCSupplemental.
References
- 1.Laudet V. The origins and evolution of vertebrate metamorphosis. Curr Biol. 2011;21(18):R726–R737. doi: 10.1016/j.cub.2011.07.030. [DOI] [PubMed] [Google Scholar]
- 2.Flamant F, et al. International Union of Pharmacology. LIX. The pharmacology and classification of the nuclear receptor superfamily: Thyroid hormone receptors. Pharmacol Rev. 2006;58(4):705–711. doi: 10.1124/pr.58.4.3. [DOI] [PubMed] [Google Scholar]
- 3.Mader S, et al. The patterns of binding of RAR, RXR and TR homo- and heterodimers to direct repeats are dictated by the binding specificites of the DNA binding domains. EMBO J. 1993;12(13):5029–5041. doi: 10.1002/j.1460-2075.1993.tb06196.x. [DOI] [PMC free article] [PubMed] [Google Scholar]
- 4.Desvergne B. How do thyroid hormone receptors bind to structurally diverse response elements? Mol Cell Endocrinol. 1994;100(1–2):125–131. doi: 10.1016/0303-7207(94)90291-7. [DOI] [PubMed] [Google Scholar]
- 5.Perissi V, Rosenfeld MG. Controlling nuclear receptors: The circular logic of cofactor cycles. Nat Rev Mol Cell Biol. 2005;6(7):542–554. doi: 10.1038/nrm1680. [DOI] [PubMed] [Google Scholar]
- 6.Tancevski I, Rudling M, Eller P. Thyromimetics: A journey from bench to bed-side. Pharmacol Ther. 2011;131(1):33–39. doi: 10.1016/j.pharmthera.2011.04.003. [DOI] [PubMed] [Google Scholar]
- 7.Grijota-Martínez C, Díez D, Morreale de Escobar G, Bernal J, Morte B. Lack of action of exogenously administered T3 on the fetal rat brain despite expression of the monocarboxylate transporter 8. Endocrinology. 2011;152(4):1713–1721. doi: 10.1210/en.2010-1014. [DOI] [PubMed] [Google Scholar]
- 8.Gilbert ME, et al. Marginal iodide deficiency and thyroid function: Dose-response analysis for quantitative pharmacokinetic modeling. Toxicology. 2011;283(1):41–48. doi: 10.1016/j.tox.2011.02.001. [DOI] [PubMed] [Google Scholar]
- 9.Rastinejad F, Perlmann T, Evans RM, Sigler PB. Structural determinants of nuclear receptor assembly on DNA direct repeats. Nature. 1995;375(6528):203–211. doi: 10.1038/375203a0. [DOI] [PubMed] [Google Scholar]
- 10.Nascimento AS, et al. Structural rearrangements in the thyroid hormone receptor hinge domain and their putative role in the receptor function. J Mol Biol. 2006;360(3):586–598. doi: 10.1016/j.jmb.2006.05.008. [DOI] [PubMed] [Google Scholar]
- 11.Darimont BD, et al. Structure and specificity of nuclear receptor-coactivator interactions. Genes Dev. 1998;12(21):3343–3356. doi: 10.1101/gad.12.21.3343. [DOI] [PMC free article] [PubMed] [Google Scholar]
- 12.Apriletti JW, et al. Molecular and structural biology of thyroid hormone receptors. Clin Exp Pharmacol Physiol Suppl. 1998;25:S2–S11. doi: 10.1111/j.1440-1681.1998.tb02293.x. [DOI] [PubMed] [Google Scholar]
- 13.Velasco LF, et al. Thyroid hormone response element organization dictates the composition of active receptor. J Biol Chem. 2007;282(17):12458–12466. doi: 10.1074/jbc.M610700200. [DOI] [PubMed] [Google Scholar]
- 14.Bochukova E, et al. A mutation in the thyroid hormone receptor alpha gene. N Engl J Med. 2012;366(3):243–249. doi: 10.1056/NEJMoa1110296. [DOI] [PubMed] [Google Scholar]
- 15.van Mullem A, et al. Clinical phenotype and mutant TRα1. N Engl J Med. 2012;366(15):1451–1453. doi: 10.1056/NEJMc1113940. [DOI] [PubMed] [Google Scholar]
- 16.Weiss RE, Refetoff S. Resistance to thyroid hormone. Rev Endocr Metab Disord. 2000;1(1–2):97–108. doi: 10.1023/a:1010072605757. [DOI] [PubMed] [Google Scholar]
- 17.Stein MA, Weiss RE, Refetoff S. Neurocognitive characteristics of individuals with resistance to thyroid hormone: Comparisons with individuals with attention-deficit hyperactivity disorder. J Dev Behav Pediatr. 1995;16(6):406–411. [PubMed] [Google Scholar]
- 18.Flamant F, Gauthier K. Thyroid hormone receptors: The challenge of elucidating isotype-specific functions and cell-specific response. Biochim Biophys Acta. 2012 doi: 10.1016/j.bbagen.2012.06.003. in press. [DOI] [PubMed] [Google Scholar]
- 19.Forrest D, Vennström B. Functions of thyroid hormone receptors in mice. Thyroid. 2000;10(1):41–52. doi: 10.1089/thy.2000.10.41. [DOI] [PubMed] [Google Scholar]
- 20.Fauquier T, et al. Severe impairment of cerebellum development in mice expressing a dominant-negative mutation inactivating thyroid hormone receptor alpha1 isoform. Dev Biol. 2011;356(2):350–358. doi: 10.1016/j.ydbio.2011.05.657. [DOI] [PubMed] [Google Scholar]
- 21.Venero C, et al. Anxiety, memory impairment, and locomotor dysfunction caused by a mutant thyroid hormone receptor alpha1 can be ameliorated by T3 treatment. Genes Dev. 2005;19(18):2152–2163. doi: 10.1101/gad.346105. [DOI] [PMC free article] [PubMed] [Google Scholar]
- 22.Portella AC, et al. Thyroid hormone receptor beta mutation causes severe impairment of cerebellar development. Mol Cell Neurosci. 2010;44(1):68–77. doi: 10.1016/j.mcn.2010.02.004. [DOI] [PubMed] [Google Scholar]
- 23.Göthe S, et al. Mice devoid of all known thyroid hormone receptors are viable but exhibit disorders of the pituitary-thyroid axis, growth, and bone maturation. Genes Dev. 1999;13(10):1329–1341. doi: 10.1101/gad.13.10.1329. [DOI] [PMC free article] [PubMed] [Google Scholar]
- 24.Gauthier K, et al. Genetic analysis reveals different functions for the products of the thyroid hormone receptor alpha locus. Mol Cell Biol. 2001;21(14):4748–4760. doi: 10.1128/MCB.21.14.4748-4760.2001. [DOI] [PMC free article] [PubMed] [Google Scholar]
- 25.Winter H, et al. Thyroid hormone receptors TRalpha1 and TRbeta differentially regulate gene expression of Kcnq4 and prestin during final differentiation of outer hair cells. J Cell Sci. 2006;119(Pt 14):2975–2984. doi: 10.1242/jcs.03013. [DOI] [PubMed] [Google Scholar]
- 26.Quignodon L, Vincent S, Winter H, Samarut J, Flamant F. A point mutation in the activation function 2 domain of thyroid hormone receptor alpha1 expressed after CRE-mediated recombination partially recapitulates hypothyroidism. Mol Endocrinol. 2007;21(10):2350–2360. doi: 10.1210/me.2007-0176. [DOI] [PubMed] [Google Scholar]
- 27.Yuan C, et al. Identical gene regulation patterns of T3 and selective thyroid hormone receptor modulator GC-1. Endocrinology. 2012;153(1):501–511. doi: 10.1210/en.2011-1325. [DOI] [PMC free article] [PubMed] [Google Scholar]
- 28.Chan IH, Privalsky ML. Isoform-specific transcriptional activity of overlapping target genes that respond to thyroid hormone receptors alpha1 and beta1. Mol Endocrinol. 2009;23(11):1758–1775. doi: 10.1210/me.2009-0025. [DOI] [PMC free article] [PubMed] [Google Scholar]
- 29.Snyder EY, et al. Multipotent neural cell lines can engraft and participate in development of mouse cerebellum. Cell. 1992;68(1):33–51. doi: 10.1016/0092-8674(92)90204-p. [DOI] [PubMed] [Google Scholar]
- 30.Wallis K, et al. The thyroid hormone receptor alpha1 protein is expressed in embryonic postmitotic neurons and persists in most adult neurons. Mol Endocrinol. 2010;24(10):1904–1916. doi: 10.1210/me.2010-0175. [DOI] [PMC free article] [PubMed] [Google Scholar]
- 31.Bradley DJ, Towle HC, Young WS., 3rd Alpha and beta thyroid hormone receptor (TR) gene expression during auditory neurogenesis: Evidence for TR isoform-specific transcriptional regulation in vivo. Proc Natl Acad Sci USA. 1994;91(2):439–443. doi: 10.1073/pnas.91.2.439. [DOI] [PMC free article] [PubMed] [Google Scholar]
- 32.Mellström B, Naranjo JR, Santos A, Gonzalez AM, Bernal J. Independent expression of the alpha and beta c-erbA genes in developing rat brain. Mol Endocrinol. 1991;5(9):1339–1350. doi: 10.1210/mend-5-9-1339. [DOI] [PubMed] [Google Scholar]
- 33.Thompson CC. Thyroid hormone-responsive genes in developing cerebellum include a novel synaptotagmin and a hairless homolog. J Neurosci. 1996;16(24):7832–7840. doi: 10.1523/JNEUROSCI.16-24-07832.1996. [DOI] [PMC free article] [PubMed] [Google Scholar]
- 34.Chatonnet F, Guyot R, Picou F, Bondesson M, Flamant F. Genome-wide search reveals the existence of a limited number of thyroid hormone receptor alpha target genes in cerebellar neurons. PLoS ONE. 2012;7(5):e30703. doi: 10.1371/journal.pone.0030703. [DOI] [PMC free article] [PubMed] [Google Scholar]
- 35.Obach M, et al. 6-Phosphofructo-2-kinase (pfkfb3) gene promoter contains hypoxia-inducible factor-1 binding sites necessary for transactivation in response to hypoxia. J Biol Chem. 2004;279(51):53562–53570. doi: 10.1074/jbc.M406096200. [DOI] [PubMed] [Google Scholar]
- 36.Itoh Y, et al. Brain glucose utilization in mice with a targeted mutation in the thyroid hormone alpha or beta receptor gene. Proc Natl Acad Sci USA. 2001;98(17):9913–9918. doi: 10.1073/pnas.171319498. [DOI] [PMC free article] [PubMed] [Google Scholar]
- 37.Herrero-Mendez A, et al. The bioenergetic and antioxidant status of neurons is controlled by continuous degradation of a key glycolytic enzyme by APC/C-Cdh1. Nat Cell Biol. 2009;11(6):747–752. doi: 10.1038/ncb1881. [DOI] [PubMed] [Google Scholar]
- 38.Zhang L, Cooper-Kuhn CM, Nannmark U, Blomgren K, Kuhn HG. Stimulatory effects of thyroid hormone on brain angiogenesis in vivo and in vitro. J Cereb Blood Flow Metab. 2010;30(2):323–335. doi: 10.1038/jcbfm.2009.216. [DOI] [PMC free article] [PubMed] [Google Scholar]
- 39.Ruiz de Almodovar C, et al. VEGF mediates commissural axon chemoattraction through its receptor Flk1. Neuron. 2011;70(5):966–978. doi: 10.1016/j.neuron.2011.04.014. [DOI] [PMC free article] [PubMed] [Google Scholar]
- 40.Lutz M, et al. Thyroid hormone-regulated enhancer blocking: Cooperation of CTCF and thyroid hormone receptor. EMBO J. 2003;22(7):1579–1587. doi: 10.1093/emboj/cdg147. [DOI] [PMC free article] [PubMed] [Google Scholar]
- 41.Fullwood MJ, Ruan Y. ChIP-based methods for the identification of long-range chromatin interactions. J Cell Biochem. 2009;107(1):30–39. doi: 10.1002/jcb.22116. [DOI] [PMC free article] [PubMed] [Google Scholar]
- 42.Herold M, Bartkuhn M, Renkawitz R. CTCF: Insights into insulator function during development. Development. 2012;139(6):1045–1057. doi: 10.1242/dev.065268. [DOI] [PubMed] [Google Scholar]
- 43.Lickwar CR, Mueller F, Hanlon SE, McNally JG, Lieb JD. Genome-wide protein-DNA binding dynamics suggest a molecular clutch for transcription factor function. Nature. 2012;484(7393):251–255. doi: 10.1038/nature10985. [DOI] [PMC free article] [PubMed] [Google Scholar]
- 44.Jho SH, et al. The book of opposites: The role of the nuclear receptor co-regulators in the suppression of epidermal genes by retinoic acid and thyroid hormone receptors. J Invest Dermatol. 2005;124(5):1034–1043. doi: 10.1111/j.0022-202X.2005.23691.x. [DOI] [PubMed] [Google Scholar]
- 45.Collingwood TN, Urnov FD, Chatterjee VK, Wolffe AP. Chromatin remodeling by the thyroid hormone receptor in regulation of the thyroid-stimulating hormone alpha-subunit promoter. J Biol Chem. 2001;276(36):34227–34234. doi: 10.1074/jbc.M105172200. [DOI] [PubMed] [Google Scholar]
- 46.Meijsing SH, Elbi C, Luecke HF, Hager GL, Yamamoto KR. The ligand binding domain controls glucocorticoid receptor dynamics independent of ligand release. Mol Cell Biol. 2007;27(7):2442–2451. doi: 10.1128/MCB.01570-06. [DOI] [PMC free article] [PubMed] [Google Scholar]
- 47.Hall JM, Korach KS. Analysis of the molecular mechanisms of human estrogen receptors alpha and beta reveals differential specificity in target promoter regulation by xenoestrogens. J Biol Chem. 2002;277(46):44455–44461. doi: 10.1074/jbc.M200849200. [DOI] [PubMed] [Google Scholar]
- 48.Zwart W, et al. Oestrogen receptor-co-factor-chromatin specificity in the transcriptional regulation of breast cancer. EMBO J. 2011;30(23):4764–4776. doi: 10.1038/emboj.2011.368. [DOI] [PMC free article] [PubMed] [Google Scholar]
- 49.Chiamolera MI, et al. Fundamentally distinct roles of thyroid hormone receptor isoforms in a thyrotroph cell line are due to differential DNA binding. Mol Endocrinol. 2012;26(6):926–939. doi: 10.1210/me.2011-1290. [DOI] [PMC free article] [PubMed] [Google Scholar]
- 50.Baxter JD, Webb P. Thyroid hormone mimetics: Potential applications in atherosclerosis, obesity and type 2 diabetes. Nat Rev Drug Discov. 2009;8(4):308–320. doi: 10.1038/nrd2830. [DOI] [PubMed] [Google Scholar]
- 51.Ladenson PW, et al. Comparison of administration of recombinant human thyrotropin with withdrawal of thyroid hormone for radioactive iodine scanning in patients with thyroid carcinoma. N Engl J Med. 1997;337(13):888–896. doi: 10.1056/NEJM199709253371304. [DOI] [PubMed] [Google Scholar]
- 52.Gilbert ME. Impact of low-level thyroid hormone disruption induced by propylthiouracil on brain development and function. Toxicol Sci. 2011;124(2):432–445. doi: 10.1093/toxsci/kfr244. [DOI] [PubMed] [Google Scholar]
- 53.Schriks M, Roessig JM, Murk AJ, Furlow JD. Thyroid hormone receptor isoform selectivity of thyroid hormone disrupting compounds quantified with an in vitro reporter gene assay. Environ Toxicol Pharmacol. 2007;23(3):302–307. doi: 10.1016/j.etap.2006.11.007. [DOI] [PubMed] [Google Scholar]
- 54.Bürckstümmer T, et al. An efficient tandem affinity purification procedure for interaction proteomics in mammalian cells. Nat Methods. 2006;3(12):1013–1019. doi: 10.1038/nmeth968. [DOI] [PubMed] [Google Scholar]
- 55.Livak KJ, Schmittgen TD. Analysis of relative gene expression data using real-time quantitative PCR and the 2(-Delta Delta C(T)) method. Methods. 2001;25(4):402–408. doi: 10.1006/meth.2001.1262. [DOI] [PubMed] [Google Scholar]
- 56.Storey JD, Dai JY, Leek JT. The optimal discovery procedure for large-scale significance testing, with applications to comparative microarray experiments. Biostatistics. 2007;8(2):414–432. doi: 10.1093/biostatistics/kxl019. [DOI] [PubMed] [Google Scholar]
- 57.Denver RJ, Hu F, Scanlan TS, Furlow JD. Thyroid hormone receptor subtype specificity for hormone-dependent neurogenesis in Xenopus laevis. Dev Biol. 2009;326(1):155–168. doi: 10.1016/j.ydbio.2008.11.005. [DOI] [PubMed] [Google Scholar]
Associated Data
This section collects any data citations, data availability statements, or supplementary materials included in this article.