

Abstract
Sphingolipids play important roles in plasma membrane structure and cell signaling. However, their lateral distribution in the plasma membrane is poorly understood. Here we quantitatively analyzed the sphingolipid organization on the entire dorsal surface of intact cells by mapping the distribution of 15N-enriched ions from metabolically labeled 15N-sphingolipids in the plasma membrane, using high-resolution imaging mass spectrometry. Many types of control experiments (internal, positive, negative, and fixation temperature), along with parallel experiments involving the imaging of fluorescent sphingolipids—both in living cells and during fixation of living cells—exclude potential artifacts. Micrometer-scale sphingolipid patches consisting of numerous 15N-sphingolipid microdomains with mean diameters of ∼200 nm are always present in the plasma membrane. Depletion of 30% of the cellular cholesterol did not eliminate the sphingolipid domains, but did reduce their abundance and long-range organization in the plasma membrane. In contrast, disruption of the cytoskeleton eliminated the sphingolipid domains. These results indicate that these sphingolipid assemblages are not lipid rafts and are instead a distinctly different type of sphingolipid-enriched plasma membrane domain that depends upon cortical actin.
Keywords: SIMS, stable isotope
Spatial organization of the lipids and proteins in the plasma membranes of eukaryotic cells is critical to coordinating lipid signaling and numerous other processes that occur at the cell surface (1). Thus, the hypothesis that lipids self-organize in compositionally and functionally distinct plasma membrane domains has been investigated for decades (2). Microdomains with a variety of lipid compositions and dependencies on lipid and protein interactions may exist in the plasma membrane (3–5), but the most compelling lipid microdomain is the lipid raft because such domains self-assemble in synthetic membranes (6, 7). Lipid rafts are defined as dynamic and small (10- to 200-nm) plasma membrane domains that are enriched with cholesterol and sphingolipids (6, 7). Despite intense research, the distributions of most lipid species, including cholesterol and sphingolipids, in cellular membranes are still difficult to determine (7). The ability to directly visualize specific lipid species without the use of potentially perturbing tags would help to address outstanding questions regarding distinct lipid domains in the plasma membrane (7–9).
Here we use a high-resolution chemical imaging approach to address the question: How are sphingolipids distributed in the plasma membranes of intact cells? We focused on sphingolipids because (i) they are postulated to be segregated within compositionally distinct lipid domains, such as lipid rafts (10–12), and (ii) sphingolipid metabolites are signaling molecules that regulate cell survival and proliferation (13). We studied a transfected mouse fibroblast cell line that stably expresses influenza hemagglutinin (Clone 15 cell line) because the hemagglutinin clusters in their plasma membranes are thought to be associated with sphingolipid and cholesterol domains (10–12). Thus, we hoped to increase the probability of detecting sphingolipid-enriched plasma membrane domains by using the Clone 15 cell line.
To visualize the sphingolipids within the plasma membrane, we isotopically labeled them and then mapped their distributions in the plasma membrane, using a secondary ion mass spectrometry (SIMS) instrument (Cameca NanoSIMS 50) with 50-nm lateral resolution and an analysis depth of <5 nm at the cell surface (14–16); this analysis depth is less than the thickness of the plasma membrane. Previous reports establish that NanoSIMS imaging does not alter biomolecule distribution within subcellular compartments or lipid membranes (14, 17–19). Thus, this approach enabled us to quantitatively determine the sphingolipid organization. Sphingolipids were segregated in ∼200-nm diameter microdomains that nonrandomly clustered into sphingolipid-rich plasma membrane patches with micrometer-scale dimensions. The effects of cholesterol depletion and cytoskeleton disruption on this sphingolipid organization indicate these sphingolipid assemblages are not lipid rafts and thus should at present be referred to as sphingolipid domains.
Results
Metabolic Labeling Achieved a High Level of Molecule-Specific 13C- and 15N-Incorporation.
We metabolically labeled Clone 15 cells, using uniformly 13C-labeled fatty acids and the 15N-sphingolipid precursors, 15N-sphingosine and 15N-sphinganine, such that the resulting 15N-sphingolipids (i.e., sphingomyelin, ceramide, and glycosphingolipids) reached a steady-state distribution in the plasma membrane without 15N-incorporation into proteins (20). The uniformly 13C-labeled fatty acids varied in chain length and degree of saturation to promote their incorporation into all sphingolipid and glycerolipid species, presumably producing an even distribution of 13C-lipids in the cell membrane. This global labeling of most lipids with carbon-13 allowed evaluation of plasma membrane integrity and detection of spatially dependent variations in analysis sensitivity or artifactual lipid clustering. Approximately 80% of the N-palmitoyl sphingomyelin, the most abundant cellular sphingolipid we detected, contained one 15N-isotope, and 13C16-palmitic acid was incorporated into ∼80% of the N-palmitoyl sphingomyelin (Fig. S1). Little (<2%) 15N-enrichment of phosphatidylethanolamine due to 15N-sphingolipid catabolism was detected (SI Methods), so 15N-incorporation into nonsphingolipid species was negligible. Using previously reported methods (21), we determined that ∼60% of the fatty acids in the cellular glycerolipids were uniformly 13C-labeled. The cells were prepared for SIMS analysis by chemical fixation in glutaraldehyde, followed by osmication, a procedure known to immobilize lipids because osmium tetroxide acts as a multivalent cross-linker (22). This procedure produces a membrane whose organization is retained during the inevitable drying process needed for introduction into the vacuum of the NanoSIMS analysis chamber (22). Well-preserved cells with intact microextensions and normal morphologies were identified by low-voltage scanning electron microscopy (SEM) imaging and subsequently analyzed with NanoSIMS.
NanoSIMS Images Show Sphingolipid-Enriched Domains in the Plasma Membrane.
The samples were coated with a thin (3-nm) iridium layer that prevents charging during NanoSIMS analysis; prior work establishes these metal coatings do not alter the lipid distribution at the cell surface (23). To visualize the distributions of 13C-lipids and 15N-sphingolipids in the plasma membrane, the 12C1H−, 13C1H−, 12C14N−, and 12C15N− secondary ions were simultaneously acquired in the NanoSIMS. Because ion count rates can vary with instrument tuning, sample topography, and other concentration-independent factors, quantitative 13C- and 15N-enrichment images were constructed by normalizing the lipid-specific ion counts at each pixel to the major species counts (i.e., 13C1H−/12C1H− or 12C15N−/12C14N−). This normalization works because the concentration-independent variations in count rates for the lipid-specific rare isotope (i.e., 12C15N−) are proportional to the concentration-independent variations in count rates for the corresponding abundant isotope species (i.e., 12C14N−) (14, 24, 25), as demonstrated by control experiments (Fig. S2). The resulting ratios are proportional to the local abundance of the isotopically labeled molecules. These ratios were divided by standard natural abundance ratios, producing “isotope enrichment factors” that quantify the amount of 13C-lipids and 15N-sphingolipids compared with unlabeled cells (24) (Fig. S2). The isotope enrichment factors were color coded and mapped to the corresponding pixel in the image. After calculating the moving average over a 3 × 3-pixel window, the lateral resolution of the enrichment image was 87 nm, compared with the 70-nm diameter of the analysis beam. Based on our operating conditions and the sputtering rate determined for biological samples (26), the sputtering depth (<2 nm) was much less than the plasma membrane’s thickness (7.5 nm) (27), ensuring that a minimum number of secondary ions were collected from the underlying cytoplasm.
Secondary electron images of the Clone 15 fibroblast cells were collected simultaneously to the secondary ions to allow the isotopic data to be related to cell location and morphology (Fig. 1 and Fig. S3). The high levels of 15N-isotope incorporation into the cellular sphingomyelin allowed the location and density of sphingolipids in the membrane to be mapped with a high signal-to-noise ratio. Local elevations in 15N-enrichment were dispersed within a matrix of lower 15N-enrichment on the surfaces of the Clone 15 cells (Fig. 2 and Fig. S3). Control experiments excluded the possibilities that these local elevations in 15N-enrichment were artifacts induced by cell topography (Fig. S2), the iridium coating (Fig. S4), or isotope-labeled material adsorbed to the cell (Fig. S5). Consequently, these local elevations in 15N-enrichment are plasma membrane domains enriched with 15N-sphingolipids. These sphingolipid microdomains were detected on every one of over 25 other cells studied. Based upon the analysis of 59,301 3 × 3-pixel subregions on the Clone 15 cell shown in Fig. 2, a 15N-enrichment factor ≥12 is at least 2 SD above the mean 15N-enrichment factor for the domain-free regions (mean 15N-enrichment factor for domain-free regions = 7.8, 1 SD = 2.1) and therefore represents a statistically significant elevation in the plasma membrane’s local 15N-sphingolipid enrichment. The 15N-sphingolipid–enriched domains on this cell (Fig. 2) and others (Fig. S3 and Table S1) were more abundant on the main body of the cell than on its extensions. Debris on the substrate near the cell was also enriched with 15N-sphingolipids, consistent with reports that fibroblasts deposit lipids along with other cellular material when migrating (28).
Fig. 1.

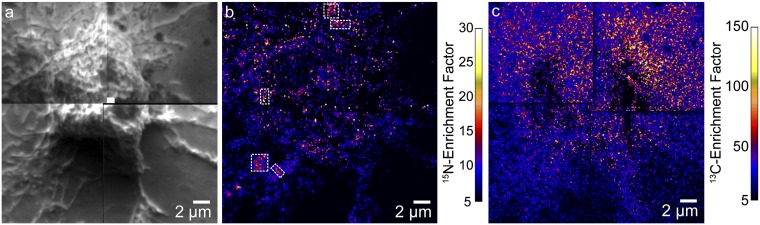
Secondary electron images of a Clone 15 fibroblast cell were acquired in parallel with the secondary ion signals, using NanoSIMS. Montage of 15 × 15-μm secondary electron images shows the morphology of a representative Clone 15 cell (cell 1).
Fig. 2.

Montage of 15N-enrichment images shows the 15N-sphingolipid distribution on the Clone 15 fibroblast cell (cell 1). The color scale represents the measured 12C15N−/12C14N− ratio divided by the natural abundance ratio, corresponding to the 15N-sphingolipid enrichment compared with an unlabeled cell (Fig. S2). The mean 15N-enrichment factors for domain-free regions and the entire cell are 7.8 (open arrowhead, SD = 2.1) and 9.5 (solid arrowhead, SD = 3.6), respectively. Lateral variations in the 15N-sphingolipid abundance are visible. Consistent with reports that fibroblasts deposit membrane fragments when migrating, 15N-sphingolipid–enriched debris is present on the substrate (28). The enlarged views of the secondary electron, 13C-enrichment, and 15N-enrichment images that were acquired at the outlined region on the cell (Inset) demonstrate that the 15N-sphingolipid domains do not coincide with cell topography or excess cellular lipids. The color scale for the 13C-enrichment image shown in the Inset is provided in Fig. 3.
Because the 15N-sphingolipid assemblages were larger than expected, we carefully inspected the 13C-lipid distribution shown in the 13C-enrichment images for signs of membrane defects or spatially dependent variations in detection sensitivity. The specificity of the elevated 13C-enrichment to 13C-lipids was confirmed by its localization at the surfaces of identically labeled cells and at distinct regions in their cytoplasm that likely correspond to organelle membranes (Fig. S6). Therefore, the continuously elevated 13C-enrichments detected on the Clone 15 cells in Fig. 3 and Fig. S3 confirm their plasma membranes were intact, and the regions of lower 15N-sphingolipid abundance are not artifacts of membrane damage. The absence of statistically significant variations in the 13C-enrichment on the surfaces of the cells as a function of distance from the nucleus indicates the analysis sensitivity was laterally uniform. Finally, we tested whether the local elevations in 15N-sphingolipid abundance reflected an excess of all cellular lipids, which could be caused by intracellular membranes adjacent to the plasma membrane or fixation-induced lipid aggregates. An excess of cellular lipids at the sites of 15N-sphingolipid enrichment produces a concomitant statistically significant elevation in the 13C-enrichment (Fig. S7, Kolmogrov–Smirnov test, h = 1, P < 10−32). For the Clone 15 cell shown in Fig. 2, the 13C-enrichment factors in the domains are not statistically higher than in the nondomain regions (Kolmogrov–Smirnov test, h = 0, P = 0.60). This confirms the local 15N-sphingolipid enrichment in the plasma membrane was not caused by intracellular membranes or artifactual lipid clustering.
Fig. 3.

13C-enrichment images of a Clone 15 fibroblast cell were acquired in parallel with the secondary electron (Fig. 1) and 15N-enrichment (Fig. 2) images. Montage of quantitative 13C-enrichment images reveals the distribution of all lipids in the plasma membrane of the Clone 15 cell (cell 1). The color scale shows the measured 13C1H−/12C1H− ratio divided by the natural abundance ratio, corresponding to the 13C-lipid enrichment compared with an unlabeled cell (Fig. S2). The mean 13C-enrichment for the entire surface of the cell was 16.3 (arrowhead, SD = 22.5). The elevated 13C-enrichment and the absence of statistically significant lateral variations in the 13C-enrichment on the cell verify the plasma membrane was intact. Speckling is due to low counts of the CH isotopologues.
Sphingolipid Organization Is Not Altered by Chemical Fixation.
We investigated the possibility that our fixation procedure altered the sphingolipid distribution in the plasma membrane. First, we assessed whether glutaraldehyde cross-linking caused the sphingolipids to cluster in the plasma membrane by comparing the distributions of fluorescent sphingolipid analogs in the plasma membranes of living and glutaraldehyde-fixed Clone 15 cells. Fluorescent sphingolipid analogs were biosynthetically incorporated by metabolically labeling Clone 15 cells with borondipyrromethene (BODIPY)-sphingosine for 2 h. Then the cells were incubated in unlabeled growth medium for 2 h to allow for the removal of nonspecifically adsorbed material from the cell surface and delivery of newly synthesized BODIPY-sphingolipids to the plasma membrane. Total internal reflection fluorescence microscopy (TIRFM) imaging at 37 °C of the bottom of the cell revealed a fluorescent plasma membrane that contained patches of high fluorescence (Fig. 4 and Fig. S6). These fluorescent patches were stable for several minutes and did not exhibit the movement that is characteristic of transport vesicles, indicating these patches were plasma membrane domains enriched with BODIPY-sphingolipids. Like the 15N-sphingolipid domains detected with high-resolution SIMS, the fluorescent sphingolipid patches were irregularly shaped with dimensions between ∼300 nm and 2 µm, and they appeared to be more abundant near the center of the cell. Although the microextensions of this Clone 15 cell appear to be highly fluorescent in the background-corrected image (Fig. 4A), they have the same fluorescence intensities as the nondomain regions on the cell in the image without background correction (Fig. S8). Thus, the high fluorescence on the cell’s microextensions is an artifact of the background correction used to increase the contrast of the domains and does not signify a local enrichment in BODIPY-sphingolipids. Subsequent glutaraldehyde fixation reduced the contrast in the fluorescence microscopy image, but did not alter the appearance or induce the formation of BODIPY-sphingolipid domains in the plasma membrane (Fig. 4). These results indicate the 15N-sphingolipid domains detected with SIMS were not cross-linked aggregates caused by fixation.
Fig. 4.

TIRFM detection of BODIPY-sphingolipids in the plasma membrane of a Clone 15 cell at 37 °C. Stacks of 120 frames were acquired before and after fixation. Images were background subtracted and averaged through the stack to improve signal-to-noise ratio. (A) BODIPY-sphingolipid domains are visible in the plasma membrane of the living Clone 15 cell under physiological conditions. (B and C) Enlarged view of the region outlined in A shows the BODIPY-sphingolipid membrane domains (B) in the living cell and (C) following glutaraldehyde fixation. The sizes and distributions of the sphingolipid domains were unaltered by fixation. The high fluorescence of the cellular microextensions is an artifact of background correction and does not represent a local enrichment of sphingolipids; these microextensions have the same fluorescent intensities as the nondomain regions on the cell in the image without background correction (Fig. S8).
Additional control experiments were performed to test whether room temperature fixation or any other unavoidable exposure to subphysiological temperatures before fixation caused nanoscale sphingolipid domains to coalesce into the assemblages we observed with SIMS. Low temperatures can induce phase separation in model membranes and sphingolipid clustering in the plasma membranes of unfixed cells (29, 30). This redistribution of lipids does not occur when the cells are preserved with aldehyde fixatives similar to those we used before their exposure to subphysiological temperatures (29). Thus, lipid rearrangement could have occurred in our experiments only when the cells were removed from their incubator and subsequently exposed to room temperature (RT) glutaraldehyde solution. We compared Clone 15 cells that were chemically fixed with RT and 37 °C glutaraldehyde solutions. The 15N-sphingolipid microdomains on the cells fixed at 37 °C (Fig. S9) were similar in appearance to those in the membranes of cells fixed at RT. Thus, RT fixation did not induce the formation of 15N-sphingolipid domains in the plasma membrane.
To assess whether RT fixation increased the size or abundance of the 15N-sphingolipid domains on the cell surface, we compared the mean sphingolipid domain size and surface coverage on cells fixed with RT and 37 °C glutaraldehyde solutions. By visual inspection, both sets of cells exhibited 15N-sphingolipid–enriched plasma membrane domains with circular and oblong morphologies, where the domain’s longest axis ranged from ∼100 nm to 2 μm. By using a particle definition algorithm to quantitatively define the sphingolipid domains (SI Methods), we determined each Clone 15 cell that was fixed at 37 °C had >1,400 sphingolipid-enriched domains that covered 8–13% of the cell surface (Table S1). Similar sphingolipid domain surface coverage was measured on each Clone 15 cell fixed at RT (9–15%). Because the majority of the sphingolipid domains were oblong (Fig. 5 A–C), we quantified their area and equivalent diameter, which is the diameter of a circular region with the same area. The sphingolipid domains on the cells fixed with RT glutaraldehyde solution had mean areas between 0.029 and 0.038 μm2 and mean equivalent diameters between 180 and 205 nm (Table S1). Similar sphingolipid domain areas and diameters were measured on the cells fixed at 37 °C (Fig. 5D and Table S1). Thus, the glutaraldehyde fixation temperature and kinetics did not affect the surface coverage or size of the sphingolipid domains.
Fig. 5.

Sphingolipid-enriched domain size and spatial distribution. (A) White outlines show the perimeters of the 15N-sphingolipid domains (defined with a particle definition algorithm) in a portion of the 15N-enrichment image shown in Fig. 2. (B and C) The locations of the 15N-sphingolipid domains are outlined on the corresponding (B) secondary electron image (black) and (C) 13C-enrichment image (white). (D) The frequency distributions of sphingolipid domain sizes measured on cells fixed with glutaraldehyde solution at either RT or 37 °C or treated with mβCD show these treatments did not affect microdomain size. (E) Plot of Ripley’s K-test statistic, L(r) – r, as a function of distance. Data are normalized so the 99% CI (CI 99, dashed line) = 1. L(r) – r exceeds the CI 99 for all accessible distances >0.2 μm regardless of fixation temperature, signifying nonrandom microdomain clustering. mβCD treatment decreased domain clustering at distances >2 μm. (F) Plot of the difference between the frequency distribution of nearest neighbor (NN) domain distances measured for the observed (expt) domains (Inset) and a simulated (sim) random domain distribution on the cell body vs. distance. For all treatments, NN distances of ∼200 nm occurred more often than expected for a random distribution. (G) Difference in the pairwise domain distances (PD) measured for the observed and simulated randomly distributed domains is plotted as a function of distance. For both fixation temperatures, the higher occurrence of domain–domain distances between 5 and 10 μm than expected for randomly distributed domains (Inset) indicates the microdomain clusters were more abundant within 5- to 10-μm diameter patches on the cell body. Treatment with mβCD disrupted this long-range microdomain organization.
The aforementioned finding that most domains had effective diameters ≤300 nm (Fig. 5D) implies that the micrometer-size domains visible on the cells were clusters of multiple microdomains. We evaluated whether the temperature of fixation influenced this sphingolipid microdomain clustering. Because the sphingolipid microdomain densities were higher on the bodies of the cells than on their extensions (Table S1), we quantitatively assessed whether the sphingolipid microdomains were nonrandomly clustered on the body of each cell. We first used the coordinates for the centers of the sphingolipid microdomains located on the cell body to calculate Ripley’s K-test statistic, L(r) – r, as a function of distance (Fig. 5E) (10). For both fixation temperatures, the L(r) – r values are larger than the 99% confidence interval (CI 99) (data are normalized so that the CI 99 = 1) at radial distances between 0.2 and 5 μm, indicating the sphingolipid domains on the cell body were clustered over distances of 0.2 and 5 μm.
Evaluation of nearest neighbor distances, which is a measure of the shortest distance from the center of a sphingolipid microdomain to the center of the closest domain, supported the finding of nonrandom domain clustering on short length scales for both fixation temperatures. The nearest neighbor domain distances exhibited a maximum frequency between 200 and 300 nm, regardless of fixation temperature (Fig. 5F, Inset). This nearest neighbor distance is only slightly larger than the mean effective domain diameter, so the edges of most domains were <100 nm from those of their nearest neighbors. We also compared the frequency distributions for the observed microdomains to a simulated population of randomly distributed domains on the cell body. The plot of the difference between the frequencies of observed and simulated nearest neighbor distances would be a straight line at zero if the microdomains were randomly positioned on the cell body. Instead, the frequencies of nearest neighbor distances observed between 200 and 300 nm were higher than expected for a random distribution (Fig. 5F), and nearest neighbor distances between 300 and 800 nm occurred less frequently than expected. Thus, these microdomain clusters are a nonrandom characteristic of membrane organization.
The pairwise domain distances, the distances between the centers of all sphingolipid domains on the cell body, support our conclusion from Ripley’s K-test that the domains were nonrandomly clustered on long length scales (>1 μm) regardless of the fixation temperature. For all samples, pairwise domain distances between ∼3 and 10 µm were observed more frequently than expected for a population of randomly distributed domains, and distances between 15 and 20 µm usually occurred at a lower frequency than expected (Fig. 5G). This suggests the sphingolipid microdomains nonrandomly clustered into larger sphingolipid-enriched patches that were more abundant in 3- to 10-µm–wide regions of the cell body.
Altogether, these results establish that fixation of the cells by glutaraldehyde at RT did not alter sphingolipid domain size or spatial distribution. We suggest that glutaraldehyde fixation immobilized the proteins and prevented any lipid reorganization that might be induced by RT fixation. These experiments support the hypothesis that the high-resolution SIMS images of the sphingolipid organization are snapshots of the sphingolipid distributions present in the living Clone 15 cells at 37 °C.
Cholesterol Influences Sphingolipid Domain Abundance and Organization.
Having verified that the nonrandom sphingolipid organization we observed represents native cell membrane structure, we briefly investigated the factors that hypothetically control sphingolipid organization. Cohesive cholesterol–sphingolipid interactions are postulated to drive the formation of the most well-studied sphingolipid-enriched membrane domain, the lipid raft (6, 7), so we first evaluated the effects of cholesterol depletion on sphingolipid organization. Methyl-β-cyclodextrin (mβCD) was used to reduce the cholesterol in the Clone 15 cells by 30% before fixation. This level of cholesterol depletion was used to minimize the changes in cell morphology and cytoskeletal organization that mβCD is reported to induce (31–33); minor changes in cell morphology were visible in the low-voltage SEM images that were acquired before the NanoSIMS analysis (Fig. 6A and Fig. S10). Microdomains enriched with 15N-sphingolipids were visible in the plasma membrane of the representative mβCD-treated Clone 15 cell (Fig. 6B). Five other mβCD-treated Clone 15 cells showed similar features (see Fig. S10 for examples). Like the Clone 15 cells with normal cholesterol levels, the 15N-sphingolipid microdomains were more abundant on the main bodies of the mβCD-treated cells than on their extensions (Table S1). The sizes of the sphingolipid microdomains and the average 15N-enrichments measured on the dorsal surfaces of the mβCD-treated cells were not lower than those of untreated cells (Tables S1 and S2). However, the fraction of the cell surface covered by sphingolipid microdomains was much lower for the mβCD-treated cells than for the untreated cells. Thus, cholesterol depletion significantly decreased the percentage of sphingolipids associated with domains and the sphingolipid microdomain abundance on the cell surface (Table S2). However, cholesterol depletion did not alter the overall sphingolipid concentration in the membrane, the sizes of the remaining domains, or their localization on the cell body.
Fig. 6.

Secondary electron microscopy (SEM) and NanoSIMS 15N-enrichment images of a cholesterol-depleted Clone 15 fibroblast cell. (A) Low-voltage SEM image of a cholesterol-depleted Clone 15 cell shows slight changes in cell morphology following cholesterol depletion. This low-voltage SEM image has lower contrast than the secondary electron images that were acquired with NanoSIMS. (B) Montage of 15N-enrichment images of the same cholesterol-depleted Clone 15 cell reveals lateral variations in the 15N-enrichment and, thus, 15N-sphingolipid distribution. The color scale shows the 15N-sphingolipid enrichment compared with an unlabeled cell (Fig. S2). The mean 15N-enrichments for domain-free regions and the entire cell are 8.9 (open arrowhead, SD = 6.4), and 10.3 (solid arrowhead, SD = 8.7), respectively.
We quantitatively assessed the effects of cholesterol depletion on the organization of the sphingolipid microdomains on the cell body. The amplitudes of L(r) – r for the mβCD-treated cells are larger than the 99% CI at radial distances between 0.2 μm and the longest accessible distance on each cell, indicating sphingolipid microdomain clustering persisted despite cholesterol depletion. However, the L(r) – r amplitudes for the mβCD-treated cells are smaller than those of the untreated cells at radial distances above 0.5 or 2 μm, depending on the individual cell (Fig. 5E). In addition, instead of increasing over all accessible length scales, L(r) – r for the mβCD-treated cells reached a maximum at distances between 1 and 2 µm and then decreased with increasing distance. These data suggest that cholesterol depletion considerably decreased sphingolipid microdomain clustering on length scales above 2 µm, but not below 1 μm. The nearest neighbor and pairwise microdomain distances for the mβCD-treated cells supported this conclusion. The nearest neighbor domain distance plots and the plots of the differences between the frequencies of observed and simulated nearest neighbor distances on the mβCD-treated cells were very similar to those for the untreated cells (Fig. 5F). In contrast, the pairwise domain distance plots for the mβCD-treated cells were very different from each other and from those of the untreated cells (Fig. 5G). This change in the long-range, but not short-range, sphingolipid microdomain organization that was induced by 30% reduction in cellular cholesterol suggests that favorable cholesterol–sphingolipid interactions do not control nonrandom sphingolipid distribution in the plasma membrane.
Sphingolipid Domains Are Highly Dependent on the Cytoskeleton.
We briefly probed the alternate hypothesis that the cytoskeleton and its associated proteins control membrane lipid organization. We disrupted the cytoskeleton in Clone 15 cells by exposing them to the actin-depolymerizing drug, latrunculin A (lat-A) (34), and assessed the effects on the sphingolipid domains in the plasma membrane. The extensive rounding of the cell shown in the NanoSIMS secondary electron images (Fig. 7A) confirms the lat-A treatment disrupted the cytoskeleton in this Clone 15 cell. In contrast to the cells with intact cytoskeletons, the 15N-sphingolipids on the body of the lat-A–treated cell were not enriched within micrometer-scale domains and instead appeared to be randomly distributed (Fig. 7B). Only a few 15N-sphingolipid aggregates that approach the dimensions of the large 15N-sphingolipid domains observed on the untreated Clone 15 cells are visible on the mesh of thin extensions that stem from the rounded cell body. The 13C-lipids were fairly evenly distributed on the cell surface, although lower abundances of 13C-lipids were detected at the lower left and right sides of the rounded cell body. The presence of 13C-lipids on the substrate adjacent to the cell body suggests that membrane fragments detached from the cell when rounding occurred (Fig. 7C). On the basis of these results, we conclude that an intact cytoskeleton is obligatory for sphingolipid-enriched plasma membrane domains.
Fig. 7.
Secondary electron, 15N-enrichment, and 13C-enrichment images of a Clone 15 cell that was treated with lat-A for 30 min to disrupt the cytoskeleton. (A) Montage of secondary electron images acquired with NanoSIMS shows the extensive cell rounding that is characteristic of cytoskeleton disruption by lat-A treatment. (B) Montage of 15N-enrichment images of the same cell shows that micrometer-scale sphingolipid domains were not present on the cell surface after disruption of the cytoskeleton by treatment with lat-A. A few micrometer-scale 15N-sphingolipid aggregates are present on the cellular extensions adjacent to the rounded cell body (outlined with a dashed white line). (C) Montage of 13C-enrichment images shows the 13C-lipid distribution at the same location. The high 13C-enrichment on the substrate adjacent to the cell likely signifies the presence of membrane fragments.
Membrane Organization Is Not Determined by Hemagglutinin–Sphingolipid Interactions.
We also briefly investigated the hypothesis that favorable interactions between the influenza hemagglutinin clusters and sphingolipids in the plasma membrane (10–12) induced the sphingolipid domains we observed. As a first test for cohesive sphingolipid–hemagglutinin interactions, we used fluorescence microscopy to assess whether BODIPY-sphingolipids and immunolabeled hemagglutinin colocalized in the membranes of Clone 15 cells. Clone 15 cells that contained metabolically incorporated BODIPY-sphingolipids were labeled with Cy5.5-labeled antihemagglutinin Fab fragments. TIRFM images of a living Clone 15 cell reveal the basal membrane contained elongated and irregularly shaped BODIPY-sphingolipid domains (Fig. 8A, green) and circular hemagglutinin clusters (Fig. 8B, red). The overlay of the two channels (Fig. 8C) shows that despite their dissimilar morphologies, some of the hemagglutinin clusters were partially colocalized with BODIPY-sphingolipid domains, suggesting that hemagglutinin may have some affinity for sphingolipid domains. Next, we tested whether the affinity between hemagglutinin and sphingolipids induced domain formation by imaging the 15N-sphingolipids on metabolically labeled mouse fibroblast cells that did not express hemagglutinin (NIH 3T3 cell line, the parent line from which Clone 15 was derived). Plasma membrane domains enriched with 15N-sphingolipids (Fig. 9) were visible in the 15N-enrichment images of the NIH 3T3 fibroblast. The similarity in the appearance of these 15N-sphingolipid domains to those in the membranes of the analogous hemagglutinin-expressing Clone 15 cells indicates hemagglutinin did not alter the sphingolipid distribution in the plasma membrane or induce domain formation. Thus, the potential affinity between hemagglutinin and the sphingolipid domains does not influence sphingolipid distribution in the plasma membrane.
Fig. 8.
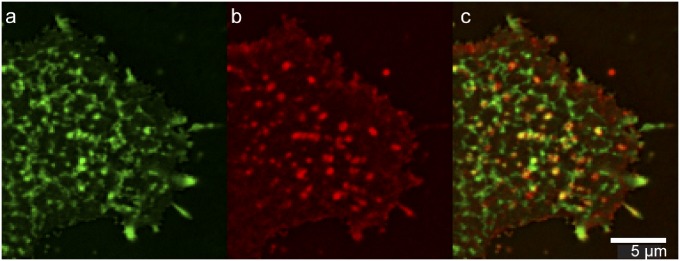
(A and B) TIRFM detection of (A) BODIPY-sphingolipids (green) and (B) influenza hemagglutinin (red) in the plasma membrane of a living Clone 15 cell at 37 °C. (C) Overlay of the two images shows colocalization between the sphingolipids and hemagglutinin, denoted by the yellow color. Stacks of 120 frames were collected for each channel and averaged to increase signal-to-noise ratio. Final images are shown at 2× magnification without interpolation. The influenza hemagglutinin and sphingolipid domains were partially colocalized.
Fig. 9.

Metabolically labeled mouse fibroblast cell that does not express influenza hemagglutinin (NIH 3T3 cell line, the parent line from which Clone 15 was derived) was chemically fixed and imaged with SIMS. (A) Montage of secondary electron images of the NIH 3T3 fibroblast that were acquired with NanoSIMS. Cracks (arrows) occurred after cell dehydration. (B) Montage of 15N-enrichment images that were acquired in parallel to the secondary electron images shows plasma membrane domains enriched with 15N-sphingolipids.
Discussion
We can now refute the hypotheses that sphingolipid-enriched domains in the plasma membrane are nanoscopic or nonexistent (7–9), as we have directly imaged domains of sphingolipids on the dorsal surfaces of intact cells by combining metabolic labeling with high-resolution SIMS. Sphingolipids are enriched within ∼200-nm diameter membrane microdomains that cluster into larger domains primarily within 5- to 10-μm diameter patches on the cell body. These sphingolipid domains are highly dependent on the cytoskeleton, but not on hemagglutinin, and their clustering is perturbed by cholesterol depletion. These domains cannot be attributed to label-induced perturbations in molecular interactions or sphingolipid trafficking because the 15N-sphingolipids we imaged were biosynthesized by the cell and they have the same chemical structure as native sphingolipids. Although we acquired chemical images of fixed cells, our data indicate that they represent snapshots of the sphingolipid organizations that were present in living Clone 15 cells. This conclusion is supported by (i) exclusion of artifactual elevations in the local 15N-sphingolipid abundance caused by vesicles adjacent to the membrane, isotopically labeled debris on the cell surface, or nonspecific lipid clustering induced by cell preservation; (ii) absence of changes in the fluorescent sphingolipid organization during and following glutaraldehyde fixation; (iii) similarity in the appearance of the 15N-sphingolipid domains detected with SIMS and the fluorescent sphingolipid domains imaged in the membranes of living cells by TIRFM; (iv) exclusion of temperature-induced sphingolipid reorganization during preservation; and (v) analytical controls. These experiments lay to rest the debate over the existence of compositionally distinct lipid domains in the plasma membrane that has been in the literature for decades and lead us to reject models of membrane organization that feature spatially homogeneous lipid compositions.
We undertook this study with Clone 15 cells because we expected these cells contained sphingolipid domains that could be detected with NanoSIMS. This expectation was based on the hypothesis that the micrometer-scale patches of darkly staining membrane lipids associated with the influenza hemagglutinin clusters were cholesterol- and sphingolipid-enriched rafts that coalesced due to favorable interactions with hemagglutinin (10, 12). Although we detected sphingolipid domains in the plasma membranes of the Clone 15 cells, our findings largely contradicted this hypothesis. Hemagglutinin–sphingolipid interactions were not required for sphingolipid domain formation. Likewise, the incomplete colocalization between the hemagglutinin and sphingolipid domains in Clone 15 cells suggests that the putative raft-associated protein, hemagglutinin (10, 12), is not a reliable marker for sphingolipid domains. Moreover, the properties of the sphingolipid domains we observed, which include their micrometer-scale dimensions and their responses to cellular cholesterol reduction, are inconsistent with those of lipid rafts. Specifically, although the abundance and organization of the sphingolipid domains were influenced by cholesterol, nonrandom sphingolipid clustering was more drastically affected by cytoskeleton disruption than by cholesterol depletion. In fact, the altered sphingolipid organization observed after mβCD treatment was likely caused by cholesterol depletion-induced changes in cytoskeleton organization (31–33, 35) and not by a loss of cohesive cholesterol–sphingolipid interactions. Because the cholesterol–sphingolipid interactions seem to play a minor role in sphingolipid domain formation, we conclude that the sphingolipid domains are not lipid rafts and are instead a distinctly different sphingolipid-enriched plasma membrane domain. On the basis of reports of a size difference between GM1 and GM3 domains and their segregation from one another (4, 36, 37), we expect that the plasma membrane contains multiple types of microdomains that differ in sphingolipid subspecies composition and size. Accordingly, the micrometer-scale sphingolipid patches we observed in the Clone 15 cells likely consist of microdomains that are each enriched with a different sphingolipid subspecies. Further studies involving the simultaneous imaging of numerous sphingolipid subspecies are required to test these hypotheses.
If the plasma membrane contains sphingolipid domains with up to micrometer-scale dimensions, why are sphingolipid-enriched plasma membrane domains widely expected to have diameters below 200 nm? The expectation of nanometer-scale sphingolipid domains is primarily based on the assumption that all sphingolipid domains are lipid rafts, which are defined as nanoscale domains that are enriched with sphingolipids, cholesterol, and glycosylphosphatidylinositol(GPI)-anchored proteins (6, 7). Consequently, consideration must be given to how raft size has been deduced. Because cohesive interactions between cholesterol, sphingolipids, and GPI-anchored proteins are postulated to induce lipid raft formation, domain sizes <200 nm have been inferred from the cholesterol-dependent clustering and diffusion of GPI-anchored proteins and sphingolipids (36, 38–40). However, numerous studies have demonstrated that the clustering and hindered diffusion of GPI-anchored proteins and lipids are regulated by cortical actin organization, which is perturbed by cholesterol depletion (4, 32, 41–44). The indirect relationship between cholesterol-dependent biophysical properties and the local lipid composition in the plasma membrane renders inferring sphingolipid domain size from biophysical behavior less reliable than directly imaging the sphingolipid components. Visualization of sphingolipid distribution via use of fluorescently labeled sphingolipid analogs or sphingolipid-specific affinity labels has revealed plasma membrane domains that differ in sphingolipid subspecies composition and size (4, 36, 37, 45–47). As mentioned above, GM1 and GM3 are located in separate domains that have diameters <300 nm (4, 36, 37), whereas sphingomyelin is enriched in plasma membrane domains with micrometer-scale dimensions (45–47). Because micrometer-scale sphingomyelin domains are inconsistent with the expected size range for lipid rafts, these findings have been largely dismissed as artifacts caused by fluorophore-induced clustering or antibody cross-linking. Our fluorescence microscopy studies and use of a complementary chemical imaging method that employs nonperturbing stable isotope labels confirm that sphingolipid domains have micrometer-scale dimensions. Altogether, these findings indicate that the majority of sphingolipid domains in the plasma membrane are not lipid rafts, so the dimensions of sphingolipid domains cannot be inferred from properties ascribed to lipid rafts.
High-resolution SIMS detection of metabolically labeled sphingolipids provides direct evidence for micrometer-scale sphingolipid-enriched patches composed of numerous microdomains in the plasma membranes of fibroblast cells. These domains are organized in multiple hierarchical levels. Although their long-range organization is influenced by cholesterol depletion, the properties of the sphingolipid domains we observed indicate that they are not lipid rafts. Instead, our data support a model in which protein scaffolds consisting of the cytoskeleton and its associated proteins compartmentalize the plasma membrane (3, 5, 48). By adding a unique dimension of analysis—chemically specific compositional imaging at the scale of tens of nanometers—unique insight into the causes and functional consequences of plasma membrane organization is obtained.
Materials and Methods
Materials.
Uniformly 13C-labeled (98 atom%) fatty acids were from Cambridge Isotope Laboratories. Fatty acid-free BSA (FAFBSA) and 13C18-stearic acid (99 atom% 13C) were from Sigma. Lipid-reduced FBS (LR-FBS) and calf serum were from HyClone Laboratories. Poly-L-lysine and fixation reagents were from Electron Microscopy Sciences. Standard cell growth medium consisted of high-glucose Dulbecco’s modification of Eagle’s medium (DMEM) supplemented with 10% (vol/vol) calf serum, 104 units/mL penicillin G, and 10 mg/mL streptomycin. BODIPY-sphingosine and 15N-sphingolipid precursors (15N-sphingosine and 15N-sphinganine, 1:1 molar ratio) were synthesized as reported in refs. 49–51. The Clone 15 cell line was obtained by standard techniques for selecting stably transfected cells after transient expression in a NIH 3T3 mouse fibroblast line with a DNA plasmid for the hemagglutinin from the 1957 pandemic Japan strain of influenza.
Metabolic Labeling and Cholesterol Depletion.
Clone 15 cells were cultured in standard growth medium supplemented with 6.4 μM 15N-sphingolipid precursors at 37 °C in 5% CO2. Each subsequent day, 15N-sphingolipid precursors were added. After 3 d, cells were passaged into growth medium supplemented with 1% (vol/vol) calf serum, 10% (vol/vol) LR-FBS, 6.4 μM 15N-sphingolipid precursors, 215 μM 13C-fatty acids (4:1:28 mass ratio of UL-13C fatty acids/13C-stearic acid/FAFBSA), 50 μM cholesterol, and 2 μM ethanolamine. Each subsequent day, 1% (vol/vol) calf serum, 10% (vol/vol) LR-FBS, 15N-sphingolipid precursors, cholesterol, 13C-fatty acid mixture, and ethanolamine were added. On day 6, cells were passaged into dishes containing poly-L-lysine–coated 5 × 5-mm silicon substrates. The next day, substrates with adherent cells were prepared for NanoSIMS analysis. For experiments involving cholesterol depletion, cells were rinsed with PBS and incubated with 15 mL of 10 mM mβCD in DMEM for 15 min at 37 °C before preparation for NanoSIMS analysis. Labeling was assessed using cells attached to the culture dish. The cholesterol to total phospholipid fraction in the mβCD-treated cells and untreated cells was determined as reported in ref. 17. For cytoskeletal disruption experiments, cells attached to substrates were incubated in metabolic labeling growth medium supplemented with 0.83 μM of lat-A (stock solution: 100 μg lat-A in 1 mL ethanol) for 30 min at 37 °C and then were preserved.
Fluorescence Microscopy.
Cells were imaged using a TIRFM setup built around a Zeiss Axiovert 200 microscope equipped with a 100 × 1.45 NA objective and 488-nm laser (52). Cells were cultured in the presence of 2.5 μM BODIPY-sphingosine for 2 h at 37 °C followed by 2 h in unlabeled growth medium. For live cell imaging, cells were kept in DMEM with 2% (vol/vol) calf serum in sealed chambers maintained at 37 °C, using a temperature-controlled stage (Delta-T; Bioptech). Cells used for live-cell imaging were washed twice with PBS, fixed with 4% glutaraldehyde for 30 min, and reimaged. To visualize sphingolipid and hemagglutinin localization, live cells labeled with BODIPY-sphingosine were incubated with Fab fragments of Cy5.5-conjugated antihemagglutinin antibody at 37 °C for 20 min in the temperature-controlled stage. TIRFM imaging indicated the cells’ basal membranes were completely labeled with antihemagglutinin antibody after 20 min. Colocalization of the antihemagglutinin antibody with BODIPY-sphingolipid membrane domains was assessed using multicolor TIRFM (488- and 561-nm laser excitation).
Cell Preservation.
Substrates with adherent cells were rinsed with PBS and Hendry’s Phosphate Buffer (HPB). Cells were fixed for 30 min at RT or 37 °C in 4% glutaraldehyde in HPB, rinsed once for 5 min in HPB, and rinsed twice for 5 min in triple-distilled water. Cells were postfixed in 0.4% osmium tetroxide solution for 15 min at RT, rinsed thrice for 5 min in water, and air dried.
SIMS Analysis.
Samples were coated with ∼3 nm of iridium (99.95% Ir) to prevent charging during analysis as described in SI Methods. SIMS was performed on a Cameca NanoSIMS 50 at Lawrence Livermore National Laboratory with a 0.129-pA, 15-keV 133Cs+ primary ion beam focused onto a 69-nm spot. Four replicate scans of 512 × 512 pixels with a dwell time of 1 ms/pixel were acquired for each 15 × 15-µm analysis region, resulting in a pixel size (29 × 29 nm) smaller than the beam diameter. The 12C1H−, 13C1H−, 12C14N−, and 12C15N− secondary ions, and secondary electrons, were simultaneously collected. A mass resolving power of ∼6,700 was used to separate isobaric interferences from the isotopes of interest, e.g., 12C15N− from 13C14N− at mass 27. The primary ion dose was 4.48 × 10¹⁴ ions/cm2.
Image Analysis.
NanoSIMS data were processed with a custom software package (L’image; L. R. Nittler, Carnegie Institution of Washington, Washington, DC) run with PV-Wave (Visual Numerics). Quantitative 15N- and 13C-enrichment images showing the 15N-sphingolipid and 13C-lipid distributions, respectively, were constructed using a 3 × 3-pixel moving average smoothing algorithm. Isotope enrichment is the 12C15N−/12C14N− or 13C1H−/12C1H− ratio divided by standard natural abundance ratios (0.00367 and 0.011237, respectively). Statistical significance of the local elevations in 15N-enrichment was evaluated with the MATLAB Statistics Toolbox. Clustering, nearest neighbor distances, and domain–domain distances were assessed as reported in ref. 10.
Supplementary Material
Acknowledgments
We thank C. Ramon for technical assistance and L. R. Nittler for software development. Portions of this work were carried out in the Metabolomics Center in the Roy J. Carver Biotechnology Center, University of Illinois and the Frederick Seitz Materials Research Laboratory Central Facilities, University of Illinois, which is partially supported by the US Department of Energy under Grant DE-FG02-07ER46471. M.L.K. holds a Career Award at the Scientific Interface from the Burroughs Wellcome Fund. J.F.F. was supported by the National Institutes of Health Training Program in the Chemistry-Biology Interface (T32 GM070421). Work at Lawrence Livermore National Laboratory was supported by Laboratory Directed Research and Development funding and performed under the auspices of the US Department of Energy under Contract DE-AC52-07NA27344. This work was partially supported by the Intramural Program of the National Institute of Child Health and Human Development; National Institutes of Health; and by the National Science Foundation under Grant CHE-1058809.
Footnotes
The authors declare no conflict of interest.
*This Direct Submission article had a prearranged editor.
See Author Summary on page 2701 (volume 110, number 8).
This article contains supporting information online at www.pnas.org/lookup/suppl/doi:10.1073/pnas.1216585110/-/DCSupplemental.
References
- 1.Radhakrishnan K, Halász A, Vlachos D, Edwards JS. Quantitative understanding of cell signaling: The importance of membrane organization. Curr Opin Biotechnol. 2010;21(5):677–682. doi: 10.1016/j.copbio.2010.08.006. [DOI] [PMC free article] [PubMed] [Google Scholar]
- 2.Karnovsky MJ, Kleinfeld AM, Hoover RL, Klausner RD. The concept of lipid domains in membranes. J Cell Biol. 1982;94(1):1–6. doi: 10.1083/jcb.94.1.1. [DOI] [PMC free article] [PubMed] [Google Scholar]
- 3.Douglass AD, Vale RD. Single-molecule microscopy reveals plasma membrane microdomains created by protein-protein networks that exclude or trap signaling molecules in T cells. Cell. 2005;121(6):937–950. doi: 10.1016/j.cell.2005.04.009. [DOI] [PMC free article] [PubMed] [Google Scholar]
- 4.Fujita A, Cheng J, Fujimoto T. Segregation of GM1 and GM3 clusters in the cell membrane depends on the intact actin cytoskeleton. Biochim Biophys Acta. 2009;1791(5):388–396. doi: 10.1016/j.bbalip.2009.01.008. [DOI] [PubMed] [Google Scholar]
- 5.Neumann AK, Itano MS, Jacobson K. Understanding lipid rafts and other related membrane domains. F1000 Biol Rep. 2010;2:31. doi: 10.3410/B2-31. [DOI] [PMC free article] [PubMed] [Google Scholar]
- 6.Simons K, Gerl MJ. Revitalizing membrane rafts: New tools and insights. Nat Rev Mol Cell Biol. 2010;11(10):688–699. doi: 10.1038/nrm2977. [DOI] [PubMed] [Google Scholar]
- 7.Jacobson K, Mouritsen OG, Anderson RGW. Lipid rafts: At a crossroad between cell biology and physics. Nat Cell Biol. 2007;9(1):7–14. doi: 10.1038/ncb0107-7. [DOI] [PubMed] [Google Scholar]
- 8.Shaw AS. Lipid rafts: Now you see them, now you don’t. Nat Immunol. 2006;7(11):1139–1142. doi: 10.1038/ni1405. [DOI] [PubMed] [Google Scholar]
- 9.Leslie M. Mysteries of the cell. Do lipid rafts exist? Science. 2011;334(6059):1046–1047. doi: 10.1126/science.334.6059.1046-b. [DOI] [PubMed] [Google Scholar]
- 10.Hess ST, et al. Quantitative electron microscopy and fluorescence spectroscopy of the membrane distribution of influenza hemagglutinin. J Cell Biol. 2005;169(6):965–976. doi: 10.1083/jcb.200412058. [DOI] [PMC free article] [PubMed] [Google Scholar]
- 11.Polozov IV, Bezrukov L, Gawrisch K, Zimmerberg J. Progressive ordering with decreasing temperature of the phospholipids of influenza virus. Nat Chem Biol. 2008;4(4):248–255. doi: 10.1038/nchembio.77. [DOI] [PubMed] [Google Scholar]
- 12.Scheiffele P, Roth MG, Simons K. Interaction of influenza virus haemagglutinin with sphingolipid-cholesterol membrane domains via its transmembrane domain. EMBO J. 1997;16(18):5501–5508. doi: 10.1093/emboj/16.18.5501. [DOI] [PMC free article] [PubMed] [Google Scholar]
- 13.Hannun YA, Obeid LM. Principles of bioactive lipid signalling: Lessons from sphingolipids. Nat Rev Mol Cell Biol. 2008;9(2):139–150. doi: 10.1038/nrm2329. [DOI] [PubMed] [Google Scholar]
- 14.McMahon G, Glassner BJ, Lechene CP. Quantitative imaging of cells with multi-isotope imaging mass spectrometry (MIMS)–Nanoautography with stable isotope tracers. Appl Surf Sci. 2006;252(19):6895–6906. [Google Scholar]
- 15.Boxer SG, Kraft ML, Weber PK. Advances in imaging secondary ion mass spectrometry for biological samples. Annu Rev Biophys. 2009;38(1):53–74. doi: 10.1146/annurev.biophys.050708.133634. [DOI] [PubMed] [Google Scholar]
- 16.Lechene C, et al. High-resolution quantitative imaging of mammalian and bacterial cells using stable isotope mass spectrometry. J Biol. 2006;5(6):20. doi: 10.1186/jbiol42. [DOI] [PMC free article] [PubMed] [Google Scholar]
- 17.Anderton CR, Lou K, Weber PK, Hutcheon ID, Kraft ML. Correlated AFM and NanoSIMS imaging to probe cholesterol-induced changes in phase behavior and non-ideal mixing in ternary lipid membranes. Biochim Biophys Acta. 2011;1808(1):307–315. doi: 10.1016/j.bbamem.2010.09.016. [DOI] [PubMed] [Google Scholar]
- 18.Kraft ML, Weber PK, Longo ML, Hutcheon ID, Boxer SG. Phase separation of lipid membranes analyzed with high-resolution secondary ion mass spectrometry. Science. 2006;313(5795):1948–1951. doi: 10.1126/science.1130279. [DOI] [PubMed] [Google Scholar]
- 19.Steinhauser ML, et al. Multi-isotope imaging mass spectrometry quantifies stem cell division and metabolism. Nature. 2012;481(7382):516–519. doi: 10.1038/nature10734. [DOI] [PMC free article] [PubMed] [Google Scholar]
- 20.Chigorno V, et al. Metabolic processing of gangliosides by human fibroblasts in culture—formation and recycling of separate pools of sphingosine. Eur J Biochem. 1997;250(3):661–669. doi: 10.1111/j.1432-1033.1997.00661.x. [DOI] [PubMed] [Google Scholar]
- 21.Wilson RL, et al. Fluorinated colloidal gold immunolabels for imaging select proteins in parallel with lipids using high-resolution secondary ion mass spectrometry. Bioconjug Chem. 2012;23(3):450–460. doi: 10.1021/bc200482z. [DOI] [PMC free article] [PubMed] [Google Scholar]
- 22.Cheng J, et al. Quantitative electron microscopy shows uniform incorporation of triglycerides into existing lipid droplets. Histochem Cell Biol. 2009;132(3):281–291. doi: 10.1007/s00418-009-0615-z. [DOI] [PubMed] [Google Scholar]
- 23.Altelaar AFM, et al. Gold-enhanced biomolecular surface imaging of cells and tissue by SIMS and MALDI mass spectrometry. Anal Chem. 2006;78(3):734–742. doi: 10.1021/ac0513111. [DOI] [PubMed] [Google Scholar]
- 24.Lechene CP, Luyten Y, McMahon G, Distel DL. Quantitative imaging of nitrogen fixation within animal cells. Science. 2007;317:1563–1566. doi: 10.1126/science.1145557. [DOI] [PubMed] [Google Scholar]
- 25.Klitzing HA, Weber PK, Kraft ML. 2013. Secondary ion mass spectrometry imaging of biological membranes at high spatial resolution. Nanoimaging: Methods and Protocols, Methods in Molecular Biology, eds Sousa AA, Kruhlak MJ (Humana Press, Totowa, NJ), Vol 950, pp 483–501. [DOI] [PubMed]
- 26.Ghosal S, et al. Imaging and 3D elemental characterization of intact bacterial spores by high-resolution secondary ion mass spectrometry. Anal Chem. 2008;80(15):5986–5992. doi: 10.1021/ac8006279. [DOI] [PubMed] [Google Scholar]
- 27.Edidin M. Lipids on the frontier: A century of cell-membrane bilayers. Nat Rev Mol Cell Biol. 2003;4(5):414–418. doi: 10.1038/nrm1102. [DOI] [PubMed] [Google Scholar]
- 28.Regen CM, Horwitz AF. Dynamics of β1 integrin-mediated adhesive contacts in motile fibroblasts. J Cell Biol. 1992;119(5):1347–1359. doi: 10.1083/jcb.119.5.1347. [DOI] [PMC free article] [PubMed] [Google Scholar]
- 29.Chen Y, Qin J, Cai J, Chen ZW. Cold induces micro- and nano-scale reorganization of lipid raft markers at mounds of T-cell membrane fluctuations. PLoS ONE. 2009;4(4):e5386. doi: 10.1371/journal.pone.0005386. [DOI] [PMC free article] [PubMed] [Google Scholar]
- 30.Feigenson GW. Phase boundaries and biological membranes. Annu Rev Biophys Biomol Struct. 2007;36(1):63–77. doi: 10.1146/annurev.biophys.36.040306.132721. [DOI] [PMC free article] [PubMed] [Google Scholar]
- 31.Sun M, et al. The effect of cellular cholesterol on membrane-cytoskeleton adhesion. J Cell Sci. 2007;120(Pt 13):2223–2231. doi: 10.1242/jcs.001370. [DOI] [PubMed] [Google Scholar]
- 32.Kwik J, et al. Membrane cholesterol, lateral mobility, and the phosphatidylinositol 4,5-bisphosphate-dependent organization of cell actin. Proc Natl Acad Sci USA. 2003;100(24):13964–13969. doi: 10.1073/pnas.2336102100. [DOI] [PMC free article] [PubMed] [Google Scholar]
- 33.Qi M, Liu Y, Freeman MR, Solomon KR. Cholesterol-regulated stress fiber formation. J Cell Biochem. 2009;106(6):1031–1040. doi: 10.1002/jcb.22081. [DOI] [PubMed] [Google Scholar]
- 34.Spector I, Shochet NR, Kashman Y, Groweiss A. Latrunculins: Novel marine toxins that disrupt microfilament organization in cultured cells. Science. 1983;219(4584):493–495. doi: 10.1126/science.6681676. [DOI] [PubMed] [Google Scholar]
- 35.Kenworthy AK, et al. Dynamics of putative raft-associated proteins at the cell surface. J Cell Biol. 2004;165(5):735–746. doi: 10.1083/jcb.200312170. [DOI] [PMC free article] [PubMed] [Google Scholar]
- 36.Fujita A, et al. Gangliosides GM1 and GM3 in the living cell membrane form clusters susceptible to cholesterol depletion and chilling. Mol Biol Cell. 2007;18(6):2112–2122. doi: 10.1091/mbc.E07-01-0071. [DOI] [PMC free article] [PubMed] [Google Scholar]
- 37.Chen Y, Qin J, Chen ZW. Fluorescence-topographic NSOM directly visualizes peak-valley polarities of GM1/GM3 rafts in cell membrane fluctuations. J Lipid Res. 2008;49(10):2268–2275. doi: 10.1194/jlr.D800031-JLR200. [DOI] [PMC free article] [PubMed] [Google Scholar]
- 38.Pralle A, Keller P, Florin EL, Simons K, Hörber JK. Sphingolipid-cholesterol rafts diffuse as small entities in the plasma membrane of mammalian cells. J Cell Biol. 2000;148(5):997–1008. doi: 10.1083/jcb.148.5.997. [DOI] [PMC free article] [PubMed] [Google Scholar]
- 39.Lasserre R, et al. Raft nanodomains contribute to Akt/PKB plasma membrane recruitment and activation. Nat Chem Biol. 2008;4(9):538–547. doi: 10.1038/nchembio.103. [DOI] [PubMed] [Google Scholar]
- 40.Eggeling C, et al. Direct observation of the nanoscale dynamics of membrane lipids in a living cell. Nature. 2009;457(7233):1159–1162. doi: 10.1038/nature07596. [DOI] [PubMed] [Google Scholar]
- 41.Fujiwara T, Ritchie K, Murakoshi H, Jacobson K, Kusumi A. Phospholipids undergo hop diffusion in compartmentalized cell membrane. J Cell Biol. 2002;157(6):1071–1081. doi: 10.1083/jcb.200202050. [DOI] [PMC free article] [PubMed] [Google Scholar]
- 42.Goswami D, et al. Nanoclusters of GPI-anchored proteins are formed by cortical actin-driven activity. Cell. 2008;135(6):1085–1097. doi: 10.1016/j.cell.2008.11.032. [DOI] [PMC free article] [PubMed] [Google Scholar]
- 43.Mueller V, et al. STED nanoscopy reveals molecular details of cholesterol- and cytoskeleton-modulated lipid interactions in living cells. Biophys J. 2011;101(7):1651–1660. doi: 10.1016/j.bpj.2011.09.006. [DOI] [PMC free article] [PubMed] [Google Scholar]
- 44.Gowrishankar K, et al. Active remodeling of cortical actin regulates spatiotemporal organization of cell surface molecules. Cell. 2012;149(6):1353–1367. doi: 10.1016/j.cell.2012.05.008. [DOI] [PubMed] [Google Scholar]
- 45.Tyteca D, et al. Three unrelated sphingomyelin analogs spontaneously cluster into plasma membrane micrometric domains. Biochim Biophys Acta. 2010;1798(5):909–927. doi: 10.1016/j.bbamem.2010.01.021. [DOI] [PubMed] [Google Scholar]
- 46.Fujimoto T. GPI-anchored proteins, glycosphingolipids, and sphingomyelin are sequestered to caveolae only after crosslinking. J Histochem Cytochem. 1996;44(8):929–941. doi: 10.1177/44.8.8756764. [DOI] [PubMed] [Google Scholar]
- 47.Marks DL, Bittman R, Pagano RE. Use of Bodipy-labeled sphingolipid and cholesterol analogs to examine membrane microdomains in cells. Histochem Cell Biol. 2008;130(5):819–832. doi: 10.1007/s00418-008-0509-5. [DOI] [PMC free article] [PubMed] [Google Scholar]
- 48.Kusumi A, et al. Paradigm shift of the plasma membrane concept from the two-dimensional continuum fluid to the partitioned fluid: High-speed single-molecule tracking of membrane molecules. Annu Rev Biophys Biomol Struct. 2005;34(1):351–378. doi: 10.1146/annurev.biophys.34.040204.144637. [DOI] [PubMed] [Google Scholar]
- 49.Carner P, Park JM, Malecki E. A stereodivergent synthesis of D-erythro-sphingosine and D-threo-sphingosine from L-serine. J Org Chem. 1998;53(18):4395–4398. [Google Scholar]
- 50.Dondoni A, Perrone D. Synthesis of 1,1-dimethylethyl (S)-4-formyl-2,2-dimethyl-3-oxazolidinecarboxylate by oxidation of the alcohol. Org Synth. 2000;77:64–77. [Google Scholar]
- 51.Peters C, et al. Synthesis of borondipyrromethene (BODIPY)-labeled sphingosine derivatives by cross-metathesis reaction. J Org Chem. 2007;72(5):1842–1845. doi: 10.1021/jo062347b. [DOI] [PubMed] [Google Scholar]
- 52.Stenkula KG, Lizunov VA, Cushman SW, Zimmerberg J. Insulin controls the spatial distribution of GLUT4 on the cell surface through regulation of its postfusion dispersal. Cell Metab. 2010;12(3):250–259. doi: 10.1016/j.cmet.2010.08.005. [DOI] [PMC free article] [PubMed] [Google Scholar]
