

Abstract
Motivation: Most proteins interact with small-molecule ligands such as metabolites or drug compounds. Over the past several decades, many of these interactions have been captured in high-resolution atomic structures. From a geometric point of view, most interaction sites for grasping these small-molecule ligands, as revealed in these structures, form concave shapes, or ‘pockets’, on the protein’s surface. An efficient method for comparing these pockets could greatly assist the classification of ligand-binding sites, prediction of protein molecular function and design of novel drug compounds.
Results: We introduce a computational method, APoc (Alignment of Pockets), for the large-scale, sequence order-independent, structural comparison of protein pockets. A scoring function, the Pocket Similarity Score (PS-score), is derived to measure the level of similarity between pockets. Statistical models are used to estimate the significance of the PS-score based on millions of comparisons of randomly related pockets. APoc is a general robust method that may be applied to pockets identified by various approaches, such as ligand-binding sites as observed in experimental complex structures, or predicted pockets identified by a pocket-detection method. Finally, we curate large benchmark datasets to evaluate the performance of APoc and present interesting examples to demonstrate the usefulness of the method. We also demonstrate that APoc has better performance than the geometric hashing-based method SiteEngine.
Availability and implementation: The APoc software package including the source code is freely available at http://cssb.biology.gatech.edu/APoc.
Contact: skolnick@gatech.edu
Supplementary information: Supplementary data are available at Bioinformatics online.
1 INTRODUCTION
In a biological cell, small-molecule ligands, such as metabolites or drug compounds, constantly interact with their protein receptors. This gives rise to or modulates various aspects of protein function. Understanding how these interactions take place has been one key goal of many research efforts for several decades (Alberts, 2008). Accompanying the advance of structural determination techniques such as X-ray crystallography and NMR, tens of thousands of structures of proteins in complex with small-molecule ligands have been determined at atomic resolution and deposited in the Protein Data Bank (PDB) (Berman et al., 2000). Thus, there is a diverse collection of high-resolution snapshots of protein–ligand interactions that can be examined to help provide functional insight.
Ligand-binding sites on protein surfaces, where direct physical contacts form between small-molecule ligands and proteins, are of special interest. From a structural prospective, most of these sites are located within a concave-shaped structure known as a ‘pocket’ (Laskowski et al., 1996; Liang et al., 1998). Owing to this characteristic, a pocket may be detected through a geometrical analysis of protein structure. Consequently, a number of methods have been developed to predict ligand-binding sites exploiting the idea. Among them, SURFNET uses a sphere-filling technique to locate a pocket (Laskowski, 1995), POCKET (Levitt and Banaszak, 1992) and LIGSITE (Huang and Schroeder, 2006) adopt grid-based approaches and CAST identifies the pocket through Delaunay triangulation and the α-shape theory (Binkowski et al., 2003). Alternatively, several methods using energy-based or template-based strategies have also been proposed [see a recent review (Perot et al., 2010)]. It should be recognized that a protein surface is bumpy and the boundaries of pockets depend on a series of extrinsic (and to some extent arbitrary) choices, e.g. how far should a pocket extend towards the open space, and how high must a ridgeline be for it to delineate two disjoint, but adjacent, pockets versus a single united pocket.
The large number of available structures in the PDB provides opportunities for comparative studies of ligand-binding pockets (Gold and Jackson, 2006; Kahraman et al., 2007; Minai et al., 2008; Zhang and Grigorov, 2006). In general, small-molecule ligands can interact with proteins of different structural folds. Do pockets that recognize similar ligands share some common structural features? If such features exist, can we use it to predict protein function? To answer these questions, global structural comparison often is not adequate, and it is necessary to develop methods for local structural comparison dedicated to the geometric and/or physicochemical features of the protein pockets themselves. Among existing methods for pocket comparison, a heuristic maximum clique finding algorithm has been widely implemented, e.g. as in Cavbase (Schmitt et al., 2002), IsoCleft (Najmanovich et al., 2008) and SOIPPA (Xie and Bourne, 2008). In these methods, pockets are represented by pseudo-atoms, all-atoms or Cα atoms, and an associated graph is generated, wherein nodes are pairs of atoms from two pocket structures and edges represent a similarity relationship. The maximum clique found in this graph corresponds to the optimal alignment between the pocket structures. Another popular type of algorithm used for aligning pocket-lining residues is geometric hashing, e.g. SiteEngine (Shulman-Peleg et al., 2004). Instead of using atoms to represent a pocket, spherical harmonics (Morris et al., 2005) or 3D Zernike descriptors (Chikhi et al., 2010) have been proposed to describe protein pockets. The reduced pocket descriptors permit fast computation, but they do not return a detailed alignment of pocket residues, which is useful for certain studies, such as the identification of mutations corresponding to subtle changes of substrate specificity.
An existing pocket comparison method is usually tied with a specific pocket-detection procedure, and it is difficult to extend its usage to generic pockets detected by different procedures. This difficulty is partly caused by the fact that many scoring functions for measuring pocket similarity are dependent on the size of the pockets (Davies et al., 2007); different pocket detection methods can assign different sizes and/or numbers of pockets for the same structure. As in the case of a global structural alignment, a linear normalization of a similarity score by the size of a pocket does not eliminate the size-dependence issue, which is usually non-linear. Most approaches do not properly estimate the statistical significance of their similarity score. This becomes an issue when one performs large-scale comparisons of the entire PDB (Davies et al., 2007).
To address these issues, we introduce a new method, APoc, for the sequence order-independent structural alignment of pockets on protein surfaces. Below, a length-independent scoring function PS-score is first introduced. This is followed by a description of the algorithm, which includes iterative dynamic programming and iterative integer programming procedures to obtain an optimal sequence order-independent alignment between two protein pockets. We then introduce Subject/Control sets for large-scale benchmark tests, and describe the results of APoc on three types of pockets detected by different pocket-detection methods. Two interesting examples from the benchmark sets are presented. Finally, we compare the performance of APoc to a publicly available method SiteEngine.
2 METHODS
2.1 Scoring function
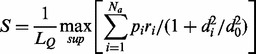
Previously, our group developed the Template Modelling score (TM-score) for measuring protein global structural similarity (Zhang and Skolnick, 2004, 2005) and the Interface Similarity score (IS-score) for evaluating protein–protein interface similarity (Gao and Skolnick, 2010a, b, 2011). Here, for measuring pocket similarity, we introduce the Pocket Similarity score (PS-score) that is based on backbone geometry, side-chain orientation and chemical similarity of the aligned pocket-lining residues. A typical study requires comparing a query pocket structure against a template library of pockets generated by some pocket-detection method, which we will describe below. The length of a pocket is defined by the number of Cα atoms of the pocket residues. Suppose an alignment is obtained between a query of length LQ and a template of length LT. The PS-score of the alignment is
| (1) |
 |
(2) |
| (3) |
| (4) |
Here, Na is the number of aligned residue pairs, di is the distance in Å between the Cα atoms of the ith aligned residue pair and the empirical scaling factor d0 ≡ 0.70(LQ − 5)1/4 − 0.2. The constants in d0 were obtained by fitting the distribution of Cα distances in random alignments of pockets. The factor pi measures, in the two pockets, the directional similarity between two Cα to Cβ vectors, which span an angle θi at the ith alignment position of two non-glycine residues. For glycine, the value of pi is assigned 1 if both amino acids are glycines and is assigned 0.77 if only one residue is glycine. The latter value is the mean pi derived from random alignments. The factor ri measures the chemical similarity of two aligned amino acids. The function  gives a value of 1 if the two amino acids
  belong to the same group (I–VIII) defined as: I (LVIMC), II (AG), III (ST), IV (P), V (FYW), VI (EDNQ), VII (KR), VIII (H) (Zhang and Grigorov, 2006), and 0 otherwise. The scaling factor s0 ≡ 0.23 − 12/LQ1.88 ensures that the score of the random pockets of similar length has a mean score independent of their length (see below).
To calculate the distance di and pi, aligned residues are superimposed with the Kabsch algorithm (Kabsch, 1976) to minimize the RMSD of the full or subset of aligned residues. Therefore, the number of all possible superpositions exponentially increases as the alignment length grows. The notation ‘max’ in Equation 2 indicates that the PS-score corresponds to the superposition that gives the maximum of all scores. In practice, a heuristic iterative extension algorithm is used to calculate the PS-score, similar to the one used for calculating the TM-score (Zhang and Skolnick, 2004). Note that identical pocket structures give a PS-score of one, which is the upper bound of the PS-score.
2.2 Alignment algorithm
To find the optimal alignment between two pockets, we adopted a strategy that is similar to iAlign, an algorithm for finding the optimal sequential alignment between two protein–protein interfaces (Gao and Skolnick, 2010a, b). A flowchart of the algorithm is illustrated in Figure 1. The algorithm has three major phases: In the first phase, several guessed solutions are generated through gapless alignments, secondary structure comparison, fragment alignments and local contact pattern alignments. Starting from these guessed alignments, dynamic programming is iteratively applied during the second phase. This yields optimal sequential alignments between two pocket structures. In the third phase, an iterative procedure is conducted to search for a non-sequential alignment between two pockets, which is then selected if this alignment gives a better PS-score than the optimal sequential alignment. The problem of finding an optimal non-sequential alignment (or match) is converted to the Linear Sum Assignment Problem (LSAP), which is a special case of integer programming and is also equivalent to the problem of finding a maximum weight matching in a weighted bipartite graph. To solve LSAP efficiently, we implemented the shortest augmenting path algorithm (Derigs, 1985), which has a polynomial time complexity of O(N3), where N = max(LT, LQ).
Fig. 1.

Flowchart of the APoc algorithm. Red/blue spheres represent backbone Cα atoms from the two pockets, arrows represent vectors pointing from the Cα to the Cβ and solid lines represent protein backbone traces. ‘Aln’ is the abbreviation for ‘alignment’
By default, our pocket program also performs a global structural alignment of the two full-length protein structures using the algorithm implemented in TM-align (Zhang and Skolnick, 2005). The feature is useful if one is also interested in comparing global structural similarity. Global alignment may also be used to produce an initial pocket alignment seed if the pocket regions are covered in the global alignment. In our benchmark test, this additional seed only gives a minor improvement; in <1% of cases does the PS-score increase by 0.01 or more.
2.3 Pocket detection
Three pocket-detection methods are used in this study. The first is LIGSITE (Huang and Schroeder, 2006), which is geometry based. A grid size of 1 Å and an SSS_threshold of 5 is used. LIGSITE is modified to report individual grid points within each pocket, and surface residues within 4.5 Å of these points are defined as pocket residues. The second is an in-house pocket-detection algorithm CAVITATOR that is very much in the spirit of LIGSITE, with a similar grid size, but which is designed to be less sensitive to minor structural distortions. Each heavy atom occupies the central grid point and all adjacent grid points within  Å. Thus, a single heavy atom occupies 27 grid points at a grid spacing of 1 Å. In order for a point to be part of a pocket, it must be bounded by occupied points on both sides along the X, Y or Z directions. The source code and Linux executable are available at http://cssb.biology.gatech.edu/Cavitator. Lastly, ligand-contacting residues on protein surface are detected by applying the program LPC (Sobolev et al., 1999). LPC requires structures of protein/ligand complexes and yields a list of observed ligand-binding pocket residues. By comparison, the first two methods do not use ligand information as part of the pocket-prediction procedure. When applying these methods, we consider pockets with >10 residues. Note that the pockets detected by the first two geometric methods are usually much larger than the corresponding pocket detected by LPC.
The volume detected by LIGSITE was used to calculate a normalized volume distance Dvol defined as Dvol ≡ (VT − VQ)2/(VTVQ)1/2.
2.4 Datasets
(i) Random Set1 (RS1). This set, composed of 5371 non-redundant single-chain protein structures up to 250 AAs each, is the primary random background for statistical significance analysis. Proteins in this set are culled at 35% global sequence identity. We applied CAVITATOR and LIGSITE separately to each structure in this set, and consider only the top pocket with the largest volume. We discarded pockets with 10 or fewer residues. This procedure yields 5016 pockets by CAVITATOR and 3401 pockets by LIGSITE. The latter has fewer pockets because it uses more stringent criteria to define a pocket. All-against-all pocket comparisons were conducted with APoc. We define a random pair of pockets if: (i) their global protein structures have low global structural similarity at a TM-score < 0.4 (normalized by the smaller protein) (Zhang and Skolnick, 2004) and (ii) <40% of the pocket residues are covered in the global structural alignment. This definition yields about 8.2 and 2.7 million random pairs of pockets by CAVITATOR and LIGSITE, respectively. The CAVITATOR random set is used to fit constants in formulas of the PS-score and parameters for the statistical models (see below). The LIGSITE dataset is reserved for testing purposes.
(ii) Random Set2 (RS2). This set consists of ∼140 000 randomly selected pairs of ligand-contacting pockets detected by LPC on holo-protein structures from the PDB. The dataset is curated from 81 756 entries in the PDB (May 2012 release). We consider small-molecule ligands that have at least six and fewer than 200 heavy atoms and do not include polypeptides or polynucleotides. This gives 37 325 PDB entries with at least one such ligand. In the PDB, each type of ligand is represented by a unique three-letter name known as the HET code. If one PDB entry contains multiple ligands with an identical HET code, we arbitrarily select the ligand making the most contacts with the protein. The primary protein chain that a ligand associates with is clustered at 90% sequence identity. In each cluster, we subsequently select a representative for each type of ligand, using X-ray structure resolution and number of contacts as the selection criteria. This procedure gives 10 645 types of ligands associated with 26 999 protein chains. The binding pocket of each ligand is obtained from LPC. All-against-all calculations of their pairwise Tanimoto coefficient (Tc) were conducted for all these ligands, using the 1024-bit version of Daylight fingerprints. We then randomly draw 200 000 pairs of pockets, each satisfying these conditions:
Tc < 0.25 between the two ligands,
Sequence similarity < 30% between the two associated proteins,
Length of pockets > 10 AAs,
Pocket length difference < 5%.
Following selection, to exclude globally similar protein structures, we further compare the global structural similarity of these protein chains and remove pairs whose global TM-score > 0.35. The final dataset consists of 143 735 randomly selected, observed ligand-binding pockets from holo-structures.
(iii) Bench Subject/Control Sets. Two sets are used to benchmark the performance of APoc. Complete linkage clustering was first conducted on unique ligands curated from the PDB (see above) at a Tc threshold of 0.5, which indicates a high level chemical similarity (the mean/sd of Tc is 0.16/0.12 among all ligands in the PDB). In each cluster, the ligand type most found frequently in the pockets of protein chains curated at 90% sequence identity is selected as the cluster representative, e.g. ADP represents a cluster of ligands including AMP, ATP, etc. Within each cluster, we used a graph-based algorithm, SIMCOMP (Hattori et al., 2010), to obtain the equivalence between heavy atoms of each pair of ligands. We collect atomic contacts between heavy atoms of the ligand and protein. Two ligand–protein contacts from two separate structures are of the same type if the ligand atoms are mapped each other in the SIMCOMP alignment and the protein residues belong to the same group defined above for Equation 4. We then define the Subject set as pairs of pockets such that:
Ligands found in these two pockets have a Tc ≥ 0.5,
Sequence similarity < 30% between the two associated proteins,
They share ≥ 50 atomic ligand–protein contacts of same type.
In total, we found 38 066 pairs of pockets for the Subject set. We expect that a significant number of entries in this set share a high level of pocket similarity because they recognize the same or similar types of ligands and likely possess a putative common anchor region due to the overlap of a large number of ligand-pocket contacts (Brylinski and Skolnick, 2009). Note that no geometric information is explicitly used in this procedure.
For the control set, we randomly selected the same number of pairs of pockets as in the subject set satisfying,
Ligands found in these two pockets have a Tc < 0.25,
Sequence similarity < 30% between the two proteins,
The global TM-score < 0.5.
The Subject and Control set contain pockets from 2090 and 21 660 unique protein chains from the PDB, respectively. Two ways of pocket detection were used to obtain observed and predicted pockets, respectively. Observed pockets are given by LPC, and predicted pockets are generated by LIGSITE. In case of predicted pockets, we consider successful pocket prediction as one that contains at least 80% of ligand-contact protein residues found by LPC. About 75% of LPC pockets are successfully predicted by LIGSITE.
2.5 Statistical significance
The statistical significance of the PS-score is estimated by comparing millions of randomly selected pocket pairs (see Dataset). Figure 2 shows the mean of the PS-scores on three sets of protein pockets generated by applying three independent pocket detection methods. In each set, we first consider pockets of similar length, i.e. the length of the template within 5% of the length of the query. Pockets of arbitrary lengths are considered next. The constants of the scaling factor defined in Equation 1 were obtained by fitting the un-scaled PS-scores calculated using Equation 2, such that the final PS-scores are approximately length-independent for random pockets of similar length. The constants were obtained on pockets found by CAVITATOR on RS1, and are further validated on other two sets of pockets detected by two independent pocket-detection methods, LIGSITE and LPC on RS1 and RS2, respectively. As shown in Figure 2, the mean PS-scores in the validation tests are similar to those of scores on the training set, which have a mean score of 0.308. The statistical significance of the PS-scores for pockets of similar length can be empirically estimated and are provided in Table 1. A PS-score of 0.4 is significant at P < 1×10⁻³. By comparison, the standard TM-score, which is designed as a length-independent metric for comparing protein global structures, varies dramatically from 0.16 to 0.40 when applied to the pockets (Fig. 2). As such, the TM-score is not ideal for measuring pocket similarity.
Fig. 2.

Mean scores of randomly selected similar length protein pockets. Pockets were detected by CAVITATOR and LIGSITE in RS1, a set of 5000 experimental protein structures, respectively, and by LPC in RS2, a set of protein–ligand complex structures curated from the PDB
Table 1.
Statistical significance of PS-scores derived empirically from random pockets of similar length
| PS-score | 0.35 | 0.38 | 0.40 | 0.42 | 0.44 | 0.48 | 0.50 |
| P-value | 2 × 10⁻² | 3 × 10⁻³ | 8 × 10⁻⁴ | 2 × 10⁻⁴ | 7 × 10⁻⁵ | 1 × 10⁻⁵ | <3 × 10⁻⁶ |
Since the PS-scores are maxima, the extreme value distribution is a suitable statistical model for describing their distribution. In general, for pockets of arbitrary size, the PS-scores of pockets may be modelled using the type I extreme value distribution (Gumbel distribution),
| (5) |
where z denotes the Z-score given by  . The variable s denotes the PS-score; µ is the location parameter and σ is the scale parameter. The corresponding P-value of the score can be calculated according to the formula
| (6) |
The scores from random pockets were fit to Equation 5. Supplementary Fig. S1 shows the observed and modelled distributions at various lengths. Each distribution is modelled by the Gumbel distribution described in Equation 5. The location and scale parameters can be estimated through linear regression fits,
| (7) |
The parameters a to f were obtained by linear fitting to the location and scale parameters, which were obtained through maximum likelihood estimates with the EVD package in the statistical platform R (http://www.r-project.org/). The values of parameter a to f are 0.3117, 0.0277, −0.029, 0.0366, 0.0025, −0.0084, respectively. In our implementation, APoc reports the P-value of the score normalized by the smaller of two pockets subjected to comparison.
2.6 Performance analysis
Given a threshold for a similarity score, if the score of a pair of pockets from the subject set is greater than the threshold, it is a true positive (TP), otherwise, it is a false negative (FN). Similarly, if the score of a pair of pockets from the control set is less than the threshold value, it defines a true negative (TN); otherwise, it is a false positive (FP). Sensitivity is given by TP/(TP+FN), and the false positive rate (FPR) is given by FP/(TN+FP).
3 RESULTS
3.1 Benchmark
We created two datasets, Subject/Control (see Section 2), for evaluating the performance of APoc. The Subject set contains 38 066 pairs of pockets from proteins at low sequence identity < 30%. In each pair, pockets contain the same or similar type of ligands at Tc ≥ 0.5; they likely share significant structural similarity because of the overlap of many atomic ligand–protein contacts of similar chemical type. To reduce bias, no pocket structural information was explicitly used to generate this set. As a random background, the Control set contains the same number pairs of pockets that interact with dissimilar ligands (Tc < 0.25) in randomly selected proteins with low sequence or global structural similarity. Observed and predicted pockets in structures from the Subject/Control sets were obtained by applying two separate methods, LPC and LIGSITE. The former method defines an observed pocket as being composed of residues in contact with a ligand, whereas the latter outputs the predicted pocket through a geometric analysis of protein structure without using any information about the ligand.
As shown in Figure 3A, the majority (58%) of the observed pockets in the Subject set have significant pocket similarity as evaluated by a PS-score at P < 0.05, 47% at P < 0.01 and 33% at P < 0.001. By contrast, the corresponding percentage for the Control set is 2.4% at P < 0.05, 0.51% at P < 0.01 and 0.12% at P < 0.001. Similarly, the results of APoc on predicted pockets are 49% at P < 0.05, 36% at P < 0.01 and 24% at P < 0.001 for the Subject set, versus 2.3% at P < 0.05, 0.36% at P < 0.01 and 0.06% at P < 0.001 for the Control set. Overall, APoc found somewhat fewer significant hits on predicted pockets than on the observed pockets in the Subject set. This is expected because the observed pockets are more accurate by taking advantage of the structural information of the ligands, whereas the predicted pockets often contain additional residues surrounding those ligand-contacting residues, which introduce more structural variations, thereby reducing pocket similarity.
Fig. 3.

Performance of APoc. (A) Cumulative fraction of pairs of pockets at various significance levels of pocket similarity for the subject and the control sets, respectively. (B) Sensitivity versus FPR. ‘Obs Pk’ and ‘Pre Pk’ denotes observed and predicted pockets (see Text), respectively. ‘Vol Diff’ denotes the pocket volume difference given by Dvol
The performance of APoc is further displayed in the Receiver Operating Characteristic (ROC) curves (Fig. 3B), which is obtained by varying the PS-score P-value. The sensitivity is the fraction of pairs in Subject above a P threshold, and the FPR is the fraction of pairs in Control above the same P threshold. Thus, the curve shows how well APoc detects relationship between pockets that bind to similar ligands through structural comparison. Here, we only focus on the regime with low FPR < 6%, because this is most relevant to practical applications, where one often needs to process a large number of pocket structures. As shown in Figure 3B, APoc achieves sensitivity values of 62% and 53% at FPR of 5% and 1% on the observed pockets. Similarly, the corresponding sensitivity values are 56% and 43% for the predicted pockets. By comparison, a global structural comparison method, TM-align, only finds 38% and 27% pairs in the Subject set at a FPR of 5% and 1%, using the global TM-score as the similarity measure; these results are considerably lower than APoc. Figure 3 also shows that structural-based comparison performs much better than the volume-based metric Dvol, which gives a sensitivity value of 6.6% at an FPR of 5% and is only slightly better than a random prediction. This is expected because the volume-based metric is non-specific. Overall, the analysis suggests that the local structural comparison approach, APoc, can categorize/predict related pockets that recognize same/similar ligands from a large random background. Such relationships may be weak or undetectable by global structural comparison.
3.2 Examples
To further demonstrate the usefulness of APoc, we present two interesting examples from the benchmark set. The first example involves the GTP-binding pockets in two GTPases, PAB0955 (Gras et al., 2007) from archaeal Pyrococcus abyssi and YqeH GTPase (Sudhamsu et al., 2008) from bacterial Geobacillus stearothermophilus (Fig. 4A). In each case, the GTP-binding pocket is formed primarily by two motifs: G1 is located in the ‘P-loop’ that coordinates the interaction with the phosphate groups of GDP, and G4 interacts and stabilizes the guanine and the ribose moieties of GDP. In most GTPases, like PAB0955, the motif G4 follows G1 in their sequential order. However, in an atypical GTPase YeqH, a circular permutation flipped the order of G1 and G4, such that a sequence order-dependent alignment method only returns an alignment for half of the pocket. The sequence order-independent feature of APoc yields the full alignment of both motifs and returns a highly significant PS-score of 0.58 at P = 2.7 × 10⁻⁶, versus a much lower PS-score of 0.40 if one only allows a sequential alignment.
Fig. 4.

Examples of similar pockets from proteins having different global topology and/or fold. (A) A GTP-binding pocket in a GTPase PAB0955 from P.abyssi (PDB code: 1yr8, chain A, green) versus a GDP-binding pocket in YqeH GTPase from G.stearothermophilus (PDB code: 3ec1, chain A, purple). (B) An ATP-binding pocket in a bifunctional glutathionylspermidine synthetase/amidase from E.coli (PDB code: 2io7, chain B, green) versus an ATP-binding pocket in an aminoglycoside phosphotransferase from A.baumannii (PDB code: 4ej7, chain B, purple). In each snapshot, the two protein structures are shown in green/purple cartoon representations, and the corresponding bound ligands are shown in cyan/red licorice representations, respectively. For clarity, pocket/non-pocket regions are shown in solid/transparent colours, respectively. Aligned pocket Cα atoms are shown as spheres. Molecular images were created with VMD (Humphrey et al., 1996). The global structural similarity measured by TM-score is denoted as ‘gTM-score’
The second example is about two ATP-binding enzymes, a bifunctional glutathionylspermidine synthetase/amidase GspS (Pai et al., 2006) from Escherichia coli, and an aminoglycoside phosphotransferase AphA1 from Acinetobacter baumannii (Fig. 4B). The ATP-binding pocket of GspS is located in the C-terminal domain, with a structural fold similar to human glutathione synthetase, whereas the ATP-binding pocket of AphA1 sits in a structural fold similar to the catalytic domain of a protein kinase. These are different structural folds according to the SCOP (Hubbard et al., 1998). The global structural similarity is low, with a TM-score of 0.36 between these two structures. However, their ATP-binding pockets exhibit significant structural similarity as detected by APoc, yielding a PS-score of 0.46 at P = 2.0 × 10⁻⁴, versus an insignificant PS-score of 0.29 in the sequential alignment. The overall RMSD of aligned pocket Cα atoms is 2.5 Å.
3.3 Comparison with SiteEngine
SiteEngine (Shulman-Peleg et al., 2004) is one of few pocket-comparison methods that can be freely downloaded for large-scale benchmark testing. We randomly selected 1000/1000 pairs of pockets from the Subject/Control sets, and performed a comparison with APoc. As shown in the ROC curves (Fig. 5), APoc shows considerably better performance than SiteEngine. APoc achieves a sensitivity of 62% at an FPR of 5%, versus a mere 17% sensitivity for SiteEngine at the same FPR. This apparently surprising result for SiteEngine is mainly due to the size dependence of the Match score defined by SiteEngine to measure the similarity of ligand-binding pockets. The Match score is a simple linear normalization obtained by dividing the raw score by the raw score of the query against itself. This is not sufficient to correct for the size dependence because of the non-linear relationship between the similarity score and the size of the pocket. As a result, SiteEngine Match scores of randomly selected pockets are strongly correlated with the size of the pocket, yielding a Pearson Correlation Coefficient of −0.60. If we restrict the comparison to a narrow range of pocket sizes between 45 and 65 pseudocentres, the sensitivity at a 5% FPR jumps from 17 to 50% (Fig. 5). Thus, if the size dependence issue were addressed, we expect that the performance of SiteEngine would be dramatically improved. Another advantage of APoc is its computing efficiency, due to the reduced representation adopted by APoc relative to SiteEngine. On the same computing cluster composed of AMD 2.4 GHz Opteron CPUs, the total computation time (not including input file preparation) for these 2000 comparisons is 8983 seconds with SiteEngine, versus 73 seconds for pocket comparison alone and 3686 seconds for both pocket and global structure comparison with APoc.
Fig. 5.

APoc versus SiteEngine. The ROC curves of SiteEngine were obtained by varying the threshold values on the Match score. The two red curves are on the full set of 2000 pairs of pockets, and on a subset of pockets possessing 45–65 pseudocentres, respectively
4 DISCUSSION AND CONCLUSION
Depending on the method one uses, there are two main ways of detecting protein pockets. The first is simply to collect all amino acids that make direct physical contact to a ligand as observed in a holo crystal structure. This practice is common in studies that study the evolutionary relationships of protein pockets. The second way is to perform geometric/physico-chemical/evolutionary analysis on the protein structure to predict pocket-lining residues without the presence of ligand. Using a putative pocket as a query to scan of a template library, one may further infer ligands that bind to the query through similarity to pockets for known ligands.
In this work, we present a structural comparison approach APoc that can be applied to pockets from both observed and predicted pockets. A scoring function for measuring pocket similarity is carefully devised, the PS-score, such that it can deal with pockets of different size, ranging from 10 residues to 100 residues (Fig. 1). In addition, the statistical significance of the PS-score is estimated from the extreme value distributions modelled on millions of random comparisons. This should greatly facilitate the identification of interesting relationships from large-scale pocket comparison.
It should be noted that that there is no perfect scoring function for measuring pocket similarity. Our PS-score is largely based on the positions of Cα and Cβ atoms, as well as some consideration of chemical similarity. This design is less sensitive to the conformational changes than a scoring scheme that considers all heavy atoms, and it can readily detect the structural similarity of pockets in remotely related proteins that share no apparent sequence similarity but recognize similar ligands.
To evaluate the performance of APoc, we curated two datasets: Subject and Control. The former is composed of pockets recognizing similar ligands from proteins with low/no sequence similarity, and the latter consists of pockets binding to chemically different ligands. In the benchmark tests, APoc detects 62%/56% of pairs in the Subject set at a 5% FPR for both observed (those that actually bind ligands) and predicted pockets, respectively. These results suggest that APoc is robust to pockets identified by different pocket-detection methods. Furthermore, the two examples presented here illustrate that usefulness of the sequence order-independence feature of APoc. One example involves two GTPases, one of which exhibits a circular permutation that changes the order of the active site residues; the other involves a pair of ATP-binding pockets from two protein folds. Such cases are challenging for global structural comparison approaches.
One major difficulty in predicting ligand binding through pocket comparison is due to the fact that a ligand may recognize pockets of different structural shapes (Kahraman et al., 2007) or even physico-chemical environments (Kahraman et al., 2010). In our Subject dataset, ∼40% of pairs belong to these challenging cases, and APoc did not find a significant score for them. An analysis of the ligand conformation distribution in our Subject set shows that ligands from pocket pairs with a significant PS-score at P < 0.05 have a median RMSD of 1.68 Å, much lower than the median of 3.05 Å from ligands in pocket pairs at P ≥ 0.05 (Supplementary Fig. S2). If we consider only the cases whose ligand RMSD < 2.5/2.0 Å, 81/90% of pairs have a significant pocket similarity at P < 0.05. In some cases, the plasticity of pockets permits ligands with different conformations to be accommodated, and yet maintains significant pocket similarity (an example is shown in Supplementary Fig. S3A). Some ligands are composed of a common anchor segment, which is recognized by virtually the same pocket shape, and a long flexible segment, which gives a large ligand RMSD. But in most cases, conformational changes in ligands are accompanied by considerable changes in pockets, leading to little/no structural similarity (Supplementary Fig. S3B). Furthermore, in a few most challenging cases, a ligand of the same conformation may interact with structurally different pockets (Supplementary Fig. S3C). Although certain fragments of pockets may still exhibit similarity in these cases, the overall similarity level is not high enough to distinguish them confidently from the random background.
In ongoing work, we shall use APoc to characterize the structural similarity of all pockets in the PDB. Of particular interest is the examination of how many distinct pockets there are, how often a given pocket is shared across proteins of different folds and how coupled are pocket geometric similarity and ligand chemical similarity and mode of binding. These issues are important for elucidating the promiscuity of small-molecule ligands that may be endogenous (viz. metabolites) or drugs. In that regard, having a robust tool such as APoc will enable the user community to apply similar ideas and studies as has been done for global protein structures (Skolnick et al., 2009; Zhang et al., 2006) or protein–protein interfaces (Gao and Skolnick, 2010b) to the characterization of the nature and similarity of protein pockets.
Funding: This work is supported by the National Institutes of Health Grant [GM-48835].
Conflict of Interest: none declared.
Supplementary Material
REFERENCES
- Alberts B. Molecular Biology of the Cell. New York: Garland Science; 2008. [Google Scholar]
- Berman HM, et al. The protein data bank. Nucleic Acids Res. 2000;28:235–242. doi: 10.1093/nar/28.1.235. [DOI] [PMC free article] [PubMed] [Google Scholar]
- Binkowski TA, et al. CASTp: computed atlas of surface topography of proteins. Nucleic Acids Res. 2003;31:3352–3355. doi: 10.1093/nar/gkg512. [DOI] [PMC free article] [PubMed] [Google Scholar]
- Brylinski M, Skolnick J. FINDSITELHM: a threading-based approach to ligand homology modeling. PLoS Comp. Biol. 2009;5 doi: 10.1371/journal.pcbi.1000405. [DOI] [PMC free article] [PubMed] [Google Scholar]
- Chikhi R, et al. Real-time ligand binding pocket database search using local surface descriptors. Proteins. 2010;78:2007–2028. doi: 10.1002/prot.22715. [DOI] [PMC free article] [PubMed] [Google Scholar]
- Davies JR, et al. The Poisson Index: a new probabilistic model for protein- ligand binding site similarity. Bioinformatics. 2007;23:3001–3008. doi: 10.1093/bioinformatics/btm470. [DOI] [PubMed] [Google Scholar]
- Derigs U. The shortest augumenting path method for solving assignment problems - Motivation and computational experience. In: Monma CL, editor. Algorithms and Software for Optimization. Basel: Baltzer; 1985. pp. 57–102. [Google Scholar]
- Gao M, Skolnick J. iAlign: a method for the structural comparison of protein-protein interfaces. Bioinformatics. 2010a;26:2259–2265. doi: 10.1093/bioinformatics/btq404. [DOI] [PMC free article] [PubMed] [Google Scholar]
- Gao M, Skolnick J. Structural space of protein-protein interfaces is degenerate, close to complete, and highly connected. Proc. Natl. Acad. Sci. USA. 2010b;107:22517–22522. doi: 10.1073/pnas.1012820107. [DOI] [PMC free article] [PubMed] [Google Scholar]
- Gao M, Skolnick J. New benchmark metrics for protein-protein docking methods. Proteins. 2011;79:1623–1634. doi: 10.1002/prot.22987. [DOI] [PMC free article] [PubMed] [Google Scholar]
- Gold ND, Jackson RM. Fold independent structural comparisons of protein-ligand binding sites for exploring functional relationships. J. Mol. Biol. 2006;355:1112–1124. doi: 10.1016/j.jmb.2005.11.044. [DOI] [PubMed] [Google Scholar]
- Gras S, et al. Structural insights into a new homodimeric self-activated GTPase family. EMBO Rep. 2007;8:569–575. doi: 10.1038/sj.embor.7400958. [DOI] [PMC free article] [PubMed] [Google Scholar]
- Hattori M, et al. SIMCOMP/SUBCOMP: chemical structure search servers for network analyses. Nucleic Acids Res. 2010;38:W652–W656. doi: 10.1093/nar/gkq367. [DOI] [PMC free article] [PubMed] [Google Scholar]
- Huang BD, Schroeder M. LIGSITE(csc): predicting ligand binding sites using the Connolly surface and degree of conservation. BMC Struct. Biol. 2006;6:19. doi: 10.1186/1472-6807-6-19. [DOI] [PMC free article] [PubMed] [Google Scholar]
- Hubbard TJ, et al. SCOP, structural classification of proteins database: applications to evaluation of the effectiveness of sequence alignment methods and statistics of protein structural data. Acta Crystallogr. D Bio. Crystallogr. 1998;54:1147–1154. doi: 10.1107/s0907444998009172. [DOI] [PubMed] [Google Scholar]
- Humphrey W, et al. VMD: visual molecular dynamics. J. Mol. Graphics. 1996;14:33–38. doi: 10.1016/0263-7855(96)00018-5. [DOI] [PubMed] [Google Scholar]
- Kabsch W. Solution for best rotation to relate two sets of vectors. Acta Crystallogr. Sect. A. 1976;32:922–923. [Google Scholar]
- Kahraman A, et al. On the diversity of physicochemical environments experienced by identical ligands in binding pockets of unrelated proteins. Proteins. 2010;78:1120–1136. doi: 10.1002/prot.22633. [DOI] [PubMed] [Google Scholar]
- Kahraman A, et al. Shape variation in protein binding pockets and their ligands. J. Mol. Biol. 2007;368:283–301. doi: 10.1016/j.jmb.2007.01.086. [DOI] [PubMed] [Google Scholar]
- Laskowski RA. SURFNET—a program for visualizing molecular surfaces, cavities, and intermolecular interactions. J. Mol. Graphics. 1995;13:323–330. doi: 10.1016/0263-7855(95)00073-9. [DOI] [PubMed] [Google Scholar]
- Laskowski RA, et al. Protein clefts in molecular recognition and function. Protein Sci. 1996;5:2438–2452. doi: 10.1002/pro.5560051206. [DOI] [PMC free article] [PubMed] [Google Scholar]
- Levitt DG, Banaszak LJ. POCKET—a computer-graphics method for identifying and displaying protein cavities and their surrounding amino-acids. J. Mol. Graphics. 1992;10:229–234. doi: 10.1016/0263-7855(92)80074-n. [DOI] [PubMed] [Google Scholar]
- Liang J, et al. Anatomy of protein pockets and cavities: measurement of binding site geometry and implications for ligand design. Protein Sci. 1998;7:1884–1897. doi: 10.1002/pro.5560070905. [DOI] [PMC free article] [PubMed] [Google Scholar]
- Minai R, et al. Method for comparing the structures of protein ligand-binding sites and application for predicting protein-drug interactions. Proteins. 2008;72:367–381. doi: 10.1002/prot.21933. [DOI] [PubMed] [Google Scholar]
- Morris RJ, et al. Real spherical harmonic expansion coefficients as 3D shape descriptors for protein binding pocket and ligand comparisons. Bioinformatics. 2005;21:2347–2355. doi: 10.1093/bioinformatics/bti337. [DOI] [PubMed] [Google Scholar]
- Najmanovich R, et al. Detection of 3D atomic similarities and their use in the discrimination of small molecule protein-binding sites. Bioinformatics. 2008;24:I105–I111. doi: 10.1093/bioinformatics/btn263. [DOI] [PubMed] [Google Scholar]
- Pai CH, et al. Dual binding sites for translocation catalysis by Escherichia coli glutathionylspermidine synthetase. EMBO J. 2006;25:5970–5982. doi: 10.1038/sj.emboj.7601440. [DOI] [PMC free article] [PubMed] [Google Scholar]
- Perot S, et al. Druggable pockets and binding site centric chemical space: a paradigm shift in drug discovery. Drug Discov. Today. 2010;15:656–667. doi: 10.1016/j.drudis.2010.05.015. [DOI] [PubMed] [Google Scholar]
- Schmitt S, et al. A new method to detect related function among proteins independent of sequence and fold homology. J. Mol. Biol. 2002;323:387–406. doi: 10.1016/s0022-2836(02)00811-2. [DOI] [PubMed] [Google Scholar]
- Shulman-Peleg A, et al. Recognition of functional sites in protein structures. J. Mol. Biol. 2004;339:607–633. doi: 10.1016/j.jmb.2004.04.012. [DOI] [PMC free article] [PubMed] [Google Scholar]
- Skolnick J, et al. The continuity of protein structure space is an intrinsic property of proteins. Proc. Natl Acad. Sci. USA. 2009;106:15690–15695. doi: 10.1073/pnas.0907683106. [DOI] [PMC free article] [PubMed] [Google Scholar]
- Sobolev V, et al. Automated analysis of interatomic contacts in proteins. Bioinformatics. 1999;15:327–332. doi: 10.1093/bioinformatics/15.4.327. [DOI] [PubMed] [Google Scholar]
- Sudhamsu J, et al. The structure of YqeH an AtNOS1/AtNOA1 ortholog that couples GTP hydrolysis to molecular recognition. J. Biol. Chem. 2008;283:32968–32976. doi: 10.1074/jbc.M804837200. [DOI] [PMC free article] [PubMed] [Google Scholar]
- Xie L, Bourne PE. Detecting evolutionary relationships across existing fold space, using sequence order-independent profile-profile alignments. Proc. Natl. Acad. Sci. USA. 2008;105:5441–5446. doi: 10.1073/pnas.0704422105. [DOI] [PMC free article] [PubMed] [Google Scholar]
- Zhang Y, et al. On the origin and highly likely completeness of single-domain protein structures. Proc. Natl Acad. Sci. USA. 2006;103:2605–2610. doi: 10.1073/pnas.0509379103. [DOI] [PMC free article] [PubMed] [Google Scholar]
- Zhang Y, Skolnick J. Scoring function for automated assessment of protein structure template quality. Proteins. 2004;57:702–710. doi: 10.1002/prot.20264. [DOI] [PubMed] [Google Scholar]
- Zhang Y, Skolnick J. TM-align: a protein structure alignment algorithm based on the TM-score. Nucleic Acids Res. 2005;33:2302–2309. doi: 10.1093/nar/gki524. [DOI] [PMC free article] [PubMed] [Google Scholar]
- Zhang ZD, Grigorov MG. Similarity networks of protein binding sites. Proteins. 2006;62:470–478. doi: 10.1002/prot.20752. [DOI] [PubMed] [Google Scholar]
Associated Data
This section collects any data citations, data availability statements, or supplementary materials included in this article.