Abstract
In order to reach their pharmacologic targets, successful central nervous system (CNS) drug candidates have to cross a complex protective barrier separating brain from the blood. Being able to predict a priori which molecules can successfully penetrate this barrier could be of significant value in CNS drug discovery. Herein we report a new computational approach that combines two mechanism-based models, for passive permeation and for active efflux by P-glycoprotein, to provide insight into the multiparameter optimization problem of designing small molecules able to access the CNS. Our results indicate that this approach is capable of distinguishing compounds with high/low efflux ratios as well as CNS+/CNS– compounds and provides advantage over estimating P-glycoprotein efflux or passive permeability alone when trying to predict these emergent properties. We also demonstrate that this method could be useful for rank-ordering chemically similar compounds and that it can provide detailed mechanistic insight into the relationship between chemical structure and efflux ratios and/or CNS penetration, offering guidance as to how compounds could be modified to improve their access into the brain.
Keywords: P-glycoprotein, CNS drugs, blood brain barrier, BBB, efflux ratio prediction, structure-based ADME prediction
One of the unique challenges of developing drugs for the central nervous system (CNS) is overcoming the blood-brain barrier (BBB), a cellular and enzymatic barrier that tightly regulates passage of molecules from blood into the brain.1,2 Formed by the endothelium of the cerebral blood capillaries, it has several distinct features. Tight junctions between the endothelial cells prevent paracellular transport or diffusion of molecules in the space between the cells, which effectively limits molecular access to the brain to transcellular permeation.3 Another feature is highly expressed active efflux transporters that expel diffusing molecules back into the blood. Among these, P-glycoprotein (also referred to by its gene name MDR1 or ABCB1) is the most abundant and is known to efflux molecules of a wide variety of shapes and sizes with no one single pharmacophore.4 A recently published structure of mouse P-glycoprotein, Figure 1, revealed a large hydrophobic cavity in the transmembrane region lined with various hydrophobic and flexible side-chains with no clearly defined subsites, offering an explanation for the broad substrate specificity.5,6
Figure 1.
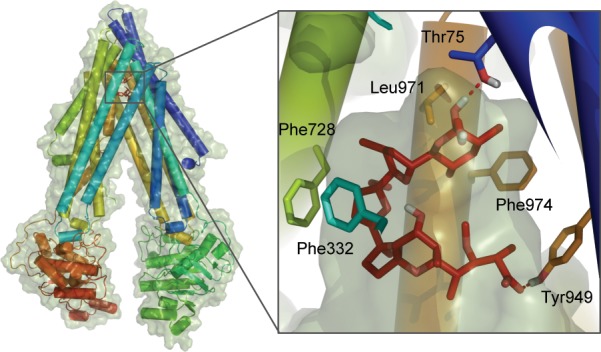
Mouse P-glycoprotein structure (PDB ID: 3G60) and its binding cavity with monensin (red), a P-gp binder, docked using flexible receptor docking. Closest residues are highlighted to illustrate the mainly hydrophobic and hydrogen-bonding interactions between the ligand and the protein.
Several in vitro methods have been developed to predict brain penetration of CNS drug candidates. The most widely used assays employ cell monolayers, such as the MDR-MDCK, that is, Madin-Darby canine kidney cells that have been modified to overexpress P-glycoprotein, which localizes on the apical cell surface. In such assays, transport rates of molecules are measured in both directions, basal-to-apical and apical-to-basal, across the single layer of cells. The ratio or difference of the two rates in opposite directions is used to identify P-gp substrates and to predict whether compounds are likely to be CNS-positive or CNS-negative.7,8
There are also more complex methods to assess the extent and rate of brain penetration in situ or in vivo, generally using rats or mice. The quantities Kp or log BB measure the extent of brain penetration based on the ratio of brain to plasma concentration of a compound
| 1 |
| 2 |
The rate of brain penetration can be quantified as the capillary permeability surface area product, PS, and is derived from the following equation9
| 3 |
where Kin is the initial uptake rate constant and F is the regional cerebral flow of perfusion fluid. However, PS measurements are time-intensive and costly, and are much less commonly available than log BB.
Alongside experimental assays, many computational approaches to predict brain penetration have also been developed. Methods using rule-based classification schemes10,11 and QSAR/QSPR algorithms12,13 have been used to reproduce or predict log BB and/or PS values. The major goal is generally to classify compounds as CNS+ or CNS–, but various pharmacokinetic models have been applied to describe the process of brain penetration more quantitatively.14−17 Overall, while many of these methods have been successful in providing reasonably good distinction between the brain-penetrable and nonpenetrable compounds, they offer little mechanistic insight and, therefore, limited guidance as to how compounds could be modified to improve their access into the brain.
Even with this multitude of experimental assays and in silico methods to predict brain penetration, the number of successful CNS candidates that have moved beyond preclinical stages has remained low over the years. While the low success rate can be largely attributed to the complexity of CNS diseases—many of which are poorly understood—there has also been an increased realization that measuring or predicting a single parameter, such as log BB or PS, to assess such complex process as brain penetration is of limited use at best and at worst is counterproductive.18,19
Here we present a new computational approach that combines two mechanism-based models, for passive permeation and for active efflux by P-glycoprotein, which we have described in detail previously.20,21 While this model clearly neglects other aspects of the blood-brain barrier, such as active influx, we demonstrate that this combined model provides considerable insight into the multiparameter optimization problem underlying the goal of designing small molecules to access the CNS. We test this method’s ability to differentiate between molecules with high and low efflux ratios in cell-based monolayer assays, which have been shown in previous studies to correlate with molecules’ ability to access the brain. We also assess this method’s capability to distinguish CNS+ and CNS– compounds as classified based on in vivo and in situ data. Finally, we applied our approach to a series of small data sets of structurally similar compounds to identify compounds with the highest/lowest efflux ratios and, as such, least/most likely, respectively, to access the CNS. As with many computational methods, the potential advantages of this approach over experimental techniques are its speed and cost effectiveness. More importantly, however, it provides mechanistic insight as to which properties of a given compound affect its BBB penetration, providing guidance for potential chemical modifications.
Results and Discussion
Kinetic Modeling
It has been shown in several studies that passive permeability and P-gp efflux measured in monolayer efflux assays correlate within certain limits with a compound’s potential for brain uptake. Thus, based on the analysis of drugs with CNS and non-CNS indication, Doan et al.8 concluded that compounds with passive permeability > 150 nm/s and efflux ratio < 2.5 were most likely to be CNS+ while a stricter cutoff of > 30 nm/s was proposed by Wang et al.7 Such a criterion reflects the dependence of CNS penetration on both passive permeability and active efflux.
The partitioning of compounds across a single layer of P-gp-transfected MDCK cells separating donor and acceptor compartments (as well as, more crudely, the more complex blood-brain barrier system) can be described by a simple two compartment pharmacokinetic model depicted in Figure 2.
Figure 2.
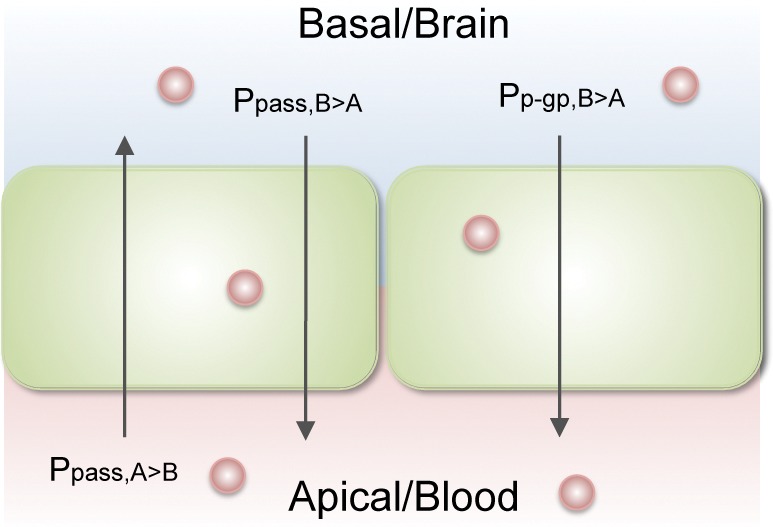
Two compartment model of monolayer efflux assay and blood-brain barrier.
Flux in the apical to basal direction can be expressed in terms of passive permeability:
| 4 |
where the units of J are mol/s, Ppass is the passive permeability in cm/s, C0 is the initial concentration at time 0, and A is the surface area in cm2. For our model, we set the initial concentration to 2 uM22,23 and area to 1. The flux in the basal to apical direction is expressed as a combination of passive efflux and active transport
| 5 |
where Vmax is the maximum velocity of P-gp mediated efflux, set to 1000 fmol/s17 and Km is the compound’s apparent affinity for P-gp. Based on these equations, the efflux ratio (ER) for any compound can be calculated using the following equation:
| 6 |
In this work, we estimate the relative Km values based on the induced fit docking score using the structure of mouse P-gp, as described in detail elsewhere.20 Specifically, we use the GlideXP scoring function, using the following equation:
| 7 |
where the GlideXP score is in kcal/mol, R is the gas constant in units of cal/K mol, T is temperature in K, set to 300, and C1 is a fitting coefficient. Similarly, Ppass is derived from computed log Pm, an estimate of relative passive permeability based on a series of physical factors including polarity, conformational flexibility, and molecular size.21 Again, we introduce a second fitting coefficient to scale this computed value in an empirical manner:
| 8 |
We wish to emphasize that the computational methods we use for estimating the rates of passive permeation and active efflux by P-gp are not capable of predicting the absolute rates. Rather, as we have shown in our previous work validating these approaches, they are capable, at best, of rank-ordering compounds according to these predicted permeabilities. As such, our goal here is to rank-order compounds according to predicted efflux ratio, and the fit coefficients allow us to empirically scale the two terms to maximize the predictive power. Nonetheless, the two underlying models are based on our best mechanistic understanding of these processes, and provide direct insights into the physical processes underlying the emergent properties such as penetration of the blood-brain barrier.
Efflux Ratios
In order to find the optimal coefficients for eqs 7 and 8, we used a large data set collected from the literature of compounds with reported efflux ratio and apparent permeability values.8,22−26 From this set we excluded compounds with MW > 800, > 11 rotational bonds, or a quaternary ammonium, as well as obvious substrates of uptake transporters as indicated by their efflux ratio values of less than one. Instead of trying to reproduce the exact experimental efflux ratio values, which on average varied by 38% from one study to another (Supporting Information Table S1), we then divided our data set into two subsets of compounds with average experimental ER > 3 and ER < 3, a slightly stricter cutoff than that suggested by Doan for CNS– and CNS+ compounds, respectively, and optimized for coefficients that would result in the best discrimination between the two subsets. Coefficients C1 = 0.54 and C2 = 0.36 produced the highest discrimination rates of 81% for ER > 3 and 71% for ER < 3. For comparison, plots of the two physicochemical parameters often used to evaluate permeability and potential for P-gp efflux (molecular weight and log P) showed little discrimination between the two sets (Supporting Information Figure 1).
Shown in Figure 3 are the two classes of compounds plotted according to their computed passive permeability and P-gp efflux values, along with lines representing calculated efflux ratio values of 1.5, 2, and 3. These lines highlight the dependence of efflux ratios on both passive permeation and active efflux: compounds with, for example, ER > 3 can have low passive permeability and modest efflux by P-pg, or relatively high passively permeability but very strong efflux by P-gp, or something in-between. To the right of the ER = 3 curve (red), compounds are predicted to have ER > 3, while to the left of it ER < 3. Within the subset with experimental ER > 3, Figure 3A, there were only a few outliers that were predicted to have ER < 3, and most of these were predicted to have ER > 1.5. Two of them, terfenadine and cimetidine, also have experimental ER values at the border of the two classes, 3.8 ± 1.3 and 3.5 ± 1.3, respectively. Sertraline and clomipramine have experimental ER values of 7.4 ± 5.4 and 6.2 ± 6.7, when averaged over multiple studies; the large uncertainty represents substantially different values reported in multiple studies. We note that both of these compounds are used to treat CNS disorders and therefore are known to be CNS+, with which our prediction is consistent.
Figure 3.
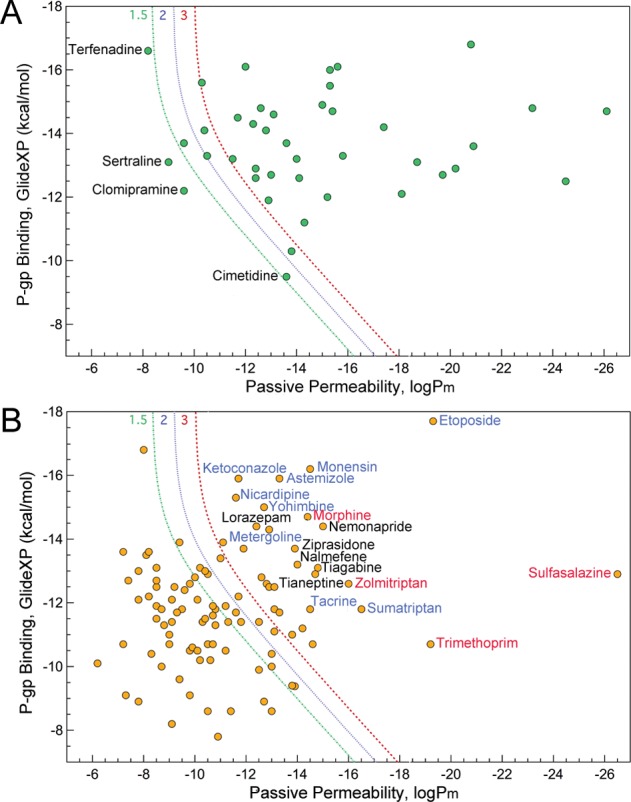
Calculated passive permeability and P-gp efflux for compounds with average experimental efflux ratio of >3 (A) and <3 (B). The lines correspond to computed efflux ratio values of 1.5 (green), 2 (blue), and 3 (red). Labeled in blue are compounds known to inhibit P-gp, while those in red are reported substrates of other transporters.
In Figure 3B, one can see that our prediction is also consistent with the experimental data for the majority of the compounds with experimental ER < 3. For those cases where our prediction differs from the experiment, most of the compounds are either P-gp inhibitors (monensin,24 nicardipine,27 ketoconazole,28 etoposide,24 astemizole,29 yohimbine,30 metergoline,8 tacrine,8 sumatriptan8) or known substrates of uptake transporters (trimethoprim,31 morphine,31 sulfasalazine,32 zolmitriptan33). These failures thus represent two of the most important limitations of our current model: the inability to accurately distinguish between P-gp substrates versus inhibitors (both bind potently to P-gp), and the neglect of influx transporters.
CNS+/CNS– Prediction
Next, we applied our method to a data set of CNS+/CNS– compounds as defined by in vivo and in situ measurements (Supporting Information Table S2). In Figure 4, the red line corresponding to the calculated efflux ratio of 3 distinguishes the two sets with high accuracy.
Figure 4.
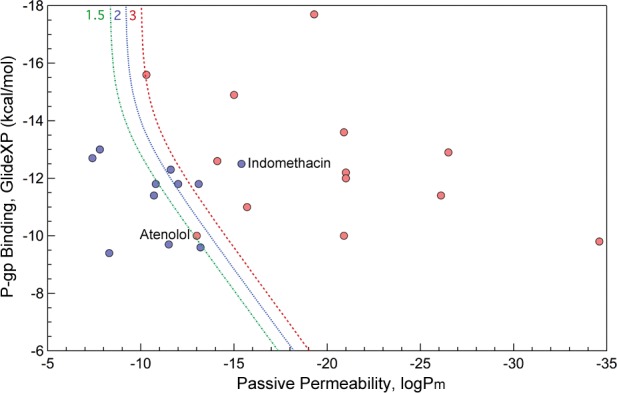
Calculated passive permeability and P-gp efflux for CNS+ (red) and CNS– (blue) compounds as classified based on experimental measurements in the study of Wang et al.7 The lines correspond to computed efflux ratio values of 1.5 (green), 2 (blue), and 3 (red).
There are only two outliers, one of which is indomethacin, predicted to be CNS– but known to be CNS+, primarily because of its is active uptake transport,34 which our current model ignores. Another, less dramatic outlier is atenolol, which, while considered to be CNS–, has been reported to penetrate the BBB, albeit in small quantities.35
Peptidic Cysteine Protease Inhibitors
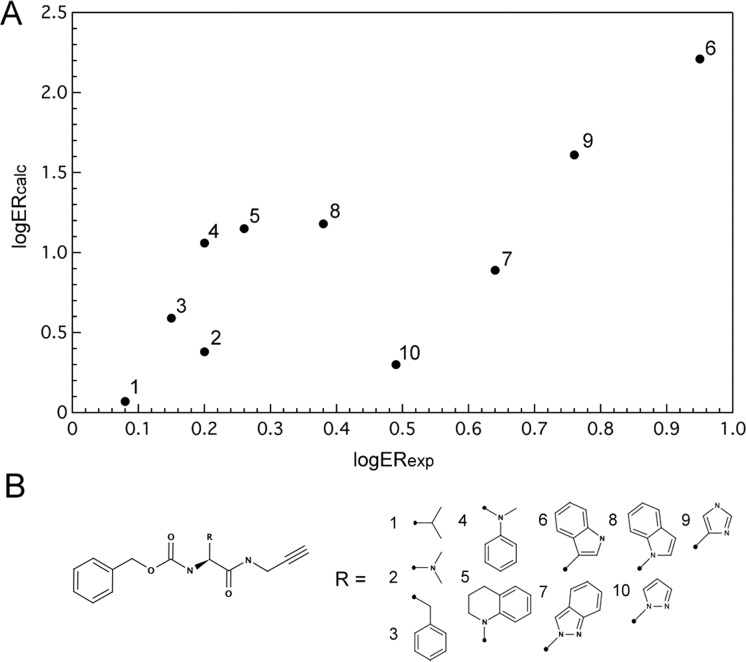
In a previous study, we used a series of closely related peptidomimetic compounds to prospectively predict which compounds would have the best/worst efflux ratios, based on their P-gp docking scores (Supporting Information Table S3). Here we returned to this data set to examine if combining P-gp docking scores with the passive permeability could improve the prediction. Results are shown in Figure 5 where improvement in prediction for compound 9 is the most obvious and significant. This compound had the second highest efflux ratio score of 5.8, but was ranked as seventh out of 10 compounds based solely on predicted P-gp efflux. Taking into account passive permeability improves the prediction, ranking compound 9 correctly as the second highest predicted efflux ratio.
Figure 5.
Calculated versus experimental efflux ratio values (A) for a series of peptidic cysteine protease inhibitors (B).
Hitchcock Dataset
Finally, we tested our approach on several small compound series in which minor structural modification were shown to affect efflux ratios. We examined 15 series altogether but here discuss a few representative ones (Table 1), providing the rest of the information in Supporting Information Table S4.
Table 1. Calculated and Experimental Efflux Ratio Values for Series of Similar Compound from Hitchcock et al. Review36.
| compds | ER (exp) | log ER (exp) | log Pm | GlideXP | ER (calc) | log ER (calc) |
|---|---|---|---|---|---|---|
| B1 antagonists | ||||||
| 1 | 22.6 | 1.35 | –15.3 | –14.2 | 72 | 1.86 |
| 2 | 8.6 | 0.93 | –11.7 | –13.9 | 4 | 0.63 |
| 3 | 3.2 | 0.51 | –10.8 | –13.1 | 2 | 0.32 |
| 4 | 2.3 | 0.36 | –10.4 | –14.2 | 2 | 0.38 |
| 5 | 8.6 | 0.93 | –10.8 | –14.1 | 3 | 0.45 |
| 6 | 1.9 | 0.28 | –10.6 | –14.5 | 3 | 0.44 |
| AMPA receptor modulators | ||||||
| 15 | 5.8 | 0.76 | –17.4 | –13.3 | 251 | 2.40 |
| 16 | 3.2 | 0.51 | –14.0 | –13.8 | 22 | 1.34 |
| 17 | 1.1 | 0.04 | –11.3 | –13.1 | 3 | 0.41 |
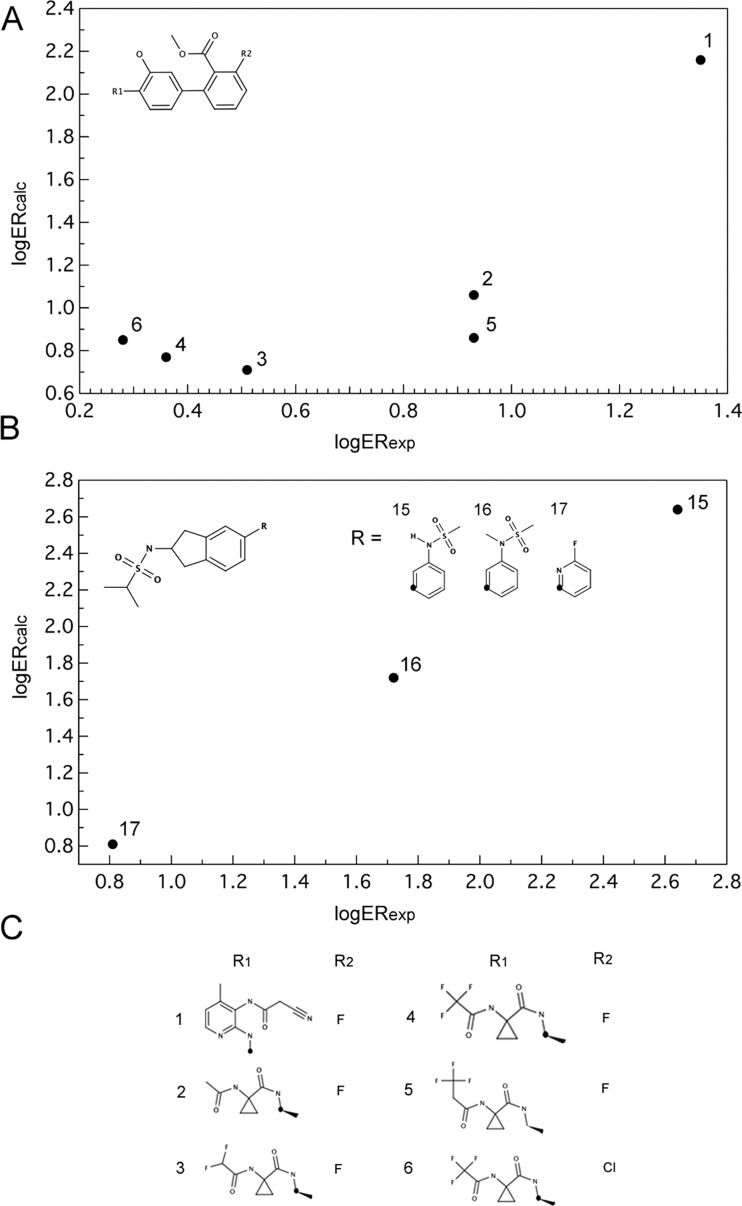
Shown in Figure 6A and B are the calculated versus experimental efflux ratio values (on log scale) for B1 antagonists developed by Merck and AMPA receptor modulators developed by GSK.
Figure 6.
Calculated versus experimental efflux ratio values for B1 antagonists (A, C) and AMPA receptor modulators (B).
As shown in Table 1, we predict that the key determinant of the efflux ratio values in these two series is primarily passive permeability, with the compounds predicted to be the least permeable exhibiting the highest efflux ratios.
Conclusion
We have presented here a computational approach for predicting efflux ratios and blood-brain barrier penetration from chemical structure by combining predictions of passive permeability with predictions of active efflux by P-glycoprotein. Our results indicate that this approach is capable of distinguishing compounds with high/low efflux ratios as well as CNS+/CNS– compounds and provides advantage over estimating P-glycoprotein or passive permeability alone when trying to predict these emergent properties. In addition, we illustrate that this method could be useful for rank-ordering chemically similar compounds and that it can provide detailed mechanistic insight into which property specifically, passive permeability of P-glycoprotein interaction that affects the experimental efflux ratios and/or CNS penetration.
Methods
Datasets
Borst Cell Line Dataset
This data set was assembled from the literature and included 300 molecules with reported efflux ratio (ER) and apparent permeability (Papp) values measured in the MDR1-transfected MDCK cell line from The Netherlands Cancer Institute.8,22−26 For 92 compounds with multiple ER measurements, average values of all the measurements were used in further analysis. Compounds with efflux ratio values less than one (N = 43), with molecular weight greater than 800 g/mol (N = 5), or with 11 or more rotational bonds (N = 3) were excluded. We also excluded neostigmine, pyridostigmine, and ranitidine, which contained quaternary ammonium and thus have no neutral reference state necessary for meaningful passive permeability calculation. The resulting set consisted of 143 unique compounds. The complete list of compounds and their scores is provided in Supporting Information Table S1. Calculated versus experimental log ER values are provided in Supporting Information Figure 2.
Wang Dataset
Compounds for this data set (N = 28) were taken from the study of Wang et al.,7 study where they were classified as CNS+ or CNS– based on in vivo/in situ and brain uptake measurements. We excluded bretylium and ranitidine, which both contained quaternary ammonia, as well as digoxin and vinblastine due to 11 rotational bonds and MW > 800, respectively. The list of compounds and their scores are provided in Supporting Information Table S2.
Peptidic Cysteine Protease Inhibitors
This data set consists of 10 closely related peptidomimetic compounds examined in our previous work.20 Experimental data and computed values are provided in Supporting Information Table S3.
Hitchcock Dataset
This data set consists of congeneric series of compounds reviewed in ref (36), where the effect of small structural modification on efflux ratios and apparent permeability was analyzed.
Experimental Methods
Flexible Receptor Docking to P-Glycoprotein
All molecular docking calculations were performed using the mouse P-glycoprotein crystal structure (Protein Data bank [PDB] code 3G60) and Glide docking software (version 5.6)37 with the OPLS2005 force field38,39 provided within the Schrödinger Suite 2010. The receptor structure was prepared and minimized within the Protein Preparation Wizard. Receptor grid for a 10 × 10 × 10 Å3 inner box was defined with the center at (19.0, 46.0, −6.0) Å3. Flexible receptor docking was performed using a multistage induced fit docking protocol (IFD) as described in detail previously.20 Briefly, in the first stage, the van der Waals radii of protein and ligand are scaled by a factor of 0.5 and ligands are docked into the receptor using the default GlideSP mode. Next, Prime is used to predict and optimize selected protein side chains. Finally, the poses are scored and filtered, after which ligands are redocked using GlideXP mode and scored. Final scoring in this work was implemented using the extra precision (XP) Glide40 scoring function.
Ligand coordinates were obtained from the PubChem Compound (http://pubchem.ncbi.nlm.nih.gov/) database and processed using the Ligprep 2.4 module. The parameters were assigned based on the OPLS2005 force field. For drugs used as racemic mixtures, both stereoisomers were investigated. The isomer with the more favorable docking score was used in the data analysis. Ionization states were assigned by Epik, and groups with pKa between 5 and 9 were treated as neutral while those outside the range were treated as charged.
Passive Permeability Prediction
The underlying concepts behind this method and its applications have been described in detail previously.41,42 In brief, the approach is based on solubility-diffusion theory where the membrane permeability coefficient, Pm, of a permeant diffusing across a membrane can be expressed as
| 9 |
where Kbarrier and Dbarrier are the partition coefficient into and diffusion coefficient across the effective barrier, respectively. Kbarrier is computed from the partition coefficient between water and chloroform, Kc/w, and the size selectivity factor, ξv, as in eq 10 below
| 10 |
| 11 |
where kB is the Boltzmann constant, T is the temperature, VP is the volume of the permeant, P|| is the normal pressure, and P⊥ is the lateral pressure exerted by the lipid molecules. In the current model, P|| and P⊥ are set to 1 and 300 bar, respectively.
Kc/w can be obtained from
| 12 |
where ΔGc/w is a combination of free energy of transfer from water to chloroform, conformational penalty energy, and ionization penalty energy.
Acknowledgments
We thank Dr. Siegfried Leung for assistance with the prediction of passive permeabilities.
Glossary
Abbreviations
- P-gp
p-glycoprotein
- CNS
central nervous system
- BBB
blood-brain barrier
Supporting Information Available
Experimental data and calculated values for all of the examined data sets (Tables S1–4). Additional plots (Figures 1 and 2). This material is available free of charge via the Internet at http://pubs.acs.org.
Author Contributions
The manuscript was written through contributions of all authors. All authors have given approval to the final version of the manuscript.
This work was supported by NIH Grant AG021601.
The authors declare the following competing financial interest(s): MPJ is a consultant to Schrodinger LLC.
Funding Statement
National Institutes of Health, United States
Supplementary Material
References
- Pardridge W. M. (2007) Blood-brain barrier delivery of protein and non-viral gene therapeutics with molecular Trojan horses. J. Controlled Release 122, 345–348. [DOI] [PMC free article] [PubMed] [Google Scholar]
- Mehdipour A. R.; Hamidi M. (2009) Brain drug targeting: a computational approach for overcoming blood-brain barrier. Drug Discovery Today 14, 1030–1036. [DOI] [PubMed] [Google Scholar]
- Abbott N. J.; Patabendige A. A.; Dolman D. E.; Yusof S. R.; Begley D. J. (2010) Structure and function of the blood-brain barrier. Neurobiol. Dis. 37, 13–25. [DOI] [PubMed] [Google Scholar]
- Hennessy M.; Spiers J. P. (2007) A primer on the mechanics of P-glycoprotein the multidrug transporter. Pharmacol. Res. 55, 1–15. [DOI] [PubMed] [Google Scholar]
- Aller S. G.; Yu J.; Ward A.; Weng Y.; Chittaboina S.; Zhuo R.; Harrell P. M.; Trinh Y. T.; Zhang Q.; Urbatsch I. L.; Chang G. (2009) Structure of P-glycoprotein reveals a molecular basis for poly-specific drug binding. Science 323, 1718–1722. [DOI] [PMC free article] [PubMed] [Google Scholar]
- Loo T. W.; Bartlett M. C.; Clarke D. M. (2003) Simultaneous binding of two different drugs in the binding pocket of the human multidrug resistance P-glycoprotein. J. Biol. Chem. 278, 39706–39710. [DOI] [PubMed] [Google Scholar]
- Wang Q.; Rager J. D.; Weinstein K.; Kardos P. S.; Dobson G. L.; Li J.; Hidalgo I. J. (2005) Evaluation of the MDR-MDCK cell line as a permeability screen for the blood-brain barrier. Int. J. Pharm. 288, 349–359. [DOI] [PubMed] [Google Scholar]
- Mahar Doan K. M.; Humphreys J. E.; Webster L. O.; Wring S. A.; Shampine L. J.; Serabjit-Singh C. J.; Adkison K. K.; Polli J. W. (2002) Passive permeability and P-glycoprotein-mediated efflux differentiate central nervous system (CNS) and non-CNS marketed drugs. J. Pharmacol. Exp. Ther. 303, 1029–1037. [DOI] [PubMed] [Google Scholar]
- Dagenais C.; Avdeef A.; Tsinman O.; Dudley A.; Beliveau R. (2009) P-glycoprotein deficient mouse in situ blood-brain barrier permeability and its prediction using an in combo PAMPA model. Eur. J. Pharm. Sci. 38, 121–137. [DOI] [PMC free article] [PubMed] [Google Scholar]
- Broccatelli F.; Larregieu C. A.; Cruciani G.; Oprea T. I.; Benet L. Z. (2012) Improving the prediction of the brain disposition for orally administered drugs using BDDCS. Adv. Drug Delivery Rev. 64, 95–109. [DOI] [PMC free article] [PubMed] [Google Scholar]
- Ghose A. K.; Herbertz T.; Hudkins R. L.; Dorsey B. D.; Mallamo J. P. (2012) Knowledge-Based, Central Nervous System (CNS) Lead Selection and Lead Optimization for CNS Drug Discovery. ACS Chem. Neurosci. 3, 50–68. [DOI] [PMC free article] [PubMed] [Google Scholar]
- Subramanian G.; Kitchen D. B. (2003) Computational models to predict blood-brain barrier permeation and CNS activity. J. Comput.-Aided Mol. Des. 17, 643–664. [DOI] [PubMed] [Google Scholar]
- Fan Y.; Unwalla R.; Denny R. A.; Di L.; Kerns E. H.; Diller D. J.; Humblet C. (2010) Insights for predicting blood-brain barrier penetration of CNS targeted molecules using QSPR approaches. J. Chem. Inf. Model. 50, 1123–1133. [DOI] [PubMed] [Google Scholar]
- Liu X.; Smith B. J.; Chen C.; Callegari E.; Becker S. L.; Chen X.; Cianfrogna J.; Doran A. C.; Doran S. D.; Gibbs J. P.; Hosea N.; Liu J.; Nelson F. R.; Szewc M. A.; Van Deusen J. (2005) Use of a physiologically based pharmacokinetic model to study the time to reach brain equilibrium: an experimental analysis of the role of blood-brain barrier permeability, plasma protein binding, and brain tissue binding. J. Pharmacol. Exp. Ther. 313, 1254–1262. [DOI] [PubMed] [Google Scholar]
- Shirasaka Y.; Sakane T.; Yamashita S. (2008) Effect of P-glycoprotein expression levels on the concentration-dependent permeability of drugs to the cell membrane. J. Pharm. Sci. 97, 553–565. [DOI] [PubMed] [Google Scholar]
- Tachibana T.; Kitamura S.; Kato M.; Mitsui T.; Shirasaka Y.; Yamashita S.; Sugiyama Y. (2010) Model analysis of the concentration-dependent permeability of P-gp substrates. Pharm. Res. 27, 442–446. [DOI] [PubMed] [Google Scholar]
- Lentz K. A.; Polli J. W.; Wring S. A.; Humphreys J. E.; Polli J. E. (2000) Influence of passive permeability on apparent P-glycoprotein kinetics. Pharm. Res. 17, 1456–1460. [DOI] [PubMed] [Google Scholar]
- Reichel A. (2009) Addressing central nervous system (CNS) penetration in drug discovery: basics and implications of the evolving new concept. Chem. Biodiversity 6, 2030–2049. [DOI] [PubMed] [Google Scholar]
- Jeffrey P.; Summerfield S. (2010) Assessment of the blood-brain barrier in CNS drug discovery. Neurobiol. Dis. 37, 33–37. [DOI] [PubMed] [Google Scholar]
- Dolghih E.; Bryant C.; Renslo A. R.; Jacobson M. P. (2011) Predicting binding to p-glycoprotein by flexible receptor docking. PLoS Comput. Biol. 7, e1002083. [DOI] [PMC free article] [PubMed] [Google Scholar]
- Leung S. S.; Mijalkovic J.; Borrelli K.; Jacobson M. P. (2012) Testing physical models of passive membrane permeation. J. Chem. Inf. Model. 52, 1621–1636. [DOI] [PMC free article] [PubMed] [Google Scholar]
- Feng B.; Mills J. B.; Davidson R. E.; Mireles R. J.; Janiszewski J. S.; Troutman M. D.; de Morais S. M. (2008) In vitro P-glycoprotein assays to predict the in vivo interactions of P-glycoprotein with drugs in the central nervous system. Drug Metab. Dispos. 36, 268–275. [DOI] [PubMed] [Google Scholar]
- Wager T. T.; Chandrasekaran R. Y.; Hou X. J.; Troutman M. D.; Verhoest P. R.; Villalobos A.; Will Y. (2010) Defining Desirable Central Nervous System Drug Space through the Alignment of Molecular Properties, in Vitro ADME, and Safety Attributes. ACS Chem. Neurosci. 1, 420–434. [DOI] [PMC free article] [PubMed] [Google Scholar]
- Polli J. W.; Wring S. A.; Humphreys J. E.; Huang L.; Morgan J. B.; Webster L. O.; Serabjit-Singh C. S. (2001) Rational use of in vitro P-glycoprotein assays in drug discovery. J. Pharmacol. Exp. Ther. 299, 620–628. [PubMed] [Google Scholar]
- Carrara S.; Reali V.; Misiano P.; Dondio G.; Bigogno C. (2007) Evaluation of in vitro brain penetration: optimized PAMPA and MDCKII-MDR1 assay comparison. Int. J. Pharm. 345, 125–133. [DOI] [PubMed] [Google Scholar]
- Chen C.; Hanson E.; Watson J. W.; Lee J. S. (2003) P-glycoprotein limits the brain penetration of nonsedating but not sedating H1-antagonists. Drug Metab. Dispos. 31, 312–318. [DOI] [PubMed] [Google Scholar]
- Katoh M.; Nakajima M.; Yamazaki H.; Yokoi T. (2000) Inhibitory potencies of 1,4-dihydropyridine calcium antagonists to P-glycoprotein-mediated transport: comparison with the effects on CYP3A4. Pharm. Res. 17, 1189–1197. [DOI] [PubMed] [Google Scholar]
- Choo E. F.; Leake B.; Wandel C.; Imamura H.; Wood A. J.; Wilkinson G. R.; Kim R. B. (2000) Pharmacological inhibition of P-glycoprotein transport enhances the distribution of HIV-1 protease inhibitors into brain and testes. Drug Metab. Dispos. 28, 655–660. [PubMed] [Google Scholar]
- Schwab D.; Fischer H.; Tabatabaei A.; Poli S.; Huwyler J. (2003) Comparison of in vitro P-glycoprotein screening assays: recommendations for their use in drug discovery. J. Med. Chem. 46, 1716–1725. [DOI] [PubMed] [Google Scholar]
- Shepard R. L.; Winter M. A.; Hsaio S. C.; Pearce H. L.; Beck W. T.; Dantzig A. H. (1998) Effect of modulators on the ATPase activity and vanadate nucleotide trapping of human P-glycoprotein. Biochem. Pharmacol. 56, 719–727. [DOI] [PubMed] [Google Scholar]
- Lee G.; Dallas S.; Hong M.; Bendayan R. (2001) Drug transporters in the central nervous system: brain barriers and brain parenchyma considerations. Pharmacol. Rev. 53, 569–596. [PubMed] [Google Scholar]
- Jani M.; Szabo P.; Kis E.; Molnar E.; Glavinas H.; Krajcsi P. (2009) Kinetic characterization of sulfasalazine transport by human ATP-binding cassette G2. Biol. Pharm. Bull. 32, 497–499. [DOI] [PubMed] [Google Scholar]
- Yu L.; Zeng S. (2007) Transport characteristics of zolmitriptan in a human intestinal epithelial cell line Caco-2. J. Pharm. Pharmacol. 59, 655–660. [DOI] [PubMed] [Google Scholar]
- Kouzuki H.; Suzuki H.; Sugiyama Y. (2000) Pharmacokinetic study of the hepatobiliary transport of indomethacin. Pharm. Res. 17, 432–438. [DOI] [PubMed] [Google Scholar]
- Street J. A.; Hemsworth B. A.; Roach A. G.; Day M. D. (1979) Tissue levels of several radiolabelled beta-adrenoceptor antagonists after intravenous administration in rats. Arch. Int. Pharmacodyn. Ther. 237, 180–190. [PubMed] [Google Scholar]
- Hitchcock S. A. (2012) Structural Modifications that Alter the P-Glycoprotein Efflux Properties of Compounds. J. Med. Chem. 55, 4877–4895. [DOI] [PubMed] [Google Scholar]
- Friesner R. A.; Banks J. L.; Murphy R. B.; Halgren T. A.; Klicic J. J.; Mainz D. T.; Repasky M. P.; Knoll E. H.; Shelley M.; Perry J. K.; Shaw D. E.; Francis P.; Shenkin P. S. (2004) Glide: a new approach for rapid, accurate docking and scoring. 1. Method and assessment of docking accuracy. J. Med. Chem. 47, 1739–1749. [DOI] [PubMed] [Google Scholar]
- Kaminski G. A.; Friesner R. A.; Tirado-Rives J.; Jorgensen W. L. (2001) Evaluation and reparametrization of the OPLS-AA force field for proteins via comparison with accurate quantum chemical calculations on peptides. J. Phys. Chem. B 105, 6474–6487. [Google Scholar]
- Jorgensen W. L.; Tiradorives J. (1988) The Opls Potential Functions for Proteins - Energy Minimizations for Crystals of Cyclic-Peptides and Crambin. J. Am. Chem. Soc. 110, 1657–1666. [DOI] [PubMed] [Google Scholar]
- Friesner R. A.; Murphy R. B.; Repasky M. P.; Frye L. L.; Greenwood J. R.; Halgren T. A.; Sanschagrin P. C.; Mainz D. T. (2006) Extra precision glide: docking and scoring incorporating a model of hydrophobic enclosure for protein-ligand complexes. J. Med. Chem. 49, 6177–6196. [DOI] [PubMed] [Google Scholar]
- Rezai T.; Bock J. E.; Zhou M. V.; Kalyanaraman C.; Lokey R. S.; Jacobson M. P. (2006) Conformational flexibility, internal hydrogen bonding, and passive membrane permeability: successful in silico prediction of the relative permeabilities of cyclic peptides. J. Am. Chem. Soc. 128, 14073–14080. [DOI] [PubMed] [Google Scholar]
- Kalyanaraman C.; Jacobson M. P. (2007) An atomistic model of passive membrane permeability: application to a series of FDA approved drugs. J. Comput.-Aided Mol. Des. 21, 675–679. [DOI] [PubMed] [Google Scholar]
Associated Data
This section collects any data citations, data availability statements, or supplementary materials included in this article.


