

Abstract
Inherently unstable, detergent-solubilized membrane protein complexes can often not be crystallized. For complexes that have a mass of >300 kDa, cryo-electron microscopy (EM) allows their three-dimensional (3D) structure to be assessed to a resolution that makes secondary structure elements visible in the best case. However, many interesting complexes exist whose mass is below 300 kDa and thus need alternative approaches. Two methods are reviewed: (i) Mass measurement in a scanning transmission electron microscope, which has provided important information on the stoichiometry of membrane protein complexes. This technique is applicable to particulate, filamentous and sheet-like structures. (ii) 3D-EM of negatively stained samples, which determines the molecular envelope of small membrane protein complexes. Staining and dehydration artifacts may corrupt the quality of the 3D map. Staining conditions thus need to be optimized. 3D maps of plant aquaporin SoPIP2;1 tetramers solubilized in different detergents illustrate that the flattening artifact can be partially prevented and that the detergent itself contributes significantly. Another example discussed is the complex of G protein-coupled receptor rhodopsin with its cognate G protein transducin.
Keywords: 3D-electron microscopy, detergent belt, membrane protein complex, negative staining, rhodopsin-transducin complex, scanning transmission electron microscopy
Introduction
Membrane proteins fulfill a large variety of vital physiological functions and are important drug targets. Approximately 26% of the human genes have been estimated to code membrane proteins [1]. Structural information is key to understanding the chemistry and biology of membrane protein function and for developing new drugs. However, the complex physical chemistry of membrane proteins has made them difficult to express, purify and crystallize. About 300 unique membrane protein structures are in the Protein Data Bank archive, which comprises 85 000 structures, with a minority of them from human membrane proteins (<20), reflecting the hurdles in the determination of membrane protein structure. Although X-ray crystallography has contributed the vast majority of membrane protein structures [2], electron crystallography has produced atomic structures of bacteriorhodopsin [3–5], acetylcholine receptor [6–8], tubulin [9] and different aquaporins [10–13]. Moreover, cryo-electron microscopy (EM) has made tremendous progress as a result of improved instrumentation and image processing methods. Maps calculated from projections of vitrified complexes have reached a resolution that allows the polypeptide backbone to be traced and side-chain densities to be assigned [14]. Such complexes need to be large enough to produce sufficient signal for accurate alignment as illustrated in [15], yet thin enough to prevent phase errors across the depth of the particle [16].
Membrane protein complexes that are too small for cryo-EM and that cannot be crystallized can be quantitatively analyzed by scanning transmission electron microscopy (STEM) and their 3D envelope can be determined by negative stain transmission EM. Here we review mass determination by STEM [17] and present a short summary of negative staining [18–20]. We have applied negative staining to assess the detergent belt that keeps an aquaporin tetramer in solution for different detergents and measured belt dimensions. The recent low-resolution structure of the active rhodopsin-G protein (Rho*-Gt) heteropentamer [21] is discussed in view of the detergent belt sizes measured.
Materials and methods
Expression and purification of SoPIP2;1
Expression of SoPIP2;1 in Pichia pastoris strain X-33 using the EasySelect™ Pichia Expression Kit (Invitrogen, Carlsbad, CA, USA) was performed as described [22]. Pichia pastoris cultures were grown in 1 L BMGY medium at 29–30°C for 48 h on a shaker operated at 180 rpm. Subsequently, the medium was exchanged to 10 L (BMMY) and overexpression induced with 0.5% methanol. Sterile methanol (0.5%) was added every 24 h. Cells were harvested after 96 h, resuspended in 100 mL of breaking buffer (50 mM phosphate buffer; pH 7.4, 1 mM EDTA, 5% glycerol, 1 mM PMSF added shortly before use) and lysed by 4 passages at 110 psi through a microfluidizer (Microfluidics Inc., Newton, Ma). The lysate was centrifuged at 10 000g to remove cell walls and unbroken cells, before pelleting the membranes at 125 000g for 2 h. The pellet was subsequently resuspended and homogenized in breaking buffer (3 mL/2.5 L of culture). Peripheral and membrane-associated proteins were removed by urea/alkaline washing. Three milliliter aliquots of homogenized membranes were mixed with 90 mL of 4 M urea, 5 mM Tris–HCl; pH 9.5, 5 mM EDTA, 5 mM EGTA, 0.01% NaN3, re-homogenized and pelleted at 150 000g (1 h, 4°C), homogenized in 20 mM NaOH, pelleted at 150 000g (1 h, 4°C), homogenized in 5 mM Tris–HCl, pH 8.0, 2 mM EDTA, 2 mM EGTA, 100 mM NaCl, centrifuged at 150 000g, 1 h, 4°C, and resuspended in 4 mL of 10 mM phosphate buffer; pH 7.8, 50 mM NaCl, 10% glycerol, 0.03% NaN3.
Membranes were solubilized by gently stirring them in 10 mM phosphate buffer; pH 7.8, containing 6% OG, 10% glycerol and 0.03% NaN3 at room temperature for 4 h. Insolubilized material was pelleted by ultracentrifugation for 1 h at 200 000g and 4°C. The supernatant was diluted 1:1 with equilibration buffer (10 mM phosphate buffer; pH 7.8, containing 2% OG, 0.01% NaN3) to lower the salt concentration before binding to the cation exchange column consisting of CM Sepharose Fast Flow, which was previously washed with ∼10× bed volume of 1 M NaCl and 10× bed volume of equilibration buffer. Column-bound material was washed with 5–10× bed volume of equilibration buffer and the wash was collected in 1 mL fractions. SoPIP2;1 was eluted with different detergents [2% n-octyl-β-D-glucopyranoside (OG), 0.1% n-dodecyl-β-D-maltoside (DDM), 0.05% lauryl maltose neopentyl glycol (LMNG)] in 10 mM phosphate buffer; pH 7.8, 200 mM NaCl, 0.01% NaN3. Amphipol exchange was performed as described in [23].
Negative staining and EM
Purified protein solutions were diluted to 10 µg mL–1 in a buffer solution containing 20 mM Tris–HCl (pH 8.0), 100 mM NaCl, and the corresponding detergent, a diluted tobacco mosaic virus (TMV) solution was added at a volume ratio of 1:10 to reach a TMV concentration of ∼5 µg mL–1, and protein complexes were adsorbed for 1 min to glow-discharged, 400 mesh carbon-coated grids. The grids were washed on 4 drops of distilled H2O and negatively stained with 2% (w/v) uranyl acetate. Both single-film and double-film sandwich negative staining methods were used [19]. A sufficiently thick film of stain solution was left on the grid before letting it dry.
Micrographs were taken at low dose on a FEI TF20 operated at 200 kV (FEI, Eindhoven, Netherlands). Tilt pairs were recorded at 0° and 45° or 0° and 60° tilt, at a nominal magnification of 69 000× on a Gatan Ultrascan 4 k CCD (Gatan Inc, Pleasanton, CA 94588, USA). The magnification was calibrated a posteriori by measuring the meridional reflection of co-prepared TMV.
Image processing
For contrast transfer function (CTF) correction, a Wiener filter approach was implemented in the SEMPER package [24] and applied to all the images prior to particle selection. The defocus was determined for 8 × 8 regions containing 5122 pixels to define tilt angle and axis. Stripes with a defocus range Δf < 50 nm were selected, CTF-corrected and merged in the CTF corrected image [25]. Tilt angle values obtained by the CTF correction approach corresponding to those obtained from the pair-picking algorithm within 0.2 ± 0.6°, as measured for one series comprised of 24 tilt pairs.
Single-particle processing was performed with the EMAN2 software package [26]. Particle pairs were selected manually by using the tilt pair picker implemented in EMAN2. The random conical tilt (RCT) method [27] was accomplished as described in the EMAN2 documentation and with the help of John Flanagan and Steven Ludtke. Alternatively, initial models were calculated from 96 class averages of each set of the SoPIP2;1 preparations solubilized in OG, DDM, LMNG and AMPH, using the standard protocol offered by EMAN2, imposing C4 symmetry. Initial models were refined until no visual changes were detected using the standard EMAN2 protocol, and their resolution was measured with the Fourier shell correlation method. Maps were displayed using Chimera [28], setting the isocontour threshold to include the total mass of the complex and the detergent bound to it.
Scanning transmission electron microscopy (STEM)
The STEM raster scans a focused electron beam (the probe) over n2 picture elements (pixels), and collects ∼70% of all elastically scattered electrons by the annular dark-field detector to produce an image of particular clarity [29]. Assuming perfect electronic and mechanical stability, the resolution is given by the properties of the probe forming objective lens/corrector system and can be better than 1 Å [30]. This resolution cannot be achieved on beam-sensitive samples such as biological macromolecules, where the structure is changed at a dose of ∼100–500 electrons per nm2. The annular dark-field detector counts single electrons producing a digital signal (ADS) that is directly proportional to the number of atoms, N, irradiated by the STEM probe, weighted by their elastic scattering cross sections, σ, and the collection efficiency, ε. This signal can thus be used as a measure of mass [31,32]:
where D is the dose determined by the probe current, dwell time and pixel area. Electron-counting statistics and background fluctuations resulting from the thin carbon film dictate the mass resolution [17]. Mass information on particles, filaments and planar structures is extracted from these digital dark field images by the software package MASDET [33].
To determine the mass of protein complexes to an absolute accuracy of ±3%, the instrumentation needs to be precisely calibrated and the samples prepared with all precautions to prevent contaminants that would impair the mass measurement [34]. Protein solutions are adsorbed to thin carbon films, washed extensively with double-distilled water and freeze-dried. Single membrane protein complexes, tubular structures and reconstituted 2D crystals have been studied by STEM, yielding data on their stoichiometry, detergent-binding capacity and their structure [35]. STEM determined the mass of OG solubilized human aquaporin-1 (AQP1) tetramers to 202 ± 3 kDa [36], compatible with the mass of three unmodified polypeptides of 28 kDa each, one glycosylated polypeptide of 50 kDa [37] and 68 kDa of bound OG (Fig. 1a and b; [36]). The error given is the standard error of the mean. However, the calibration error of the method limits it absolute relative accuracy to ±3% [34].
Fig. 1.

Mass determination of solubilized membrane protein complexes by electron scattering. (a) Dark-field STEM image of OG-solubilized AQP1 oligomers. The relatively high recording dose of 1100 electrons per nm2 allows unstained AQP1 oligomers to be easily distinguished. Scale bar, 100 nm. (b) The histogram displays the raw mass data of 3309 particles, from images recorded in the dose range 200–1100 electrons per nm2. Beam-induced mass-loss was corrected by extrapolation of the data set to zero dose by linear regression, giving a mass of 202 ± 3 kDa (99% confidence band). The error given is the standard error of the mean and does not take calibration error into account. (c) Low-dose STEM dark-field image of freeze-dried Rho*-Gt complex solubilized in DDM recorded at 300 electrons per nm2. White circles mark particles selected for mass analysis and gray circles the areas selected for background determination. Selection was based on size, shape and brightness of the particles. The large fraction of particles in this field with either low intensities or sizes smaller than 100 Å resulted from dissociated Rho*-Gt complexes. Scale bar: 500 Å. (Inset) From a total of 136 particle projections of the major mass-histogram population (average mass 211 ± 17 kDa), three class averages comprising 116 projections were calculated using the EMAN software. The class averages indicate that the projections of the selected unstained, freeze-dried particles are elongated and have a length of ∼130 Å. The precision of the measurement is limited by the pixel size of 9.2 Å required to record digital, low-dose, dark-field STEM images for mass measurement. Scale bar: 150 Å. (d) Histogram of particle masses measured for freeze-dried, unstained Rho*-Gt samples by STEM. The major peak is at 221 kDa, suggesting that the Rho*-Gt complex is composed of 2 Rho* molecules (monomer mass: 39 kDa) and one Gt molecule (heterotrimer mass: 86 kDa) with associated DDM. The fitted Gaussian peaks have variable widths (standard deviations); the position of the major peak has an uncertainty of ±12 kDa. Secondary peaks are Rho*-Gt aggregates comprising 2, 3 or 4 complexes.
Recently, the mass of the solubilized Rho*-Gt heteropentamer has been determined by STEM [21]. Unstained, freeze-dried Rho*-Gt complexes were imaged by low-dose dark-field STEM (Fig. 1c), and mass values calculated from their electron scattering power were assembled in a histogram (Fig. 1d). The major particle population had a mass of 221 ± 12 kDa, whereas secondary peaks represented multiples of this value. This result agrees best with a 2:1 Rho (39 kDa) : Gt (86 kDa) absolute stoichiometry, because the expected heteropentamer mass is ∼210–240 kDa, depending on the amount of the bound detergent. Average projections calculated for particles from the major population having a mass of ∼220 kDa revealed elongated particles that are ∼130 Å long and 90 Å wide (inset Fig. 1c).
Negative staining
Preserving the structure of protein complexes for exposure to a high vacuum is a challenge, which has been overcome by the vitrification method [38]. As a result of low contrast and beam sensitivity of vitrified protein solution layers, it is difficult to visualize protein complexes <300 kDa. Preparing them in a solution of a heavy metal salt and air-drying defines their envelope as a result of the stain's high electron scattering power. However, during dehydration the surface tension at the receding air–liquid interface may flatten and distort proteins and their assemblies. If the stain layer is sufficiently thick to support the protein complexes during dehydration, the structural preservation is adequate and the contrast provided by the stain allows small protein complexes to be depicted [18,19]. One simple measure to judge the stain layer thickness is the co-preparation of TMV, a compact helical cylinder with a diameter of 180 Å and a pitch of 23 Å. When the TMV is properly embedded, its width is close to 180 Å and it changes less than 15% upon tilting. Even large protein complexes in the vicinity of such TMV rods will only be flattened marginally by surface tension during dehydration. In addition, TMV may serve as an accurate magnification standard.
Vitrification of protein solutions containing ammonium molybdate overcomes the surface tension artifacts, delivers high contrast [39] and reduces the sample's beam sensitivity [40]. Increased exposure of the sample to the saturated ammonium molybdate staining solution may however induce dissociation of protein complexes [41], thus limiting its applicability. Another problem of this method is its incompatibility with the presence of detergents that are indispensible for keeping membrane proteins in solution. Negative staining, whether applied during air-drying or using the vitrification method, remains to be the method of choice to visualize (membrane) protein complexes <300 kDa. A critical comparison of samples prepared either by negative staining or vitreous ice for 3D-EM [42] led to the conclusion that both techniques have their strengths and limitations, which remains essentially the same today [20].
Negative stain TEM is certainly an excellent method to assess the quality of a purified membrane protein preparation. Homogeneity and purity are directly revealed – a more stringent test than SDS gels, gel filtration profiles or dynamic light-scattering measurements. Here we present recent results that demonstrate the usefulness of conventional negative staining for the visualization of membrane protein complexes <300 kDa.
Results: application of negative staining to aquaporin tetramers
The quality of purified plant aquaporin SoPIP2;1 is exemplified in Fig. 2. This complex has a slightly smaller mass than the solubilized AQP1 tetramer (4 × 29.9 kDa + 68 kDa ≈190 kDa) and thus cannot easily be observed in a vitrified state. The tilt pair in Fig. 2a and b also shows TMV rods viewed at 0° and 45° tilt. At 0° the TMV has a width of 195 ± 5 Å indicating a flattening of ≈10%, which is reflected by the width of the same TMV projected at a 45° tilt, 165 ± 4 Å. In this situation the SoPIP2;1 tetramers, which have a thickness of ∼60 Å, are well embedded in the continuous stain layer.
Fig. 2.

Tilt pair of negatively stained SoPIP2;1 tetramers and co-prepared TMV. (a) The homogeneity of the preparation is illustrated by the image taken at a 0° tilt. As a result of sample flattening the TMV is 195 ± 5 Å wide instead of 180 Å. (b) Same area taken at a 45° tilt indicates the quality of the stain layer. The TMV rod is narrower (163 ± 4 Å than in a) compatible with a flattening of approximately 10%. (c and d) Magnified areas of the tilt pairs marked in (a and b). (e and f) CTF corrected areas displayed in (c) and (d). The marked boxes have a width of 890 Å.
Figure 2c and d display two selected areas from the tilt pair in Fig. 2a and b. They provide a closer view of particles, whose square shape is visible in some cases. Particles are more clearly seen on the same areas after CTF correction (Fig. 2e and f). Comparing the shapes of particle projections from the tilted sample with those recorded at 0° suggests that many of the SoPIP2;1 tetramers from the grid held at 0° are not projected along the 4-fold axis of the particle, reflecting the roughness of the carbon film to which they adsorb.
Visualization of the detergent belt by 3D reconstruction
3D maps from tilt pairs of SoPIP2;1 tetramers solubilized in OG, DDM, LMNG and amphipol A8-35 (AMPH) were calculated to assess the size of the detergent belt. Because all preparations were derived from the initially OG-solubilized membranes by exchanging detergents during later steps in the purification procedure, protein complexes were likely devoid of lipids (see Material and Methods).
The RCT approach [27] is the method of choice to bootstrap a 3D map from particle projections, as it avoids the need to generate an initial model that would introduce a bias. RCT requires pairs of particle projections recorded at tilts of 0° and ≥45°. Preferably, micrograph pairs are CTF corrected (see Material and Methods) before particle pairs are selected, because a posteriori CTF correction of particle projections from a tilted sample is difficult. In addition, sample projections are more easily selected after CTF correction as demonstrated in Fig. 2e and f. Class averages from projections taken at 0° tilt that reflect the major features of the protein complex are selected to calculate maps from the corresponding projections taken at a 45° tilt, whose Euler angles are calculated from the tilt geometry and the angular alignment of corresponding 0° projections.
This approach was not successful with projections of negatively stained SoPIP2;1 tetramers shown in Fig. 2, although the 0° projections yielded convincing class averages (Fig. 3a). From tilt pairs of the 23 best classes, individual 3D maps were calculated using the RCT algorithm implemented in EMAN2 [26]. Nine 3D maps showed sections exhibiting the 4-fold symmetry of the complex, one example being displayed in Fig. 3b. These maps were aligned, averaged and 4-fold symmetrized. As illustrated in Fig. 3b, 32 sections have a signal above background in their center, corresponding to a particle thickness of 111 Å. Accordingly, the resulting structure is elongated along the 4-fold symmetry axis and reflects the missing cone problem, as illustrated by Fig. 3c.
Fig. 3.

3D reconstruction of the OG-solubilized SoPIP2;1 tetramer. (a) Class averages from the tilt pair particles taken at 0° tilt. Many show the 4-fold symmetry of the complex. The random conical tilt method was used to calculate 3D maps for twenty-three 0° classes from the corresponding particles recorded at a 45° tilt; nine maps exhibited sections with C4 symmetry. Asterisks mark the corresponding class averages. (b) The stack of sections from the best of the nine maps. 32 sections of 3.48 Å thickness exhibit a central signal above background, corresponding to a particle thickness of 111 Å. (c) Accordingly, the C4 symmetrized average of the nine maps has an elongated shape, indicating the missing cone artifact. (d) A larger variety of class averages is obtained when 0° and 45° particle projections are merged. (e) Imposing C4 symmetry and applying the statistical method implemented in EMAN2, initial models emerge from the class averages in (d) that reflect the rough shape of a SoPIP2;1 tetramer. (f) Refining the merged dataset against any of the initial models in (e) produced the map of the OG-solubilized SoPIP2;1 tetramer at 24 Å resolution. The isocontoured surface includes a mass of 190 kDa. The atomic model fitted manually demonstrates negligible flattening and allows the thickness of the detergent to be measured. All boxes are 223 Å wide. Scale bars represent 50 Å in (c, and e), and 20 Å in (f).
Instead, initial models were generated by applying the standard EMAN2 protocol to class averages calculated from the entire data set including both the 0° and 45° projections (Fig. 3d). Imposing the C4 symmetry during model generation yielded a convincing result: the majority of generated models suit for bootstrapping the refinement (Fig. 3e). The refinement was accomplished following the EMAN2 standard protocol, leading to the 3D map shown in Fig. 3f. Its resolution is 24 Å as determined by the Fourier shell correlation method.
Using the same approach, maps for SoPIP2;1 solubilized in DDM (resolution: 24 Å), LMNG (resolution: 25 Å), and AMPH (resolution: 28 Å) were determined (Fig. 4). Maps were rendered to include a mass of 190 kDa (OG; based on STEM mass measurements), 220 kDa (DDM; based on the assumption that the same number (230) of DDM molecules bind as OG molecules), 280 kDa (LMNG; based on visual inspection, corresponding to 160 LMNG molecules bound per tetramer) and 340 kDa (AMPH; based on the amphipol binding capacity of bacteriorhodopsin of 1.8–2 (w/w) [43]). Accordingly, the detergent belts had a thickness of 11 ± 2 A (OG), 13 ± 2 Å (DDM), 15 ± 2 Å (LMNG) and 19 ± 3Å (AMPH), as summarized in Table 1. The pronounced central cavity observed in the maps of SoPIP2;1 solubilized by LMNG or AMPH is likely related to a dehydration artifact (Fig. 5).
Fig. 4.
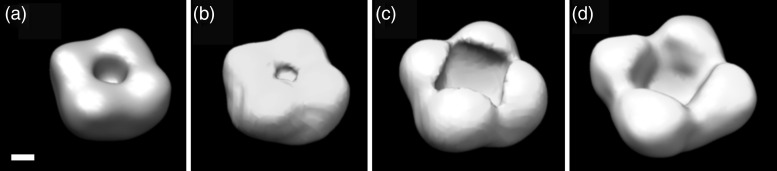
3D maps of SoPIP2;1 tetramers solubilized in OG (a), DDM (b), LMNG (c) and AMPH (d). Isocontours include 190 kDa (a), 220 kDa (b), 280 kDa (c) and 340 kDa (d). Scale bar represents 20 Å.
Table 1.
Parameters characterizing SoPIP2;1 tetramers solubilized in different detergents
| Detergents | OG | DDM | LMNG | AMPH |
|---|---|---|---|---|
| Resolution [Å] | 24 | 24 | 25 | 28 |
| Mass of protein and detergent [kDa] | 190 | 220 | 280 | 340 |
| Detergent belt thickness [Å] | 11 ± 2 | 13 ± 2 | 15 ± 2 | 19 ± 3 |
Fig. 5.

Maps of DDM (a), LMNG (b) and AMPH (c) solubilized SoPIP2;1 tetramers. The individual monomers of the atomic model have been rotated by ∼10° in (b and c) to open the central cavity according to the 3D maps of Fig. 4c and d. Scale bar represents 20 Å.
Summary of the rhodopsin-transducin heteropentamer structure
Absorption of a photon by the G protein-coupled receptor (GPCR) rhodopsin (Rho) initiates the process of vision [44,45]. Rho transitions to its activated form (Rho*), which binds the heterotrimeric G protein transducin (Gt) inducing GDP to GTP exchange and Gt dissociation. These events proceed in the rod outer segments (ROS) of photoreceptors, highly specialized neurons of the retina. A ROS houses a stack of many hundreds of disk membranes that are densely packed with Rho. Atomic force microscopy of native disks revealed Rho to be arranged in rows of dimers [46], a result that has been highly debated because of the on-going controversy whether GPCRs function as monomer or oligomer [47–49].
In pursuit of the molecular architecture of the active Rho*-Gt complex, we used nucleotide depletion and affinity chromatography to purify and analyze the DDM-solubilized complex biochemically and structurally [21]. STEM showed its mass to be 221 ± 12 kDa (Fig. 1d). Since this complex was too small for cryo-EM of vitrified protein solution, negatively stained preparations were imaged by TEM, and 3D maps were determined from projections of Rho*-Gt complexes (Fig. 6; [21]). This transient complex is labile and exhibits heterogeneity when visualized by negative stain EM (Fig. 6a). Elongated particles that have a length of ∼130 Å can nevertheless be discerned and >10 000 projections were selected for producing 3D maps (Fig. 6b). A model of the Rho*-Gt complex was then built to fill this low-resolution envelope defined by the stain, taking into account all biochemical and structural information available [21]. Figure 6c demonstrates the fit of the Rho dimer and allows the detergent belt to be measured. Its thickness is variable and has an average value of 11 ± 4 Å, slightly smaller than the DDM belt found on SoPIP2;1 tetramers.
Fig. 6.

The Rho*-Gt heteropentamer [21]. (a) Negatively stained preparations demonstrate the presence of elongated particles of ∼130 Å length, but also the heterogeneity of these labile complexes that dissociate during isolation. (b) 3D maps of the Rho*-Gt heteropentamer calculated from >10 000 projections of crosslinked complexes (top row) and from >1000 projections of native complexes (bottom row). (c) Views of the 3D map and the fitted model of the Rho*-Gt heteropentamer. Scale bars represent 200 Å in (a), 100 Å in (b) and 20 Å in (c). Panel (b) was adapted from [21].
Discussion
STEM and negative staining are methods that still are of great practical value, although the observation of vitrified layers of protein solutions has now become the predominant method for structural analyses by EM. In particular, negative staining is the only approach to obtain useful information by EM on protein complexes that have a mass of <300 kDa and that cannot be crystallized [19,50]. Here we review these methods and illustrate their usefulness with two examples. The first concerns a study of the detergent belt keeping the plant aquaporin SoPIP2;1 in solution, the second is the recently published low-resolution structure of the Rho*-Gt heteropentamer. Both complexes have a mass that makes them unsuitable for cryo-EM in the vitrified state (SoPIP2;1: 190 kDa; Rho*-Gt heteropentamer: 220 kDa), and both are solubilized by detergents.
The importance of stain quality is documented in Fig. 2. Uranyl formate is known to be among the best staining salts in terms of graininess [50]. However, the thickness and evenness of the stain layer is likely to play a more important role than the stain itself. We have used uranyl acetate throughout in this study and have obtained 3D maps of the SoPIP2;1 solubilized either in OG or in DDM, which did not exhibit the common flattening artifacts (Figs. 3 and 4). Using the same approach for preparing tetramers kept soluble by the larger micelles formed by LMNG and AMPH, however, a staining artifact emerged that led to a large cavity at the 4-fold symmetry center. Intuitively, this puzzling observation may be related to the soft 15 Å (LMNG) or 19 Å (AMPH) belts, which are considerably larger than those of OG and DDM and do not pack the tetramers during dehydration as firmly as the drying, more solid stain layer. Hence, the initially small central cavity filled by stain will be enlarged by the crystallizing stain acting as a wedge, providing space for more stain to accumulate, as illustrated in the side views shown in Fig. 5. Such a pronounced central stain accumulation is also observed independent of the detergent used when the stain layer is too thin to provide support and tetramers are flattened by surface tension.
Negatively stained Rho*-Gt heteropentamers are partially flattened, because they were prepared with the double-film method [19], which warrants even staining and symmetrical embedding, but induces stronger dehydration forces than a sufficiently thick stain layer on single films. Further, the detergent ring, the softest part of the structure, being perpendicular to the carbon film, will be flattened more than the detergent micelle bound to SoPIP2;1. The overall result of these effects is a less clear contribution of the detergent in the DDM-solubilized Rho*-Gt heteropentamer (Fig. 6) than in the DDM-solubilized SoPIP2;1 tetramer, where the detergent belt is clearly visible (Fig. 5). Nevertheless, the 3D envelope of the Rho*-Gt complex is clearly not compatible with a tetrameric complex that comprises a single Rho molecule [21].
The detergent-binding capacity of membrane protein complexes has been subject to studies using different methods (see [51]). Ultracentrifugation [52,53], size exclusion chromatography [54] and surface tension measurements [55] have been used to determine the molecular ratio of detergent to protein. The numbers of bound detergent molecules per membrane protein are in general larger than those determined by STEM, because in the latter case protein complexes are extensively washed on 4 drops of double-distilled water after adsorption to the carbon film [34]. The mass of the bound detergent has been measured for many solubilized membrane protein complexes, showing that typically 2 detergent micelles remain bound to a membrane protein complex of 100–300 kDa in solution after extensive washing [17,35,56]. The dimensions of detergent belts have been measured by neutron diffraction [57], NMR [58] and EM [59–61]. Reported values are in the range of 8–20 Å, depending on the detergent and the measurement method. The values determined in this work (Table 1) are representative for negative stain electron microscopy and may help to interpret images of negatively stained membrane protein complexes. They agree within experimental errors with previous measurements (OG: 13 Å [57]; DDM: 14 Å [60]; AMPH: 20 Å [61] and 10-20 Å [62]). They contradict, however, the recent interpretation of single-particle averages of the LMNG solubilized β2-adrenoceptor-Gs complex, where the LMNG belt was assumed to have a thickness of >25Å [63].
The study of SoPIP2;1 tetramers provides insight into a practical limitation of the RCT approach. Tilt pairs of a protein complex adsorbed in a preferential orientation to the carbon film recorded at 0° and 45° inevitably leads to missing cone artifacts, as demonstrated by Fig. 3b and c. Although image pairs of samples tilted at 0° and 60° were recorded, suitable well-preserved particle pairs were sparse, which limited efficient particle selection and thus exploring if missing cone artifacts can be overcome (data not shown). In contrast, using large data sets of particle projections collected at tilts of 0° and 45° and the power of reference free alignment [64] and statistical classification [65,66] can yield a set of class averages (Fig. 3d) from which the statistical approach implemented in EMAN2 provides suitable initial models to bootstrap the refinement (Fig. 3e).
When a homogeneous sample such as the SoPIP2;1 tetramers discussed here is available, one expects images recorded at a 0° tilt to reveal mainly square-shaped particles. This is not the case, as illustrated in Fig. 2. Is it reasonable to argue that most of the particles have been substantially altered during sample preparation? Although negative staining has severe limitations, the outcome obtained by merging particle projections collected at tilts of 0° and 45° and keeping 80% of all projections in the refinement cycles suggests that most of these projections come from structurally well-preserved complexes. A better explanation for the different appearance of the particles than bad structural preservation is that they are projected from different angles. Even preferentially adsorbed small membrane protein complexes are expected to assume a broad range of orientations with respect to the carbon film plane, reflecting the carbon film surface roughness and the architecture of the detergent solubilized protein, as illustrated by refining the SoPIP2;1-OG map against all particle projections recorded at a 0° tilt. The Euler angle plot after one iteration shows that tetramers can be tilted over a range of ±40° and that a few particles appear to match calculated projections perpendicular to their 4-fold axis best (Fig. 7). This observation needs further quantification, which will be achieved with the tilt-pair parameter plot method [15].
Fig. 7.

Euler angle plots resulting from one refinement iteration against the particle projections recorded at a 0° tilt using the SoPIP2;1-OG map generated with the full data set. Particles appear to be tilted over the range ±40° and a minor particle population is viewed side-on. (a) the angular distribution and (b) the population of different projection directions. Plots have been generated using EMAN2 [26].
Concluding remarks
Electron microscopy offers excellent possibilities to study membrane proteins. If membrane protein complexes resist 2D or 3D crystallization and have a mass of <300 kDa, their mass can be measured by STEM and their 3D structure can be determined to a resolution of 20–30 Å by 3D-EM of negatively stained samples.
Funding
This work was supported by funding from the National Institutes of Health (EY008061, EY021126, EY019478, U54GM094598) and the Maurice E. Müller Foundation of Switzerland. A.V.F. and A.E. belong to the Transcontinental EM Initiative for Membrane Protein Structure (TEMIMPS), which is a center for membrane protein structure determination funded by the NIH Protein Structure Initiative under grant U54GM094598.
Acknowledgements
We thank Dr Per Kjellbom for the SDoPIP2;1 PICZ plasmid, Dr Ruben Diaz-Avalos for kindly providing TMV, Drs John Flanagan and Steven Ludtke for continuous support with the EMAN2 image-processing software, Dr David Lodowski for modeling, Dr Dimitrios Fotiadis for constructive discussions and Ms S. Roos (CWRU) for technical support.
References
- 1.Fagerberg L, Jonasson K, von Heijne G, Uhlen M, Berglund L. Prediction of the human membrane proteome. Proteomics. 2010;10:1141–1149. doi: 10.1002/pmic.200900258. [DOI] [PubMed] [Google Scholar]
- 2.Muller D J, Wu N, Palczewski K. Vertebrate membrane proteins: structure, function, and insights from biophysical approaches. Pharmacol. Rev. 2008;60:43–78. doi: 10.1124/pr.107.07111. [DOI] [PMC free article] [PubMed] [Google Scholar]
- 3.Grigorieff N, Ceska T A, Downing K H, Baldwin J M, Henderson R. Electron-crystallographic refinement of the structure of bacteriorhodopsin. J. Mol. Biol. 1996;259:393–421. doi: 10.1006/jmbi.1996.0328. [DOI] [PubMed] [Google Scholar]
- 4.Kimura Y, Vassylyev D G, Miyazawa A, Kidera A, Matsushima M, Mitsuoka K, Murata K, Hirai T, Fujiyoshi Y. Surface of bacteriorhodopsin revealed by high-resolution electron crystallography. Nature. 1997;389:206–211. doi: 10.1038/38323. [DOI] [PubMed] [Google Scholar]
- 5.Subramaniam S, Henderson R. Molecular mechanism of vectorial proton translocation by bacteriorhodopsin. Nature. 2000;406:653–657. doi: 10.1038/35020614. [DOI] [PubMed] [Google Scholar]
- 6.Miyazawa A, Fujiyoshi Y, Unwin N. Structure and gating mechanism of the acetylcholine receptor pore. Nature. 2003;423:949–955. doi: 10.1038/nature01748. [DOI] [PubMed] [Google Scholar]
- 7.Unwin N. Refined structure of the nicotinic acetylcholine receptor at 4A resolution. J. Mol. Biol. 2005;346:967–989. doi: 10.1016/j.jmb.2004.12.031. [DOI] [PubMed] [Google Scholar]
- 8.Unwin N, Fujiyoshi Y. Gating movement of acetylcholine receptor caught by plunge-freezing. J. Mol. Biol. 2012;422:617–634. doi: 10.1016/j.jmb.2012.07.010. [DOI] [PMC free article] [PubMed] [Google Scholar]
- 9.Nogales E, Wolf S G, Downing K H. Structure of the alpha beta tubulin dimer by electron crystallography. Nature. 1998;391:199–203. doi: 10.1038/34465. [DOI] [PubMed] [Google Scholar]
- 10.Gonen T, Cheng Y, Sliz P, Hiroaki Y, Fujiyoshi Y, Harrison S C, Walz T. Lipid-protein interactions in double-layered two-dimensional AQP0 crystals. Nature. 2005;438:633–638. doi: 10.1038/nature04321. [DOI] [PMC free article] [PubMed] [Google Scholar]
- 11.Mitsuma T, Tani K, Hiroaki Y, Kamegawa A, Suzuki H, Hibino H, Kurachi Y, Fujiyoshi Y. Influence of the cytoplasmic domains of aquaporin-4 on water conduction and array formation. J. Mol. Biol. 2010;402:669–681. doi: 10.1016/j.jmb.2010.07.060. [DOI] [PubMed] [Google Scholar]
- 12.Murata K, Mitsuoka K, Hirai T, Walz T, Agre P, Heymann J B, Engel A, Fujiyoshi Y. Structural determinants of water permeation through aquaporin-1. Nature. 2000;407:599–605. doi: 10.1038/35036519. [DOI] [PubMed] [Google Scholar]
- 13.Tani K, Mitsuma T, Hiroaki Y, Kamegawa A, Nishikawa K, Tanimura Y, Fujiyoshi Y. Mechanism of aquaporin-4s fast and highly selective water conduction and proton exclusion. J. Mol. Biol. 2009;389:694–706. doi: 10.1016/j.jmb.2009.04.049. [DOI] [PubMed] [Google Scholar]
- 14.Zhou Z H. Atomic resolution cryo electron microscopy of macromolecular complexes. Adv. Protein Chem. Struct. Biol. 2011;82:1–35. doi: 10.1016/B978-0-12-386507-6.00001-4. [DOI] [PMC free article] [PubMed] [Google Scholar]
- 15.Henderson R, Chen S, Chen J Z, Grigorieff N, Passmore L A, Ciccarelli L, Rubinstein J L, Crowther R A, Stewart P L, Rosenthal P B. Tilt-pair analysis of images from a range of different specimens in single-particle electron cryomicroscopy. J. Mol. Biol. 2011;413:1028–1046. doi: 10.1016/j.jmb.2011.09.008. [DOI] [PMC free article] [PubMed] [Google Scholar]
- 16.DeRosier D J. Correction of high-resolution data for curvature of the Ewald sphere. Ultramicroscopy. 2000;81:83–98. doi: 10.1016/s0304-3991(99)00120-5. [DOI] [PubMed] [Google Scholar]
- 17.Müller S A, Engel A. Biological scanning transmission electron microscopy: imaging and single molecule mass determination. Chimia. 2006;60:749–753. [Google Scholar]
- 18.Bremer A, Henn C, Engel A, Baumeister W, Aebi U. Has negative staining still a place in biomacromolecular electron microscopy? Ultramicroscopy. 1992;46:85–111. doi: 10.1016/0304-3991(92)90008-8. [DOI] [PubMed] [Google Scholar]
- 19.Cheng Y, Wolf E, Larvie M, Zak O, Aisen P, Grigorieff N, Harrison SC, Walz T. Single particle reconstructions of the transferrin-transferrin receptor complex obtained with different specimen preparation techniques. J. Mol. Biol. 2006;355:1048–1065. doi: 10.1016/j.jmb.2005.11.021. [DOI] [PubMed] [Google Scholar]
- 20.De Carlo S, Harris J R. Negative staining and cryo-negative staining of macromolecules and viruses for TEM. Micron. 2011;42:117–131. doi: 10.1016/j.micron.2010.06.003. [DOI] [PMC free article] [PubMed] [Google Scholar]
- 21.Jastrzebska B, Ringler P, Lodowski D T, Moiseenkova-Bell V, Golczak M, Müller S A, Palczewski K, Engel A. Rhodopsin-transducin heteropentamer: three-dimensional structure and biochemical characterization. J. Struct. Biol. 2011;176:387–394. doi: 10.1016/j.jsb.2011.08.016. [DOI] [PMC free article] [PubMed] [Google Scholar]
- 22.Karlsson M, Fotiadis D, Sjovall S, Johansson I, Hedfalk K, Engel A, Kjellbom P. Reconstitution of water channel function of an aquaporin overexpressed and purified from Pichia pastoris. FEBS Lett. 2003;537:68–72. doi: 10.1016/s0014-5793(03)00082-6. [DOI] [PubMed] [Google Scholar]
- 23.Zoonens M, Giusti F, Zito F, Popot J L. Dynamics of membrane protein/amphipol association studied by Forster resonance energy transfer: implications for in vitro studies of amphipol-stabilized membrane proteins. Biochemistry. 2007;46:10392–10404. doi: 10.1021/bi7007596. [DOI] [PubMed] [Google Scholar]
- 24.Saxton W O. Semper: distortion compensation, selective averaging, 3-D reconstruction, and transfer function correction in a highly programmable system. J. Struct. Biol. 1996;116:230–236. doi: 10.1006/jsbi.1996.0035. [DOI] [PubMed] [Google Scholar]
- 25.Fernandez J J, Li S, Crowther R A. CTF determination and correction in electron cryotomography. Ultramicroscopy. 2006;106:587–596. doi: 10.1016/j.ultramic.2006.02.004. [DOI] [PubMed] [Google Scholar]
- 26.Tang G, Peng L, Baldwin P R, Mann D S, Jiang W, Rees I, Ludtke S J. EMAN2: an extensible image processing suite for electron microscopy. J. Struct. Biol. 2007;157:38–46. doi: 10.1016/j.jsb.2006.05.009. [DOI] [PubMed] [Google Scholar]
- 27.Radermacher M, Wagenknecht T, Verschoor A, Frank J. Three-dimensional reconstruction from a single-exposure, random conical tilt series applied to the 50S ribosomal subunit of Escherichia coli. J. Microsc. 1987;146:113–136. doi: 10.1111/j.1365-2818.1987.tb01333.x. [DOI] [PubMed] [Google Scholar]
- 28.Pettersen E F, Goddard T D, Huang C C, Couch G S, Greenblatt D M, Meng E C, Ferrin T E. UCSF Chimera–a visualization system for exploratory research and analysis. J. Comput. Chem. 2004;25:1605–1612. doi: 10.1002/jcc.20084. [DOI] [PubMed] [Google Scholar]
- 29.Engel A, Wiggins J W, Woodruff D C. A comparison of calculated images by six modes of transmission electron microscopy. J. Appl. Phys. 1974;45:2739–2747. [Google Scholar]
- 30.Krivanek O. Atom-by-atom structural and chemical analysis by annular dark-field electron microscopy. Nature. 2010;464:571. doi: 10.1038/nature08879. [DOI] [PubMed] [Google Scholar]
- 31.Engel A. Molecular weight determination by scanning transmission electron microscopy. Ultramicroscopy. 1978;3:273–281. doi: 10.1016/s0304-3991(78)80037-0. [DOI] [PubMed] [Google Scholar]
- 32.Wall J S, Hainfeld J F. Mass mapping with the scanning transmission electron microscope. Annu. Rev. Biophys. Biophys. Chem. 1986;15:355–376. doi: 10.1146/annurev.bb.15.060186.002035. [DOI] [PubMed] [Google Scholar]
- 33.Krzyzanek V, Muller S A, Engel A, Reichelt R. MASDET-A fast and user-friendly multiplatform software for mass determination by dark-field electron microscopy. J. Struct. Biol. 2009;165:78–87. doi: 10.1016/j.jsb.2008.10.006. [DOI] [PubMed] [Google Scholar]
- 34.Müller S A, Goldie K N, Buerki R, Haering R, Engel A. Factors influencing the precision of quantitative scanning transmission electron microscopy. Ultramicroscopy. 1992;46:317–334. [Google Scholar]
- 35.Müller S A, Engel A. Mass measurement in the scanning transmission electron microscope: a powerful tool for studying membrane proteins. J. Struct. Biol. 1998;121:219–230. doi: 10.1006/jsbi.1997.3953. [DOI] [PubMed] [Google Scholar]
- 36.Walz T, Smith B L, Agre P, Engel A. The three-dimensional structure of human erythrocyte aquaporin CHIP. EMBO J. 1994;13:2985–2993. doi: 10.1002/j.1460-2075.1994.tb06597.x. [DOI] [PMC free article] [PubMed] [Google Scholar]
- 37.Smith B L, Agre P. Erythrocyte Mr 28,000 transmembrane protein exists as a multisubunit oligomer similar to channel proteins. J. Biol. Chem. 1991;266:6407–6415. [PubMed] [Google Scholar]
- 38.Dubochet J, Adrian M, Chang J-J, Homo J-C, Lepault J, McDowall AW, Schultz P. Cryo-electron microscopy of vitrified specimens. Quart. Rev. Biophys. 1988;21:129–228. doi: 10.1017/s0033583500004297. [DOI] [PubMed] [Google Scholar]
- 39.Adrian M, Dubochet J, Fuller S D, Harris J R. Cryo-negative staining. Micron. 1998;29:145–160. doi: 10.1016/s0968-4328(97)00068-1. [DOI] [PubMed] [Google Scholar]
- 40.De Carlo S, El-Bez C, Alvarez-Rua C, Borge J, Dubochet J. Cryo-negative staining reduces electron-beam sensitivity of vitrified biological particles. J. Struct. Biol. 2002;138:216–226. doi: 10.1016/s1047-8477(02)00035-7. [DOI] [PubMed] [Google Scholar]
- 41.De Carlo S, Boisset N, Hoenger A. High-resolution single-particle 3D analysis on GroEL prepared by cryo-negative staining. Micron. 2008;39:934–943. doi: 10.1016/j.micron.2007.11.003. [DOI] [PubMed] [Google Scholar]
- 42.Hoenger A, Aebi U. 3-D reconstructions from ice-embedded and negatively stained biomacromolecular assemblies: a critical comparison. J. Struct. Biol. 1996;117:99–116. [Google Scholar]
- 43.Popot J L, Berry E A, Charvolin D, Creuzenet C, Ebel C, Engelman D M, Flötenmeyer M, Giusti F, Gohon Y, Hong Q, Lakey J H, Leonard K, Shuman H A, Timmins P, Warschawski D E, Zito F, Zoonens M, Pucci B, Tribet C. Amphipols: polymeric surfactants for membrane biology research. Cell Mol. Life Sci. 2003;60:1559–1574. doi: 10.1007/s00018-003-3169-6. [DOI] [PMC free article] [PubMed] [Google Scholar]
- 44.Palczewski K. G protein-coupled receptor rhodopsin. Annu. Rev. Biochem. 2006;75:743–767. doi: 10.1146/annurev.biochem.75.103004.142743. [DOI] [PMC free article] [PubMed] [Google Scholar]
- 45.Palczewski K. Chemistry and biology of vision. J. Biol. Chem. 2012;287:1612–1619. doi: 10.1074/jbc.R111.301150. [DOI] [PMC free article] [PubMed] [Google Scholar]
- 46.Fotiadis D, Liang Y, Filipek S, Saperstein D A, Engel A, Palczewski K. Atomic-force microscopy: rhodopsin dimers in native disc membranes. Nature. 2003;421:127–128. doi: 10.1038/421127a. [DOI] [PubMed] [Google Scholar]
- 47.Gurevich V V, Gurevich E V. GPCR monomers and oligomers: it takes all kinds. Trends Neurosci. 2008;31:74–81. doi: 10.1016/j.tins.2007.11.007. [DOI] [PMC free article] [PubMed] [Google Scholar]
- 48.Gonzalez-Maeso J. GPCR oligomers in pharmacology and signaling. Mol. Brain. 2011;4:20. doi: 10.1186/1756-6606-4-20. [DOI] [PMC free article] [PubMed] [Google Scholar]
- 49.Whorton M R, Jastrzebska B, Park P S, Fotiadis D, Engel A, Palczewski K, Sunahara RK. Efficient coupling of transducin to monomeric rhodopsin in a phospholipid bilayer. J. Biol. Chem. 2008;283:4387–4394. doi: 10.1074/jbc.M703346200. [DOI] [PMC free article] [PubMed] [Google Scholar]
- 50.Ohi M, Li Y, Cheng Y, Walz T. Negative staining and image classification – powerful tools in modern electron microscopy. Biol. Proced. Online. 2004;6:23–34. doi: 10.1251/bpo70. [DOI] [PMC free article] [PubMed] [Google Scholar]
- 51.le Maire M, Champeil P, Moller J V. Interaction of membrane proteins and lipids with solubilizing detergents. Biochim. Biophys. Acta. 2000;1508:86–111. doi: 10.1016/s0304-4157(00)00010-1. [DOI] [PubMed] [Google Scholar]
- 52.Clarke S. The size and detergent binding of membrane proteins. J. Biol. Chem. 1975;250:5459–5469. [PubMed] [Google Scholar]
- 53.Lustig A, Engel A, Tsiotis G, Landau E M, Baschong W. Molecular weight determination of membrane proteins by sedimentation equilibrium at the sucrose or Nycodenz-adjusted density of the hydrated detergent micelle. Biochimica et Biophysica Acta. 2000;1464:199–206. doi: 10.1016/s0005-2736(99)00254-0. [DOI] [PubMed] [Google Scholar]
- 54.Kunji E R, Harding M, Butler P J, Akamine P. Determination of the molecular mass and dimensions of membrane proteins by size exclusion chromatography. Methods. 2008;46:62–72. doi: 10.1016/j.ymeth.2008.10.020. [DOI] [PubMed] [Google Scholar]
- 55.Kaufmann T C, Engel A, Remigy H W. A novel method for detergent concentration determination. Biophys. J. 2006;90:310–317. doi: 10.1529/biophysj.105.070193. [DOI] [PMC free article] [PubMed] [Google Scholar]
- 56.Müller S A, Engel A. Structure and mass analysis by scanning transmission electron microscopy. Micron. 2000;32:21–31. doi: 10.1016/s0968-4328(00)00022-6. [DOI] [PubMed] [Google Scholar]
- 57.Pebay-Peyroula E, Garavito R M, Rosenbusch J P, Zulauf M, Timmins P A. Detergent structure in tetragonal crystals of OmpF porin. Structure. 1995;3:1051–1059. doi: 10.1016/s0969-2126(01)00241-6. [DOI] [PubMed] [Google Scholar]
- 58.Fernandez C, Hilty C, Wider G, Guntert P, Wuthrich K. NMR structure of the integral membrane protein OmpX. J. Mol. Biol. 2004;336:1211–1221. doi: 10.1016/j.jmb.2003.09.014. [DOI] [PubMed] [Google Scholar]
- 59.Boekema E J, Hankamer B, Bald D, Kruip J, Nield J, Boonstra A F, Barber J, Rögner M. Supramolecular structure of the photosystem II complex from green plants and cyanobacteria. Proc. Natl. Acad. Sci. USA. 1995;92:175–179. doi: 10.1073/pnas.92.1.175. [DOI] [PMC free article] [PubMed] [Google Scholar]
- 60.Boekema E J, Hifney A, Yakushevska A E, Piotrowski M, Keegstra W, Berry S, Michel K P, Pistorius E K, Kruip J. A giant chlorophyll-protein complex induced by iron deficiency in cyanobacteria. Nature. 2001;412:745–748. doi: 10.1038/35089104. [DOI] [PubMed] [Google Scholar]
- 61.Althoff T, Mills D J, Popot J L, Kuhlbrandt W. Arrangement of electron transport chain components in bovine mitochondrial supercomplex I1III2IV1. EMBO J. 2011;30:4652–4664. doi: 10.1038/emboj.2011.324. [DOI] [PMC free article] [PubMed] [Google Scholar]
- 62.Cvetkov T L, Huynh K W, Cohen M R, Moiseenkova-Bell V Y. Molecular architecture and subunit organization of TRPA1 ion channel revealed by electron microscopy. J. Biol. Chem. 2011;286:38168–38176. doi: 10.1074/jbc.M111.288993. [DOI] [PMC free article] [PubMed] [Google Scholar]
- 63.Westfield G H, Rasmussen S G, Su M, Dutta S, DeVree B T, Chung K Y, Calinski D, Velez-Ruiz G, Oleskie A N, Pardon E, Chae P S, Liu T, Li S, Woods V L, Steyaert J, Kobilka B K, Sunahara R K, Skiniotis G. Structural flexibility of the G alpha s alpha-helical domain in the beta2-adrenoceptor Gs complex. Proc. Natl. Acad. Sci. USA. 2011;108:16086–16091. doi: 10.1073/pnas.1113645108. [DOI] [PMC free article] [PubMed] [Google Scholar]
- 64.Penczek P, Radermacher M, Frank J. Three-dimensional reconstruction of single particles embedded in ice. Ultramicroscopy. 1992;40:33–53. [PubMed] [Google Scholar]
- 65.Frank J, Penczek P, Liu W. Alignment, classification, and three-dimensional reconstruction of single particles embedded in ice. Scanning Microsc. Suppl. 1992;6:11–20. [PubMed] [Google Scholar]
- 66.van Heel M. Multivariate statistical classification of noisy images (randomly oriented biological macromolecules) Ultramicroscopy. 1984;13:165–183. doi: 10.1016/0304-3991(84)90066-4. [DOI] [PubMed] [Google Scholar]