

Abstract
Purpose
Gold nanoparticles (gold-NP) have lately been proposed as alternative contrast agents to iodine-based contrast agents (iodine-CA) for computed tomography angiography. The aims of this study were to confirm an appropriate environment in which to evaluate such novel contrast agents, to investigate the comparative contrast of iodine-CA versus gold-NP and to determine optimal scanning parameters for gold-NP.
Materials and methods
Three different clinical scanners were used to acquire CT images. A range of concentrations (10 mM to 1.5 M) of gold-NP and iodine-CA were scanned with varying X-ray tube voltages and currents, reconstruction kernels, protocols and scanner models. The different environments investigated were air, water and water with a bone simulant (Ca3(PO4)2). Regression coefficients were derived from the attenuation values plotted against concentration and compared for statistical significance using t-values.
Results
As expected, contrast was linearly related to concentration up to 500-1000 mM, depending on the conditions used, whereupon a plateau of 3000 HU was reached. Attenuation was significantly different depending on the environment used (air, water or water and bone simulant). Contrast is dependent on the X-ray tube voltage used, with the contrast produced from iodine-CA sharply declining with increasing voltage, while the contrast of gold-NP varied less with tube voltage, but was maximal at 120 kV in water with bone simulant. Current, reconstruction kernels, protocols and scanner model had less effect on contrast.
Conclusion
Water with a bone simulant is a preferable environment for evaluating novel cardiac CT contrast agents. Relative iodine-CA vs. gold-NP contrast is dependent on the scanning conditions used. Optimal scanning conditions for gold-NP will likely use an X-ray tube voltage of 120 kV.
Keywords: computed tomography, gold nanoparticles, contrast agents, iodine
Introduction
There have been several recent studies where nanoparticles whose payload is gold,1-7 bismuth8,9 or other elements10-14 have been proposed as contrast agents for computed tomography (CT).15 The advantages of such nanoparticle contrast agents over clinically available iodinated small molecules are longer circulation times,5,6,14 targeted imaging,1-4,16,17 multi-color CT imaging16,18 and, for gold nanoparticles, greater CT contrast. For example, on the topic of greater CT contrast, Kim et al. compared the attenuation of gold nanoparticles with that of Ultravist and found the gold nanoparticles to produce 1.9 times contrast on a mole-for-mole basis.19 However, the concentrations used for this comparison were in the 1 to 3 M range and produced attenuation values of 6690 HU. Clinically relevant attenuation values are in the range of 0-1000 HU, so the setting used to investigate the contrast generating potential of gold particles was not optimal and may have yielded misleading results. Recently, Jackson et al. investigated the effect of energy on the contrast produced by a single concentration of gold (508 mM) compared with the same concentration of iodine.20 This study revealed that the X-ray tube voltage had a significant effect on the attenuation of the two contrast agents, with the relative CNR of gold nanoparticles to iodine solution increasing from 1.0 to 2.1 when the voltage was increased from 80 to 140 kV. The contrast that gold-NP provide in computed tomography has been claimed to range from 1.0 to 3.3 times that of iodine-CA (Supplementary Table 1), a disagreement whose source is likely due to the varying X-ray spectra and imaging conditions used.5-7,20-22 With the field for nanoparticle CT contrast agents burgeoning, it will be worthwhile to establish common conditions for evaluation of novel contrast agents such that different reports may be directly compared, with the crucial question being what is the contrast produced in a conventional clinical scanner?
Some have stated that, due to the roughly 3-fold higher X-ray absorbance of gold compared to iodine at energies such as 100 keV (Figure 1A), the attenuation of gold when imaged with a CT scanner operated at around 100 kV should be about 3 times higher.7 However, X-rays are produced by electrons from a cathode striking the anode i.e. the Bremsstrahlung effect (shown in Figure 1B), that is, a smooth, continuous spectrum of X-rays is emitted. So when a CT scanner runs at e.g. 140 kV, the X-rays emitted by the scanner range in energy from 25 kV to about 140 kV as displayed in Figure 1B (X-ray tubes emit photons in the 0-25 kV range but these are cut out by aluminum filters built into the scanner). Therefore, the attenuation of the X-ray beam emitted from a CT scanner by a contrast agent depends on the X-ray attenuation properties of the agent from 25 keV up to 140 keV, not solely the attenuation at 140 keV. As is displayed in Figure 1A, while gold attenuates X-rays more strongly than iodine above its K-edge at 80.7 keV, iodine attenuates X-rays more strongly than gold below 80.7 keV to iodine’s K-edge at 33.7 keV. From these data, it is unclear that gold should be markedly superior to iodine as a CT contrast agent at clinically relevant X-ray tube voltages, i.e. 80-140 kV.
Figure 1.
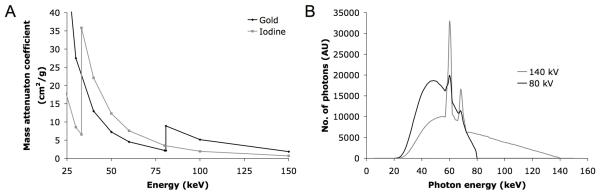
A. Gold and iodine energy-dependence of X-ray attenuation. B. Photon energy spectra emitted from a CT scanner run at 80 and 140 kV (adapted, with permission, from23).
In this study, we explored the effect of a variety of CT scanning parameters and physical settings on the comparative contrast of gold nanoparticle and iodine contrast agents. First, the iodine content levels of the commercial contrast agents used were checked via ICP-MS. Next, we varied the concentration of the different contrast agents. As the factor that affects image contrast is the attenuation of X-rays by the object in the scanner field of view, we investigated whether voltage and current of the tube could be influential. The samples were scanned in air, in a volume of water to simulate the physiologic milieu of a human patient and imaged when placed in water under a block of calcium phosphate-rich material in order to mimic the presence of bone. The reconstruction kernel and scanning protocol used (e.g. abdomen vs. brain, etc) was varied. Lastly, we also investigated the influence of scanner model; as different scanners have varying X-ray tube design, filter thickness, detector type, electronics and so forth, significant differences in results may occur.
With this study we aim to shed light on the following things: 1) the relative performance of gold nanoparticles compared with iodine contrast agents, 2) the factors that are important for generating greatest contrast when using gold nanoparticles, 3) the recommended imaging conditions for evaluating novel CT contrast agents.
Materials and methods
Supplementary Information
Details of the materials used are available in the supplementary information online.
Gold nanoparticle synthesis
The gold nanoparticles used in this study were synthesized using a methodology similar to that previously reported.1 In short, hydrophobically coated gold nanocrystals were synthesized by the method of Brust.24 1 g of these nanocrystals was dissolved in a 9:1 chloroform:methanol solvent mixture (50 ml) with an equal weight of myristoyl hydroxy phosphatidylcholine (MHPC). This solution was added drop-wise to 50 ml of hot (80 °C), stirred deionized water. Large aggregates were removed from the resulting suspension via centrifugation at 4000 rpm for 10 minutes using an Eppendorf (Hauppauge, New York) 5810 R centrifuge. Excess lipids were removed via centrifugation on a KBr solution (d=1.25 g/ml) for one hour at 14,500 rpm using an Eppendorf (Hauppauge, New York) MiniSpin Plus centrifuge (200 μl of the crude gold-NP mixture layered on 1 ml of KBr solution/vial). 950 μl of the lower layer was retained. The buffer was exchanged to phosphate buffered saline and the solution was concentrated to around 2 ml before use. This formulation was used as a model system with which to study the CT contrast generated by gold nanoparticles.
Material characterization
The concentrations of the gold nanoparticle solution and three samples taken from different bottles of iopamidol were determined by inductively coupled plasma mass spectrometry (ICP-MS), which was performed by Maxxam Analytics Laboratories (Burnaby, British Columbia). The size of the gold cores was determined by transmission electron microscopy (TEM) using a Hitachi H7650 instrument (Hitachi High Technologies, Pleasanton, CA). Samples were prepared by diluting the 308 mg Au/ml stock solution by 1/2500 and dripping 20 μl onto a TEM grid and allowing them to air dry. The average diameter of the gold cores was calculated using ImageJ software (http://rsb.info.nih.gov/ij/download.html) with 413 cores included in the calculation. The hydrodynamic diameter and zeta potential of the nanoparticles was determined using a ZetaPALS instrument with BI-MAS particle sizing option from Brookhaven Instruments Corporation, Holtsville, NY.
Phantom construction
The first phantom was formed in the following way: iopamidol was diluted to eight concentrations ranging from 13 to 1295 mM. Similarly, gold-NP solution was diluted to eight different concentrations ranging from 16 to 1564 mM. 250 μL of the diluted samples were then pipetted into 2-mL vials. These vials were sealed with silicon-based vacuum grease and wrapped in parafilm in order to prevent water entry. The diluent used was phosphate buffered saline. This first phantom was scanned under all conditions outlined below. A second phantom was made in a similar fashion, except that the samples were independently diluted in triplicate and the concentration of the iopamidol ranged from 31 to 313 mM, while the gold-NP concentration ranged from 12 to 119 mM. The latter phantom was used to confirm the effect of voltage, current, concentration, environment and reconstruction protocol. Three vials of degassed, deionized water were scanned to ascertain the effect of voltage, current, environment and reconstruction protocol on water alone.
The vials containing gold-NP and iodine-CA samples were placed in plastic, four-way racks. Each rack could accommodate four rows of eight tubes. The racks were scanned so that the samples were perpendicular to the plane of the CT scanner. When scanned in water, only one rack was imaged at a time due to the limited length of the plastic water containers in which the racks were placed.
A dense paste of calcium phosphate was created by combining beta tri-calcium phosphate (Ca3(PO4)2) powder with water to form a rectangular-shaped, 1-cm thick matrix having the same width and length as the test tube rack, in order to simulate bone. This matrix was wrapped in parafilm to prevent water entry and was then placed on top of the rack in water in order to simulate the presence of bone. The matrix was secured to the rack using clear plastic tape.
Physical settings
The phantoms were scanned in air as well as imaged when submersed in a volume of water taken from the tap (21 cm in height and 24 cm in width). They were also scanned in water with and without the presence of a calcium phosphate matrix (described above). Each rack containing either 8 or 24 vials, positioned in the manner described above, was placed on another, empty rack to lift the vials so that they would be approximately centered in the water environment, simulating being in the center of the thorax or abdomen of patients of various sizes.
CT scanners
The gold-NP and iodine-CA vials were imaged using 3 different scanners. The first was a 256-slice Brilliance iCT scanner (Philips Medical Systems Nederland B.V., The Netherlands). The second scanner used was a 64-slice Discovery CT750 HD scanner (GE, Waukesha, Wisconsin). The third scanner used was a 64-slice Somatom Sensation CT scanner (Siemens, Munich, Germany).
Imaging protocols
For each scan using the Brilliance iCT scanner, several imaging parameters were held constant and were: collimation 120 × 0.625 mm, field of view (FOV) 250 mm, matrix 512 × 512. Images were reconstructed using the Standard protocol (unless otherwise indicated), slice thickness of 0.9 mm and increment of 0.45 mm. First, the racks were scanned using an abdomen/pelvis protocol, increasing the voltage incrementally from 80 kV to 120 kV to 140 kV and maintaining a current of 100 mA – in air, then subsequently when submersed in water, and then in water combined with the calcium phosphate matrix described above. Second, the racks were scanned in water and covered with the bone simulant with a tube voltage of 80 kV, 120 kV or 140 kV, with the following currents: 10 mA, 50 mA, 100 mA, 150 mA, 200 mA, 250 mA and 300 mA, using a helical abdomen protocol. Third, the racks were scanned at 140 kV and 100 mA in air using six different anatomical protocols, but with other parameters held the same. These were: brain protocol, thorax protocol, ear protocol, neck protocol, thoraco-lumbar spine protocol, and orthoped (shoulder-hip) protocol. Fourth, images scanned with the abdomen protocol at several voltages, 100 mA and in water with calcium phosphate were reconstructed using four different reconstruction kernels: standard, smooth, sharp, and detailed.
Last, the gold-NP and iodine-CA samples were scanned using a GE Discovery CT750 HD scanner and a Siemens Somatom Sensation CT scanner with parameters the same as those for the Brilliance iCT, as much as was possible. The test tubes were placed in racks as described above, submersed in water and covered by the calcium phosphate matrix. For the Discovery CT750 scanner, scanning parameters were: collimation 120 × 0.625 mm, FOV 400 mm, matrix 512 × 512. Images were reconstructed using a Soft kernel and a slice thickness of 0.625 mm. For the Somatom Sensation CT scanner, imaging parameters were: collimation 64 × 0.6 mm, FOV 250 mm, matrix 512 × 512. Images were reconstructed using a B40f medium kernel and a slice thickness of 0.75mm. For both scanners, the abdomen protocol was used; current was held constant at 100 mA, and the images were obtained at 80 kV, 120 kV and 140 kV.
Image and statistical analysis
Images were analyzed using the image processing software Efilm (Navtick, New York, NY) (see Figure 2) by placing a region of interest in each test tube and obtaining an attenuation value in Hounsfield Units (HU) for four different slices in each vial. These attenuation values were recorded, and means and standard deviations were derived for both gold-NP and iodine-CA samples at each concentration. These means were plotted on a graph of concentration (x-axis) and attenuation (y-axis), and the slope of the line of best fit formed by the first five points was calculated. Standard errors of fit were derived from the deviations of the data points from the calculated line of best fit. The LINEST function of Excel (Microsoft) was used to determine the slope (mx) and standard error of fit (ex). T-values were calculated via the following equation:
and compared to the 5% reference t-value, which is 2.45, using six degrees of freedom. Comparisons were made between the gold-NP slopes and the iodine-CA slopes as well as between different parameters for each contrast medium.
Figure 2.
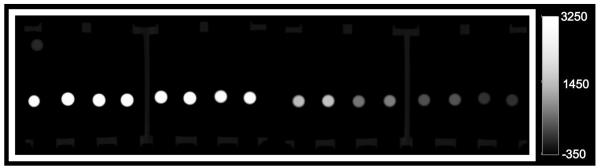
CT image of phantom 1 with 16 test tubes containing, from left to right, gold-NP at its highest concentration, iodine-CA at its highest concentration, gold-NP at its next highest concentration, iodine-CA at its next highest concentration, and so forth. Images acquired in air at 100 mA and 140 kV.
Results
Contrast media characterization
While the iodine-CA was labeled as containing ‘370 mg/ml of organically bound iodine,’ ICP-MS results showed an actual iodine concentration of 321-332 mg/ml (depending on the vial analyzed). Others seemingly did not take this step and the concentration of iodine could be a factor in study-to-study discrepancies. The samples of iodine-CA used in this study had been in storage, out of their original bottle, for two weeks before dilution and ICP-MS analysis, which could contribute to the difference in concentration compared to that stated by the manufacturer. The gold nanoparticles used in this study were a model system of hydrophobically (dodecanethiol) coated gold cores, suspended in water with an additional MHPC coating layer.The concentration of the gold-NP stock solution was found to be 308 mg Au/ml. The average gold core diameter of the gold nanoparticles was found from TEM images (Supplementary Figure 1) to be 3.6 ± 1.1 nm. The hydrodynamic diameter found from dynamic light scattering measurements was 8.4 ± 1.1 nm, with a polydispersity of 0.186. The disparity in these two measurements is due to the dodecanethiol and lipid coating of the gold core. The zeta potential was found to be −2.5 ± 1.4 mV, i.e. virtually no net surface charge, which is not surprising given the zwitterionic nature of the MHPC coating lipid.
Effect of scanning parameters on contrast of water
The effect of voltage, setting, current and reconstruction kernel on the contrast generated by water was probed. As can be seen in Supplementary Figure 2, varying these parameters had an effect on the contrast of water, with the apparent attenuation ranging from −13 to 95 HU. Attenuation decreased with increasing X-ray tube voltage and was markedly higher when scanned with calcium phosphate, than when scanned in water or air. These variations in attenuation may be due to the deviations in geometry and composition of the phantom from a patient. There was no difference between most of the scans acquired at different currents, apart from at 10 mA, which yielded 25 HU higher attenuation. This is likely due to due to the x-ray intensity reaching the detector at this current being too low (photon starvation). While smooth, standard and sharp reconstruction kernels gave the same attenuation, the detailed kernel gave attenuation as much as 44 HU higher. The detailed kernel sacrifices Hounsfield unit value accuracy for image detail, leading to this result.
As a consequence of these noted variations in the attenuation of water, when analyzing the attenuation arising from contrast agents, we focused on the attenuation/mM of agent. This avoided the use of absolute values, and thus eliminated artifacts in the results related to variations in the baseline contrast arising from water.
Concentration of contrast agent is an important determinant of attenuation
As expected, gold-NP and iodine-CA attenuation values are linear with concentration up to 500-1000 mM, depending on the scanner parameters and physical setting used. However, after 500-1000 mM a plateau is reached with a value of approximately 3000 HU (see Figure 3A).This observed plateau is an artifact of the scanner rather than an intrinsic property of the contrast agents. The values are clipped as the Hounsfield unit scale of the scanner is from −1000 to 3095 HU.
Figure 3.

A. Graph of attenuation vs. concentration of gold-NP and iodine-CA scanned in air at 100 mA and 140 kV. standard deviations – where not seen, errors bars are hidden by the data point. Attenuation of B. iodine-CA and C. gold-NP scanned in water with the calcium phosphate matrix at various tube voltages. CT images of D. 157 mM of iodine-CA and E. of 119 mM of gold-NP (windowing 800 to 3000 HU). Data from phantom 2. Error bars omitted for clarity.
X-ray tube voltage is a major determinant of contrast
Gold-NP and iodine-CA scanned in water with a bone simulant placed on top of the racks have divergent attenuation trends when the voltage is altered. In this physical setting, at 100 mA, the attenuation of iodine-CA declines sharply with increasing voltage, whereas the attenuation of gold-NP varies comparatively little with escalating X-ray tube voltage (see Figure 3B-E). Iodine-CA attenuation was maximal at 80 kV in water with bone simulant, declined at 120 kV and reached its lowest value at 140 kV. These differences were statistically significant at the 5% level, but also the attenuation per mM at 140 kV is 51% less than that at 80 kV, a large decrease. Gold-NP attenuation was maximal at 120 kV, as compared with 140 kV or 80 kV. When these slopes were compared the differences were found to be statistically significant at the 5% level, although there is at most only a 20% difference in the absolute values. The decline in contrast provided by iodine-CA as the voltage used increases is not surprising, given its poor attenuation of high energy X-rays. On the other hand, the attenuation of gold increases at 120 kV X-ray tube voltage due to the strong absorbance of high energy X-rays by the K-edge of gold at 80.7 keV.
The physical setting affects contrast
The phantoms were scanned in three different physical settings: in air, in water, and in water with a calcium phosphate matrix. For iodine-CA, the rate of attenuation declined sequentially, regardless of physical setting used, as the X-ray tube voltage increased from 80 kV to 120 kV to 140 kV (see Figure 4A). At each X-ray tube voltage the rate of attenuation was highest in air, and then gradually, but significantly, decreased in the following order: water, then water with calcium phosphate. Almost all the rates of attenuation for each voltage were found to be statistically significantly different.
Figure 4.
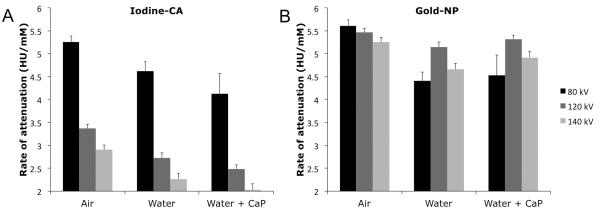
Graphs of rate of attenuation against physical setting at three X-ray tube voltages for A. iodine-CA and B. gold-NP. CaP=calcium phosphate. Data acquired from phantom 2.
When gold-NP were scanned in these three different physical settings, a less consistent pattern of attenuation is observed across all three X-ray tube voltages (see Figure 4B). At 80 kV, roughly the same pattern as iodine-CA is seen, whereby gold-NP’s rate of attenuation is highest in air, and is then significantly lower in water and water with calcium phosphate. At 120 kV and 140 kV, however, the gold-NP rate of attenuation is not significantly reduced going from air to other environments, asides from between air and water at 140 kV. Gold-NP’s departure from the attenuation pattern of iodine-CA at 120 kV and 140 kV is likely due to the impact of gold-NP’s K-edge of 80.7 keV.
The substantial decrease in the attenuation of iodine-CA when scanned in water compared to scanning in air is likely due to beam hardening, i.e. the average energy of the X-ray beam is increased due to attenuation of low energy X-rays by the water. This means that the energy distribution of the X-ray beam shifts away from the K-edge of iodine and towards that of gold, therefore substantially reducing the attenuation of iodine, while having less effect on the attenuation by gold. The contrast ratio between gold and iodine at 120 kV is 1.9 and 2.1 in water and water with calcium phosphate respectively.
The effect of current on contrast is minimal
The attenuation rate of gold-NP and iodine-CA scanned in water with a bone simulant using a voltage of 120 kV is flat, broadly speaking, when current is increased incrementally from low to high current (see Figure 5A). Therefore current has almost no effect on the contrast produced by these agents.
Figure 5.

A. Effect of X-ray tube current on attenuation for both iodine-CA and gold-NP scanned in a medium water volume with calcium phosphate at 120 kV. Data acquired from phantom 2. Error bars are the standard deviations of the data. B. Effect of CT scan protocol on attenuation for iodine-CA and gold-NP, both scanned in air at 140 kV and 100 mA. Data acquired from phantom 1. Error bars are the standard errors between the data and the line of best fit. C, D. Effect of reconstruction kernel on attenuation for iodine-CA and gold-NP, scanned in water with calcium phosphate at 100 mA. Data acquired from phantom 2. Error bars omitted for clarity. The data was normalized to the first point on the graph in each case.
Effect of imaging protocol is minimal
The use of different CT imaging protocols to scan iodine-CA and gold-NP in air at 140 kV and 100 mA did not result in substantial changes in attenuation values (see Figure 5B). The only statistically significant differences among the various imaging protocols for both contrast agents was for iodine-CA, between the brain and neck imaging protocols, although this is not a substantial difference.
Effect of reconstruction kernel can be influential
Iodine-CA and gold-NP scanned in water with calcium phosphate at 100 mA do not demonstrate large fluctuations in attenuation when different reconstruction kernels are used, except in the case of the Detailed kernel (see Figure 5C, D). When reconstructed with a Detailed kernel for both iodine-CA and gold-NP the attenuation was about 15% higher than when reconstructed with the Standard, Smooth or Sharp protocols. In almost all cases we found statistically significant differences between the Detailed protocol and the other protocols. This is likely due to the aforementioned poor HU accuracy in the Detailed protocol. We did not observe streak artifacts in the images and therefore such artifacts did not affect the results.
Effect of scanner model is minimal
When phantom 1 was scanned under the same physical parameters in three different CT scanners, both iodine-CA and gold-NP displayed similar attenuation patterns (see Figure 6). For example, iodine-CA shows decreased attenuation values as voltage increases from 80 kV to 120 kV to 140 kV, regardless of the scanner model. Likewise, gold-NP attenuation values at 120 kV are consistently higher than those at 80 kV and 140 kV, regardless of scanner model. For both iodine-CA and gold-NP, the attenuation was largely the same for each scanner at 120 and 140 kV. However, at 80 kV there is a decrease in attenuation rates going from the Brilliance iCT to the Discovery CT750 to the Somatom CT. Likely this is a result of differing filters used in the scanners – the filters used in CT scanners have most effect on low energy photons therefore the attenuation rates at low energy are most likely to be affected.
Figure 6.
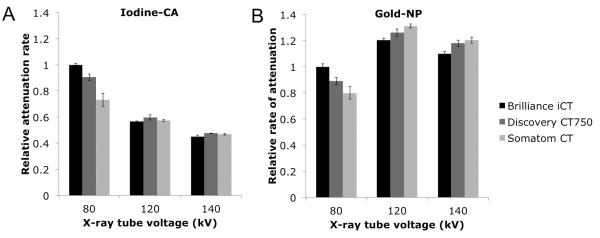
Graph of attenuation vs. X-ray tube voltage imaged using three different CT scanners in water with the calcium phosphate matrix at 100 mA for A. iodine-CA and B. gold-NP. Data acquired from phantom 1. Error bars are the standard errors between the data and the line of best fit. The data was normalized to the value for the Brilliance iCT at 80 kV in each case.
Discussion
Advances in knowledge
Through our study, we have shown that certain imaging factors and physical settings can alter the contrast observed for gold-NP and iodine-CA. As expected, we found that gold-NP and iodine-CA have a concentration-dependent, linear increase in attenuation up until approximately 1000 mM where attenuation levels off, which suggests that multiple concentrations of agents should be tested in order to draw conclusions regarding their relative contrast. In addition, it points towards the benefit of evaluating contrast agents at concentrations that might realistically be achieved in blood or tissue, i.e. less than 200 mM. In our study, we have shown that the gold provides 1.9 times greater contrast than iodine when scanned at 120 kV in water using the Brilliance iCT scanner, which is in line with the results of Jackson et al.20 Prior studies have reported that gold-NP in computed tomography provides contrast that is 1.1 to 3.3 greater than that of iodine-CA, but these were based on the use of contrast agent at a single concentration, which could have lead to errors in the findings.5-7,20-22 Under no condition did we find the attenuation of gold to be 3 times that of iodine. We have also demonstrated that scanning in air versus in water yields large differences in attenuation values, most likely a result of beam hardening, i.e. the increase in the average energy of the X-rays hitting the contrast agent after passing through water favors attenuation by gold, but disfavors attenuation by iodine.
Additionally, we have found that gold-NP and iodine-CA have optimal contrast when scanned at distinct X-ray tube voltages; gold-NP’s maximal attenuation values occurred at 120 kV due to the K-edge of 80.7 keV, while iodine-CA’s K-edge is 33.2 keV so its maximal attenuation values at 80 kV are logical. We have also shown that current does not appear to have an influence on contrast observed, but this is not surprising given that regardless of the photon flux, a material will attenuate the same proportion of the incident photons. Finally, scanning protocol and reconstruction kernel likewise do not appear to have an impact on contrast optimization for the most part, although, the ‘detailed’ protocol yielded higher attenuation values for both gold-NP and iodine-CA.
The attenuation of gold-NP at 120 kV and in water was 5.14 HU/mM. 30 HU has been proposed as the lowest increase in attenuation that is perceptible as contrast in CT.25 This implies, that for targeted imaging, a minimum of 5.8 mM of gold needs to be accumulated in the tissue of interest for contrast to be appreciated. Such concentrations are likely achievable in the blood pool by long circulating agents6 and in diseased tissues via targeted agents.4,16
Limitations
While the phantoms used in this study were created to replicate physiologic conditions, our model could still be improved in future experiments. Using a calcium phosphate matrix formed into a series of rods arranged in an oval, rather than using a block, might better mimic the bones of the ribcage, for example and hence the attenuation conditions in the chest. Additionally, the gold-NP used in this study were composed of gold cores coated with phospholipids. Others have synthesized gold nanoparticles with different coatings that also attenuate X-rays, e.g. including gadolinium, and may therefore possess somewhat different attenuation properties.21,26
Recommendations
The use of gold-NP for computed tomography imaging has been described in the literature (see Supplementary Table 1) with widely differing imaging protocols used to evaluate the contrast produced. Some have used clinical scanners;6,20 others have used microCT scanners.22,27 The voltages used have ranged from 50-210 kV.5,28,29 Air or water has been used to surround the samples. In some cases there are very few details of the scanning procedure in the paper. To evaluate novel CT contrast agents for use in a clinical setting, the results of our study suggest that:
Multiple concentrations should be tested to accurately determine the contrast produced.
Experiments should be conducted in patient scanners, rather than micro-CT scanners or other animal scanners, in order to replicate clinical conditions.
Novel contrast agents should be evaluated in water phantoms – rather than in air – to simulate physiological conditions.
We aim to use gold nanoparticles in cardiac applications, so we added a calcium phosphate matrix, however, this would be unnecessary for some other applications, such as abdominal imaging. Our results also demonstrate that 120 kV might be an optimal X-ray tube voltage for scanning gold-NP on a standard clinical CT scanner. Choosing a specific current does not seem to be as important as long as very low current values, such as 10 mA, are not used. Scanning gold-NP at various concentrations, in a clinical scanner, in water, at 120 kV will not only yield the greatest contrast, but also enable a true comparison of attenuation results in computed tomography imaging. It is worth noting that gold is a relatively expensive material and others have suggested nanoparticle CT contrast agents based on bismuth8,9 or other cheaper elements.10-14 Nevertheless, the above recommendations should prove useful in evaluating the contrast generated by novel agents, regardless of their composition.
Summary
In summary, our findings highlight the factors that are influential in achieving optimal contrast for gold-NP and iodine-CA and indicate guidelines for future in vitro scanning. Specifically, we have found that evaluation of novel cardiac CT contrast agents is optimal when these are scanned in water with a bone simulant, using a range of concentrations, at a tube voltage of 120 kV. The choice of clinical CT scanner model, tube current, protocol, and reconstruction kernel do not appear to be as important. While gold-NP gave greater contrast than iodine-CA under these conditions (by a factor of 2.1), markedly greater improvements over iodine-CA performance do not seem possible with conventional multi-slice clinical CT scanners. The more important strengths of gold-NP likely are the potential for long lasting CT contrast,5,6 targeted imaging2,4 and multi-color CT imaging.16
Supplementary Material
Acknowledgements
Partial support provided by NIH grants R01 HL71021, R01 HL78667 and R01 EB009638 (ZAF) and K99 EB012165 (DPC). We also thank the AHA Founder’s Affiliate for Postdoctoral Fellowship 09POST2220194 (DPC). We thank Thorsten Johnson of the University of Munich for supplying the raw data for Fig 1B.
References
- (1).Cormode DP, Skajaa T, van Schooneveld MM, Koole R, Jarzyna P, Lobatto ME, Calcagno C, Barazza A, Gordon RE, Zanzonico P, Fisher EA, Fayad ZA, Mulder WJM. Nano Lett. 2008;8:3715. doi: 10.1021/nl801958b. [DOI] [PMC free article] [PubMed] [Google Scholar]
- (2).Popovtzer R, Agrawal A, Kotov NA, Popovtzer A, Balter J, Carey TE, Kopelman R. Nano Lett. 2008;8:4593. doi: 10.1021/nl8029114. [DOI] [PMC free article] [PubMed] [Google Scholar]
- (3).Chanda N, Kattumuri V, Shukla R, Zambre A, Katti K, Upendran A, Kulkarni RR, Kan P, Fent GM, Casteel SW, Smith CJ, Boote E, Robertson JD, Cutler C, Lever JR, Katti KV, Kannan R. Proc. Natl. Acad. Sci. USA. 107:8760. doi: 10.1073/pnas.1002143107. [DOI] [PMC free article] [PubMed] [Google Scholar]
- (4).Eck W, Nicholson AI, Zentgraf H, Semmler W, Bartling S. Nano Lett. 2010;10:2318. doi: 10.1021/nl101019s. [DOI] [PubMed] [Google Scholar]
- (5).Cai QY, Kim SH, Choi KS, Kim SY, Byun SJ, Kim KW, Park SH, Juhng SK, Yoon KH. Invest. Radiol. 2007;42:797. doi: 10.1097/RLI.0b013e31811ecdcd. [DOI] [PubMed] [Google Scholar]
- (6).Kim D, Park S, Lee JH, Jeong YY, Jon S. J. Am. Chem. Soc. 2007;129:7661. doi: 10.1021/ja071471p. [DOI] [PubMed] [Google Scholar]
- (7).Hainfeld JF, Slatkin DN, Focella TM, Smilowitz HM. Brit. J. Radiol. 2006;79:248. doi: 10.1259/bjr/13169882. [DOI] [PubMed] [Google Scholar]
- (8).Rabin O, Perez JM, Grimm J, Wojtkiewicz G, Weissleder R. Nat. Mater. 2006;5:118. doi: 10.1038/nmat1571. [DOI] [PubMed] [Google Scholar]
- (9).Pan D, Williams TA, Senpan A, Allen JS, Scott MJ, Gaffney PJ, Wickline SA, Lanza GM. J Am Chem Soc. 2009;131:15522. doi: 10.1021/ja906797z. [DOI] [PMC free article] [PubMed] [Google Scholar]
- (10).Torchilin VP, Frank-Kamenetsky MD, Wolf GL. Acad. Radiol. 1999;6:61. doi: 10.1016/s1076-6332(99)80063-4. [DOI] [PubMed] [Google Scholar]
- (11).deKrafft KE, Xie Z, Cao G, Tran S, Ma L, Zhou OZ, Lin W. Angew Chem Int Ed Engl. 2009;48:9901. doi: 10.1002/anie.200904958. [DOI] [PubMed] [Google Scholar]
- (12).Regino CA, Walbridge S, Bernardo M, Wong KJ, Johnson D, Lonser R, Oldfield EH, Choyke PL, Brechbiel MW. Contrast Media Mol Imaging. 2008;3:2. doi: 10.1002/cmmi.223. [DOI] [PMC free article] [PubMed] [Google Scholar]
- (13).Winter PM, Shukla HP, Caruthers SD, Scott MJ, Fuhrhop RW, Robertson JD, Gaffney PJ, Wickline SA, Lanza GM. Acad. Radiol. 2005;12:S9. doi: 10.1016/j.acra.2005.02.016. [DOI] [PubMed] [Google Scholar]
- (14).Mukundan S, Ghaghada KB, Badea CT, Kao C-Y, Hedlund LW, Provanzale JM, Johnson GA, Chen E, Bellamkonda RV, Annapragada A. Am. J. Roentgenol. 2006;186:300. doi: 10.2214/AJR.05.0523. [DOI] [PubMed] [Google Scholar]
- (15).Cormode DP, Fayad ZA. Imaging in Medicine. 2011;3:263. [Google Scholar]
- (16).Cormode DP, Roessl E, Thran A, Skajaa T, Gordon RE, Schlomka JP, Fuster V, Fisher EA, Mulder WJM, Proksa R, A. FZ. Radiology. 2010;256:774. doi: 10.1148/radiol.10092473. [DOI] [PMC free article] [PubMed] [Google Scholar]
- (17).Hill ML, Corbin IR, Levitin RB, Cao WG, Mainprize JG, Yaffe MJ, Zheng G. Acad. Radiol. 17:1359. doi: 10.1016/j.acra.2010.06.006. [DOI] [PubMed] [Google Scholar]
- (18).Pan D, Roessl E, Schlomka J-P, Caruthers SD, Senpan A, Scott MJ, Allen JS, Zhang H, Hu G, Gaffney PJ, Choi ET, Rasche V, Wickline SA, Proksa R, Lanza GM. Angew. Chem. Int. Ed. 2010;49:9635. doi: 10.1002/anie.201005657. [DOI] [PMC free article] [PubMed] [Google Scholar]
- (19).Kim D, Park S, Lee JH, Jeong YY, Jon S. J. Am. Chem. Soc. 2007;129:12585. doi: 10.1021/ja071471p. [DOI] [PubMed] [Google Scholar]
- (20).Jackson PA, Rahman WNWA, Wong CJ, Ackerly T, Geso M. Eur. J. Radiol. 2010;75:104. doi: 10.1016/j.ejrad.2009.03.057. [DOI] [PubMed] [Google Scholar]
- (21).Park JA, Kim HK, Kim JH, Jeong SW, Jung JC, Lee GH, Lee J, Chang Y, Kim TJ. Bioorg Med Chem Lett. 2010;20:2287. doi: 10.1016/j.bmcl.2010.02.002. [DOI] [PubMed] [Google Scholar]
- (22).Sun IC, Eun DK, Na JH, Lee S, Kim I-J, Youn I-C, Ko C-Y, Kim H-S, Lim D, Choi K, Messersmith PB, Park TG, Kim SY, Kwon IC, Kim K, Ahn C-H. Chem. Eur. J. 2009;15:13341. doi: 10.1002/chem.200902344. [DOI] [PubMed] [Google Scholar]
- (23).Schenzle JC, Sommer WH, Neumaier K, Michalski G, Lechel U, Nikolaou K, Becker CR, Reiser MF, Johnson TRC. Invest. Radiol. 2010;45:347. doi: 10.1097/RLI.0b013e3181df901d. [DOI] [PubMed] [Google Scholar]
- (24).Brust M, Walker M, Bethell D, Schiffrin DJ, Whyman R. Chem. Commun. 1994:801. [Google Scholar]
- (25).Krause W. Adv. Drug Deliv. Rev. 1999;37:159. doi: 10.1016/s0169-409x(98)00105-7. [DOI] [PubMed] [Google Scholar]
- (26).Alric C, Taleb J, Le Duc G, Mandon C, Billotey C, Le Meur-Herland A, Brochard T, Vocanson F, Janier M, Perriat P, Roux S, Tillement O. J Am Chem Soc. 2008;130:5908. doi: 10.1021/ja078176p. [DOI] [PubMed] [Google Scholar]
- (27).Guo J. Phys. Chem. C. 2010;114:50. doi: 10.1021/jp108660c. [DOI] [PubMed] [Google Scholar]
- (28).Kojima C, Umeda Y, Ogawa M, Harada A, Magata Y, Kono K. Nanotechnology. 2010;21:245104. doi: 10.1088/0957-4484/21/24/245104. [DOI] [PubMed] [Google Scholar]
- (29).Guo R, Wang H, Peng C, Shen MW, Pan MJ, Cao XY, Zhang GX, Shi XY. J. Phys. Chem. C. 2010;114:50. [Google Scholar]
Associated Data
This section collects any data citations, data availability statements, or supplementary materials included in this article.