Abstract
Patient-specific simulations of heart (dys)function aimed at personalizing cardiac therapy are hampered by the absence of in vivo imaging technology for clinically acquiring myocardial fiber orientations. The objective of this project was to develop a methodology to estimate cardiac fiber orientations from in vivo images of patient heart geometries. An accurate representation of ventricular geometry and fiber orientations was reconstructed, respectively, from high-resolution ex vivo structural magnetic resonance (MR) and diffusion tensor (DT) MR images of a normal human heart, referred to as the atlas. Ventricular geometry of a patient heart was extracted, via semiautomatic segmentation, from an in vivo computed tomography (CT) image. Using image transformation algorithms, the atlas ventricular geometry was deformed to match that of the patient. Finally, the deformation field was applied to the atlas fiber orientations to obtain an estimate of patient fiber orientations. The accuracy of the fiber estimates was assessed using six normal and three failing canine hearts. The mean absolute difference between inclination angles of acquired and estimated fiber orientations was 15.4 °. Computational simulations of ventricular activation maps and pseudo-ECGs in sinus rhythm and ventricular tachycardia indicated that there are no significant differences between estimated and acquired fiber orientations at a clinically observable level.The new insights obtained from the project will pave the way for the development of patient-specific models of the heart that can aid physicians in personalized diagnosis and decisions regarding electrophysiological interventions.
Keywords: Bioengineering, Issue 71, Biomedical Engineering, Medicine, Anatomy, Physiology, Cardiology, Myocytes, Cardiac, Image Processing, Computer-Assisted, Magnetic Resonance Imaging, MRI, Diffusion Magnetic Resonance Imaging, Cardiac Electrophysiology, computerized simulation (general), mathematical modeling (systems analysis), Cardiomyocyte, biomedical image processing, patient-specific modeling, Electrophysiology, simulation
Introduction
The computational approach is becoming central to the advancement of the understanding of the function of the heart in health and disease. State-of-the-art whole-heart models of electrophysiology and electromechanics are currently being used to study a wide range of phenomena, such as normal ventricular propagation, arrhythmia, defibrillation, electromechanical coupling, and cardiac resynchronization1. However, for the computational approach to be directly applicable in the clinical environment, it is imperative that the models be patient-specific, i.e. the models must be based on the specific architecture and electrophysiological or electromechanical properties of the patient's diseased heart. Simulation with such models will aid physicians to arrive at highly personalized decisions for electrophysiological interventions as well as prophylaxis, thereby dramatically improving cardiac health care2-4 .
Creation of realistic cardiac models requires the acquisition of the geometry and fiber structure of a patient heart. Fiber orientations determine directions of electrical propagation and strain distributions in the heart, and therefore acquiring them is essential to cardiac modeling5, 6.With recent advances in medical imaging, it is now feasible to obtain the geometry of a patient heart, includingstructural remodeling such as infarction, in vivo with high resolution using magnetic resonance imaging (MRI) and computed tomography (CT) technologies. However, there is no practical method for acquiring fiber structure of a patient heart in vivo. Diffusion tensor (DT) MRI7, 8, the only technique to acquire fiber orientations of the intact heart, is not widely available in vivo due to certain limitations 9. A brief description of the previous efforts to translate DTMRI to the clinical setting can be found elsewhere 2. Though methodologies such as rule-based assignment of fiber orientations offer alternatives to DTMRI, these methodologies have certain serious limitations 2, 10. Thus difficulties in acquiring cardiac fiber structure in vivo presently impede the application of electrophysiological and electromechanical cardiac simulations in clinical setting. The objective of this research was to directly address this need.
We hypothesized that ventricular fiber orientations of a heart can be accurately predicted given the geometry of the heart and an atlas, where the atlas is a heart whose geometry and fiber orientations are available. Accordingly, we used state of the art techniques to develop a methodology for estimation of cardiac fiber orientations in vivo, and tested the hypothesis in normal and failing canine ventricles2. The central idea of our fiber estimation methodology is to exploit similarities in fiber orientations, relative to geometry, between different hearts in order to approximate the fiber structure of a (target) heart for which only the geometry information is available. At the heart of our estimation methodology is the registration of the atlas geometry with the target geometry using large deformation diffeomorphic metric mapping (LDDMM) 11, and the morphing of atlas fiber orientations using preservation of principal components (PPD) 2, 12.The diffeomorphicproperty of LDDMM guarantees that the atlas does not "foldover" itself during deformation, thereby preserving the integrityof anatomical structures. Figure 1 illustrates the processing pipeline of our methodology. The protocol text section §1 describes the various components of the pipeline by demonstrating how the estimation can be performed for an example patient. The numbers inside some of the blocks in Figure 1 refer to the corresponding subsections under section §1 of the protocol text.
We evaluated the performance of the proposed methodology by quantifying the estimation error, and measuring the effect of this error onsimulations of cardiac electrophysiology, by computationally simulating local electrical activation maps as well as pseudo-electrocardiograms (pseudo-ECGs). Due to the unavailability of human hearts, the performance evaluation was conducted using canine hearts available from previous studies 13-15 . The estimation error was calculated by means of inclination angles 16, followingthe tradition of histology, where angular measurements are performedon tissue sections that are cut parallel to the epicardialsurface. Since the anglebetween the fiber direction and epicardial tangent plane is generallysmall 17, 18, the information loss in describing a fiberdirection entirely using its inclination angle is insignificant. For the computational simulations, image-based models were built as reported previously 19, 20, and cardiac tissue in the models was represented based on established mathematical techniques and experimental data 21-25 . Sinus rhythm was simulated by replicating activation originating from the Purkinje network26, and ventricular tachycardia, by an S1-S2 pacing protocol 27. Pseudo-ECGs were computed 28 and compared using the mean absolute deviation (MAD) metric 29.
Protocol
1. Fiber Orientations Estimation
Acquire structural MRI and DTMRI images of a normal adult human heart in diastole, at a resolution of 1 mm3. Using ImageJ, extract the ventricular myocardium from the atlas structural image by fitting, for each short-axis slice, closed splines through a set of landmark points placed along the epicardial and endocardial boundaries in the slice (Figure 2A & Figure 2B). Perform the placement of landmark points manually for every 10th slice in the image. Obtain the landmark points for the remaining slices by linearly interpolating the manually identified points, using MATLAB.Reconstruct the fiber orientations of the atlas heart by computing the primary eigenvectors of the DTs in the DTMRI image (Figure 2C).
Acquire an image of the geometry of the patient heart in diastole using in vivo cardiac CT or MRI. Reconstruct the patient heart geometry from the image similarly to the way the atlas was built (Figure 3A & Figure 3B). The patient image should be re-sampled prior to reconstruction such that the in-plane resolution is 1 mm2. Similarly, the number of slices for which landmarks are manually picked, and the interval of out-of-plane interpolation must be adjusted so that the segmented patient heart image has a slice thickness of 1 mm.
Deform the atlas ventricular image to match the patient geometry image in two steps. In the first step, perform an affine transformation based on a set of thirteen landmarks points: the left ventricular (LV) apex, the two right ventricular (RV) insertion points at the base, the two RV insertion points midway between base and apex, and four sets of two points that evenly divide RV and LV epicardial contours at base, and midway between base and apex (Figure 4A & Figure 4B). In the second step, deform the affine-transformed atlas ventricles further to match the patient geometry, using large deformation diffeomorphic metric mapping (LDDMM) (Figure 4C).
Morph the DTMRI image of the atlas by re-positioning of image voxels and re-orientating the DTs according to the transformation matrix of the affine matching and the deformation field of the LDDMM transformation. Perform the re-orientation of the DTs using the preservation of principal directions (PPD) method.
Obtain the estimate of the patient fiber orientations from the morphed atlas DTMRI image by computing the primary eigenvector of the DTs (Figure 5).
2. Measurement of Estimation Error
Acquire ex vivo structural MR and DTMR images of six normal and three failing canine hearts, at a resolution of 312.5×312.5×800 μm3. Here, heart failure should be generated in the canines via radiofrequency ablation of the left bundle-branch followed by 3 weeks of tachypacing at 210 min-1.
Segment the ventricles from the canine hearts similarly to the human atlas heart, as described in §1.1. Denote ventricles segmented from normal canine hearts as hearts 1 through 6, and those segmented from failing canine hearts as hearts 7 through 9 (Figure 6).
Obtain five different estimates of ventricular fiber orientations of heart 1 by using each of hearts 2 to 6 as an atlas (Figure 7).
Estimate fiber orientations for each of the failing ventricles using heart 1 as the atlas (Figure 8).
Foreach data point in each set of estimated fiber orientations, compute the estimation error as|θc-θa| , where θc and θa are the inclination angles of estimated and acquired fiber orientations at that point, respectively.
For each data point in each set of estimated fiber orientations, compute the acute angle betweenestimated and acquired fiber directions in three-dimensions (3D) by means of thevector dot product.
3. Measurement of the Effects of Estimation Error on Simulations
From heart 1, construct six models, one with the DTMRI-acquired fiber orientations of heart 1 (referred to as model 1), and five with the five estimated fiber orientations datasets (models 2 to 6).For each of the three failing heart geometries, construct two ventricular models, one with the DTMRI-acquired fiber orientations and the other with the estimated fiber orientations. Here the spatial resolution of the models, computed in terms of the average edge length of the meshes, should be about 600 μm. Denote the heart failure models with DTMRI-acquired fibers as models 7 to 9, and those with estimated fibers as models 10 to 12.In the models, use monodomain representation to describe the cardiac tissue, with governing equations:
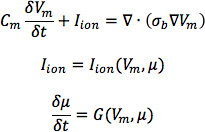 where σbis the bulk conductivity tensor which is calculated from the bidomain conductivity tensors as described by Potse et al30; Vm is the transmembrane potential; Cm is the membrane specific capacitance; and Iion is the density of the transmembrane current, which in turn depends on Vm and a set of state variables μ describing the dynamics of ionic fluxes across the membrane.For Cm , use a value of 1 μ F/cm2. For σi in normal canine heart models, use longitudinal and transverse conductivity values of 0.34 S/m and 0.06 S/m, respectively. Represent llon by the Greenstein-Winslow ionic models of the canine ventricular myocyte. Decrease the electrical conductivities in canine heart failure ventricular models by 30% (Figure 9).
Using the software package CARP (CardioSolv, LLC), simulate sinus rhythm with all models. Induce reentrant ventricular tachycardia (VT) in the six failing models using an S1-S2 pacing protocol. Choose the timing between S1 and S2 to obtain sustained VT activity for 2 sec after S2 delivery. If VT is not induced for any S1-S2 timing, decrease the conductivities by up to 70% until VT was induced (Figure 10).
For each simulation, calculate pseudo-ECGs by taking the difference of extracellular potentials between two points in an isotropic bath surrounding the hearts. Place the two points near the base of the heart separated by 18 cm, such that the line connecting them is perpendicular to the base-apex plane of the septum as illustrated in Figure 10. For each simulation with estimated fiber orientations, compute the MAD metric as
![]() where X is the ECG waveform of the simulation with estimated fiber orientations, Y is the ECG waveform of thecorresponding simulation with acquired fiber orientations, X is the mean value of X,Y is the mean value of Y, and n is the length of X and Y.
where X is the ECG waveform of the simulation with estimated fiber orientations, Y is the ECG waveform of thecorresponding simulation with acquired fiber orientations, X is the mean value of X,Y is the mean value of Y, and n is the length of X and Y.
Representative Results
Figure 11, A-C displays streamlined visualizations of estimated as well as DTMRI-derived fiber orientations in normal and failing hearts. Qualitative examination shows that estimated fiber orientations align well with DTMRI-derived ones. Panel D illustrates, overlaid on the geometry of heart 1, the distribution of error in normal hearts' inclination angles, averaged across all five estimates. Panel E shows the mean distribution of error in failing hearts' inclination angles, overlaid on the geometry of heart 1. Note that inclination angles have values between -90 ° and +90 °, and therefore, the estimation error ranges between 0 ° and 180 °. Panels F and G present sections of tissue from the distributions in panels D and E, respectively. This highlights the transmural variation of error. The histograms of errors in panel H suggest that most myocardial voxels have small error values. About 80% and 75% of the voxels have errors less than 20 ° in normal and failing ventricles, respectively. It was found that the mean error, averaged across all estimated datasets, and all image voxels that belonged to the myocardium, were 14.4 ° and 16.9 ° in normal and failing ventricles, respectively. The mean error in the entire myocardium, in normal and failing cases combined, was 15.4 °. The mean 3D acute angle between estimated and acquired fiber directions were 17.5 ° and 18.8 ° in normal and failing ventricles, respectively. The 3-D angles are comparable to the estimation errors.These results show that inclination angles of predicted fiber orientations are comparable to those acquired by ex-vivo DTMRI, the state-of-the-art technique.The standard deviation of error across the fivedifferent estimates of the fiber orientations of heart 1 was only 1.9 indicating that the variation in estimation quality from oneatlas to another is small.
Figures 12 and 13 present the simulated activation maps of one beat of sinus rhythm activation in normal and failing ventricular models, respectively. Models with estimated fiber orientations produce activation maps very similar to those of models with acquired orientations; the earliest epicardial activations occur at the same sites, and the directions of propagation match as well. The overall mean difference in total activation times between the acquired and estimated fiber orientation cases in the normal ventricular models, averaged over all estimates and all mesh nodes, was 5.7 ms, which is a small fraction (3.7% on average) of the total activation time. Figure 12C demonstrates that pseudo-ECGs obtained for sinus rhythm simulations with models 1 and 3 have identical morphologies. The MAD score between these two waveforms was 4.14%. On average, the MAD score between sinus rhythm pseudo-ECGs with each of models 2 to 6 and model 1 was 10.9%.In simulations of sinus rhythm with failing ventricular models, the mean difference in total activation times between models with acquired and estimated fiber orientations was only 5.2 ms (3.1%), while the mean MAD score was 4.68%. These results indicate that the outcomes of simulation of ventricular activation in sinus rhythm in normal and failing canine ventricular models with fiber orientations estimated with the present methodology closely match those with acquired orientations. In particular, presence of heart failure did not diminish the accuracy of the estimation.
Figure 14 shows simulated activation maps, in apical views of the ventricles, during one cycle of induced VT in the heart failure models, and corresponding pseudo-ECGs. Simulations with acquired and estimated fiber orientation both exhibit similar figure-of-eight reentrant patterns. The ECG morphologies corresponding to estimated and acquired fiber orientations were in good agreement. The mean MAD score was 9.3%. These results indicate that canine heart failure models with estimated fiber orientations can closely replicate outcomes of VT simulations performed using acquired fiber orientations.
 Figure 1. Our processing pipeline for estimating ventricular fiber orientations in vivo. Click here to view larger figure.
 Figure 2. Geometry and fiber orientations of the atlas ventricles. (A) The epicardial (red) and endocardial (green and magenta) splines, and corresponding landmarks (yellow) overlaid on an example slice of the atlas image. (B) The atlas ventricles in 3D. (C) The atlas fiber orientations.
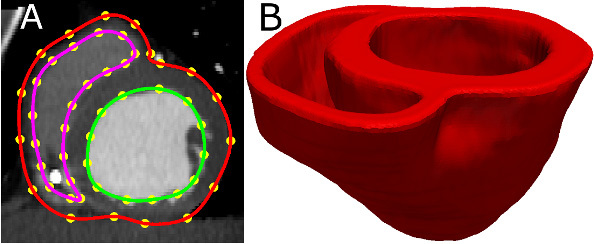 Figure 3. Patient ventricular geometry reconstruction. (A) The epicardial (red) and endocardial (green and magenta) splines, and corresponding landmarks (yellow) overlaid on an image slice. (B) Patient ventricles in 3D.
 Figure 4. Deformation of the atlas ventricles to match the patient ventricles. (A) Superimposition of ventricles of atlas (magenta, see Figure 2B) and patient (red, see Figure 3B). (B) Patient ventricles and the affine transformed atlas ventricles. (C) Patient ventricles and LDDMM-transformed atlas ventricles.
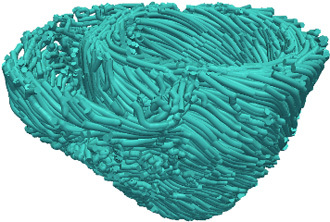 Figure 5. Estimated fiber orientations of the patient heart in Figure 3B.
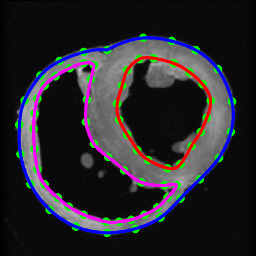 Figure 6. Segmentation of canine hearts. The epicardial (blue) and endocardial (red and magenta) splines, and corresponding landmarks (green) overlaid on an example slice of a normal canine heart.
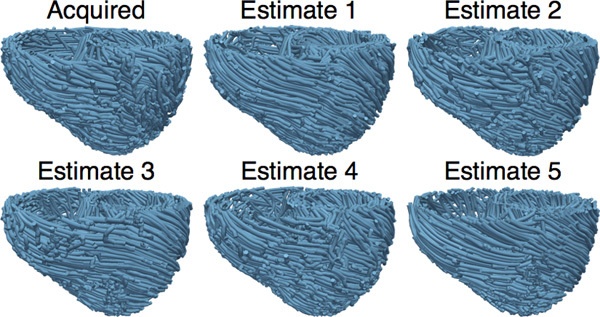 Figure 7. The acquired and estimated fiber orientations of heart 1.
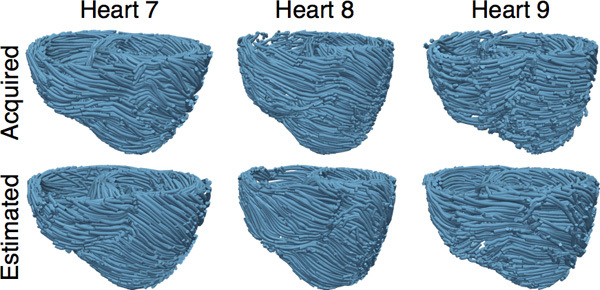 Figure 8. The acquired and estimated fiber orientations of hearts 7-9.
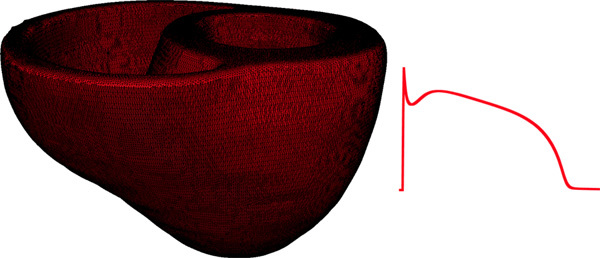 Figure 9. Left panel illustrates the computational mesh generated for the models of heart 1. On the right, the action potential curve of normal canine ventricular myocardium computed using the Greenstein-Winslow model is displayed.
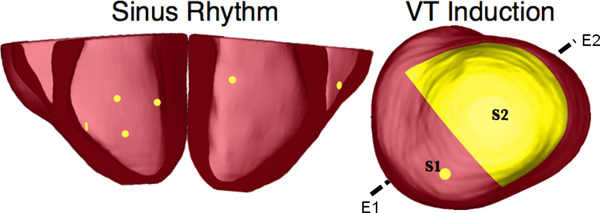 Figure 10. Pacing sites of the simulation of sinus rhythm and VT, as overlaid on the geometry of heart 7. E1E2 illustrates the lead vector used in pseudo-ECG calculations.
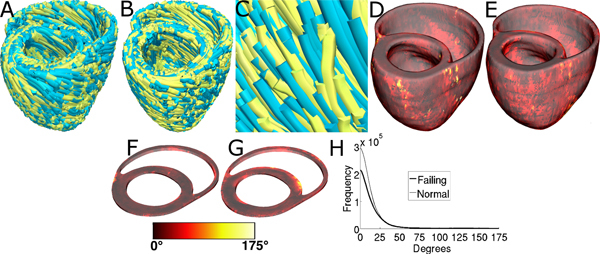 Figure 11. Validation of the fiber orientation estimation methodology by comparing estimated fiber orientations with DTMRI-derived orientations. (A) Superimposition of DTMRI-acquired fiber orientations (greenish yellow) and one set of estimated fiber orientations (cyan) of heart 1. (B) Acquired and estimated fiber orientations of heart 7. (C) An enlarged portion of (B) showing alignment between acquired and estimated fiber orientations. Note that the streamlines were generated at random locations within the myocardium for visualization purposes only, and so their exact positions are irrelevant. (D) Distribution of mean estimation error in normal ventricles. (E) Distribution of mean estimation error in failing ventricles. (F) A section of tissue extracted from (D). (G) A section of tissue extracted from (E). The colorbar applies to D-G. (H) Histograms of errors in normal and failing ventricles. Frequency denotes the number of voxels having a given error.
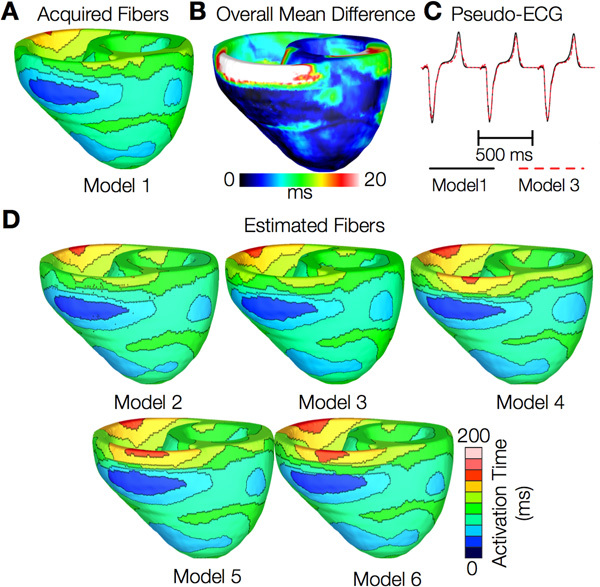 Figure 12. Results from simulations of one beat of sinus rhythm in normal canine ventricular models. (A) Activation map simulated using the model with acquired fiber orientations (model 1). (B) Absolute difference between simulated activation maps obtained from a ventricular model with acquired fiber orientations and that with estimated fiber orientations, averaged over the five estimates. (C) Simulated pseudo-ECGs with models 1 and 3. (D) Simulated activation maps from ventricles with estimated fiber orientations (models 2-6).
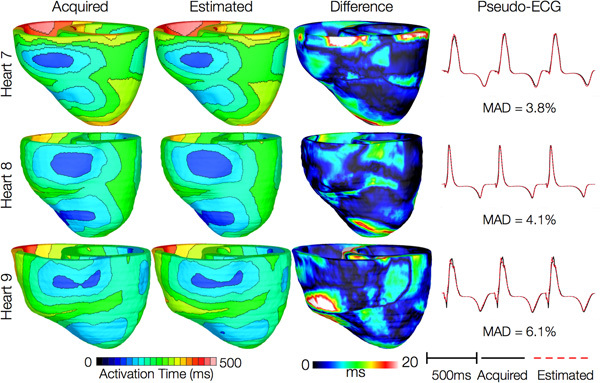 Figure 13. Results from simulations of one beat of sinus rhythm in failing heart models. In th e first column, rows 1-3 show activation maps calculated using models 7-9, respectively. In the second column, rows 1-3 display results of simulations with models 10-12, respectively. Rows 1-3 in the third column portray the absolute difference between the activation maps shown in the first and second columns of the corresponding row. Rows in the fourth column display simulated pseudo-ECGs from models in the first and second columns of the corresponding row.
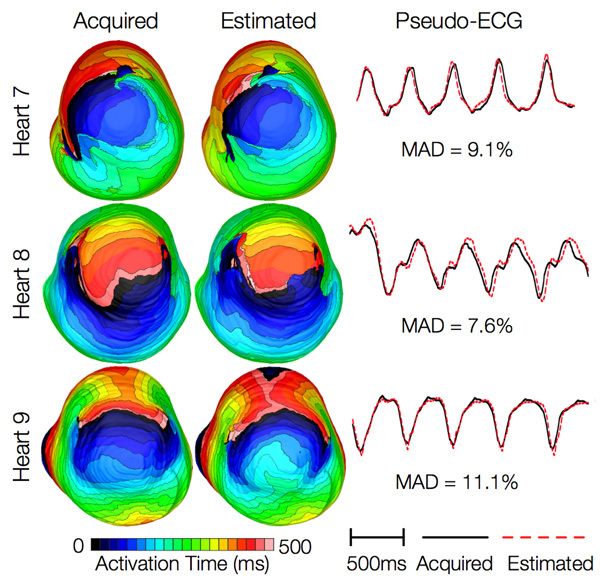 Figure 14. Results from simulations of VT induction with the failing heart models. Rows 1-3 in the first column show activation maps during one cycle of reentrant activity in simulations with models 7-9, respectively. Rows 1-3 in the second column show activation maps corresponding to models 10-12, respectively. Rows in the third column illustrate pseudo-ECGs from models in the first and second columns of the corresponding row.
Discussion
This research demonstrates quantitatively that, in the absence of DTMRI, myocardial fiber orientations of normal and failing ventricles can be estimated from in-vivo images of their geometries for use in simulations of cardiac electrophysiology. The proposed methodology is demonstrated with in vivo CT data, but it is equally applicable to in vivo MR images of ventricular geometry, addressing the lack of ability to directly acquire patient fiber orientations. It is thus an important step towards the development of personalized models of ventricular electrophysiology for clinical applications. The methodology can also be used to estimate the fiber orientations in ex-vivo hearts with high resolution. This is especially helpful when acquiring sub-millimeter resolution DTMRI images is difficult or prohibitively expensive, due to the very long acquisition times.
Our electrophysiological simulations suggested that activation maps were not very sensitive to changes in fiber orientations. More importantly, we demonstrated that effects of fiber estimation errors on gross electrophysiology were insignificant at a clinically observable level by means of the MAD score of the pseudo-ECGs. The MAD metric was suitablebecause it has been utilized in clinical studies, to compareECGs of reentrant activity and paced propagation for localizationof the organizing centers of reentrant circuits 29. A MADscore of less than 12%, a threshold that our results satisfy, implies that the two underlying propagationpatterns are clinically equivalent.Note that the similarity of propagation patterns will translate to low differences in mechanical activation patterns as well, as reported experiments show that local electrical and mechanical activation times during sinus rhythm are highly correlated. In summary, our research will facilitate ventricular simulation studies of any species in health and disease when it is not feasible to acquire fiber orientations using DTMRI. In particular, the proposed methodology paves the way for patient-specific modeling of ventricular whole-heart electrophysiology (and possibly) electromechanics based only on in vivo clinical imaging data. Simulations with such models may ultimately aid physicians to arrive at highly personalized decisions for therapeutic interventions as well as prophylaxis. Incidentally, our results indicated that the performance of the proposed methodology was independent of the choice of the atlas.Accordingly, for the purposes of this study, a statistical atlas 17, 31 may not be required.
The current study has some limitations. Firstly, human heart image data were not available to us, and therefore theproposed estimation methodology was validated with imagesof canine hearts. We expect that the methodology will accuratelyestimate fiber orientations in human hearts as well because,just as in canine hearts, fiber orientations relative to geometry have been shown to be similar between different human hearts 17. Also, we tested our methodology in normal andfailing hearts only. It would be important to test it under conditions such as myocardial infarction and hypertrophy, where fiber disorganizations are known to occur32, 33.
Disclosures
No conflicts of interest declared.
Acknowledgments
We thank Drs. Raimond Winslow, Elliot McVeigh, and Patrick Helm at Johns Hopkins University for providing the ex vivo datasets online.This research was supported by National Institutes of Health grant R01-HL082729, and National Science Foundation grant CBET-0933029.
References
- Trayanova N. Whole Heart Modeling: Applications to Cardiac Electrophysiology and Electromechanics. Circulation Research. 108:113–128. doi: 10.1161/CIRCRESAHA.110.223610. [DOI] [PMC free article] [PubMed] [Google Scholar]
- Vadakkumpadan F, Arevalo H, Ceritoglu C, Miller M, Trayanova N. Image-Based Estimation of Ventricular Fiber Orientations for Personalized Modeling of Cardiac Electrophysiology. IEEE Transactions on Medical Imaging. 31(5):1051–1060. doi: 10.1109/TMI.2012.2184799. [DOI] [PMC free article] [PubMed] [Google Scholar]
- Vadakkumpadan F, Gurev V, Constantino J, Arevalo H, Trayanova N. Modeling of Whole-Heart Electrophysiology and Mechanics: Towards Patient-Specific Simulations. In: Kerckhoffs R, editor. Patient-Specific Modeling of the Cardiovascular System: Technology-Driven Personalized Medicine. Springer; 2010. pp. 145–165. [Google Scholar]
- Buxton AE, Lee KL, DiCarlo L, Gold MR, Greer GS, Prystowsky EN, O'Toole MF, Tang A, Fisher JD, Coromilas J, Talajic M, Hafley G. Electrophysiologic testing to identify patients with coronary artery disease who are at risk for sudden death. Multicenter Unsustained Tachycardia Trial Investigators. The New England Journal of Medicine. 2000;342(26):1937–1945. doi: 10.1056/NEJM200006293422602. [DOI] [PubMed] [Google Scholar]
- Wei D, Okazaki O, Harumi K, Harasawa E, Hosaka H. Comparative simulation of excitation and body surface electrocardiogram with isotropic and anisotropic computer heart models. IEEE Transactions on Biomedical Engineering. 1995;42(4):343–357. doi: 10.1109/10.376128. [DOI] [PubMed] [Google Scholar]
- Leon LJ, Horacek BM. Computer model of excitation and recovery in the anisotropic myocardium. II. Excitation in the simplified left ventricle. Journal of Electrocardiology. 1991;24(1):17–31. doi: 10.1016/0022-0736(91)90078-z. [DOI] [PubMed] [Google Scholar]
- Rohmer D, Sitek A, Gullberg GT. Reconstruction and Visualization of Fiber and Laminar Structure in the Normal Human Heart from Ex Vivo Diffusion Tensor Magnetic Resonance Imaging (DTMRI) Data. Investigative Radiology. 2007;42(11):777–789. doi: 10.1097/RLI.0b013e3181238330. [DOI] [PubMed] [Google Scholar]
- Daubert JP, Zareba W, Hall WJ, Schuger C, Corsello A, Leon AR, Andrews ML, McNitt S, Huang DT, Moss AJ, Investigators MIS. Predictive value of ventricular arrhythmia inducibility for subsequent ventricular tachycardia or ventricular fibrillation in Multicenter Automatic Defibrillator Implantation Trial (MADIT) II patients. Journal of Americal College of Cardiology. 2006;47(1):98–107. doi: 10.1016/j.jacc.2005.08.049. [DOI] [PubMed] [Google Scholar]
- Sosnovik DE, Wang R, Dai G, Reese TG, Wedeen VJ. Diffusion MR tractography of the heart. Journal of Cardiovascular Magnetic Resonance. 2009;11(1):47–61. doi: 10.1186/1532-429X-11-47. [DOI] [PMC free article] [PubMed] [Google Scholar]
- Sundar H, Shen D, Biros G, Litt H, Davatzikos C. Estimating myocardial fiber orientations by template warping. Proc. IEEE International Symposium on Biomedical Imaging. 2006. pp. 73–76.
- Beg MF, Helm PA, McVeigh E, Miller MI, Winslow RL. Computational Cardiac Anatomy Using MRI. Magnetic Resonance in Medicine. 2004;52(5):1167–1174. doi: 10.1002/mrm.20255. [DOI] [PMC free article] [PubMed] [Google Scholar]
- Alexander DC, Pierpaoli C, Basser PJ, Gee JC. Spatial Transformations of Diffusion Tensor Magnetic Resonance Images. IEEE Transactions on Medical Imaging. 2001;20:1131–1139. doi: 10.1109/42.963816. [DOI] [PubMed] [Google Scholar]
- Helm PA, Younes L, Beg MF, Ennis DB, Leclercq C, Faris OP, McVeigh E, Kass D, Miller MI, Winslow RL. Evidence of Structural Remodeling in the Dyssynchronous Failing Heart. Circulation Research. 2006;98:125–132. doi: 10.1161/01.RES.0000199396.30688.eb. [DOI] [PubMed] [Google Scholar]
- Helm P, Beg MF, Miller M, Winslow R. Measuring and mapping cardiac fiber and laminar architecture using diffusion tensor MR imaging. Annals of the New York Academy of Sciences. 2005;1047:296–307. doi: 10.1196/annals.1341.026. [DOI] [PubMed] [Google Scholar]
- Helm PA, Tseng H-J, Younes L, McVeigh ER, Winslow RL. Ex vivo 3D diffusion tensor imaging and quantification of cardiac laminar structure. Magnetic Resonance in Imaging. 2005;54:850–859. doi: 10.1002/mrm.20622. [DOI] [PMC free article] [PubMed] [Google Scholar]
- Scollan DF, Holmes A, Winslow R, Forder J. Histological validation of myocardial microstructure obtained from diffusion tensor magnetic resonance imaging. American Journal of Physiology - Heart and Circulatory Physiology. 1998;275(6):H2308–H2318. doi: 10.1152/ajpheart.1998.275.6.H2308. [DOI] [PubMed] [Google Scholar]
- Lombaert H, Peyrat J, Croisille P, Rapacchi S, Fanton L, Cheriet F, Clarysse P, Magnin I, Delingette H, Ayache N. Human Atlas of the Cardiac Fiber Architecture: Study on a Healthy Population. IEEE Transactions on Medical Imaging. 2012;31(7):1436–1447. doi: 10.1109/TMI.2012.2192743. [DOI] [PubMed] [Google Scholar]
- Streeter DD. Gross morphology and fiber geometry of the heart. Baltimore: Johns Hopkins Press; 1979. [Google Scholar]
- Vadakkumpadan F, Rantner LJ, Tice B, Boyle P, Prassl AJ, Vigmond E, Plank G, Trayanova N. Image-Based Models of Cardiac Structure with Applications in Arrhythmia and Defibrillation Studies. Journal of Electrocardiology. 2009;42:151.e1–151.e10. doi: 10.1016/j.jelectrocard.2008.12.003. [DOI] [PMC free article] [PubMed] [Google Scholar]
- Plank G, Zhou L, Greenstein JL, Plank G, Zhou L, Greenstein JL, Cortassa S, Winslow RL, O'Rourke B, Trayanova NA. From mitochondrial ion channels to arrhythmias in the heart: computational techniques to bridge the spatio-temporal scales. Philosophical Transactions Series A, Mathematical, Physical, and Engineering Sciences. 2008;366(1879):3381–3409. doi: 10.1098/rsta.2008.0112. [DOI] [PMC free article] [PubMed] [Google Scholar]
- Roberts DE, Scher AM. Effect of tissue anisotropy on extracellular potential fields in canine myocardium in situ. Circulation Research. 1982;50:342–351. doi: 10.1161/01.res.50.3.342. [DOI] [PubMed] [Google Scholar]
- Greenstein J, Wu R, Po S, Tomaselli GF, Winslow RL. Role of the Calcium-Independent Transient Outward Current I(to1) in Shaping Action Potential Morphology and Duration. Circulation Research. 2000;87:1026–1033. doi: 10.1161/01.res.87.11.1026. [DOI] [PubMed] [Google Scholar]
- Winslow R, Rice J, Jafri S, Marbán E, O'Rourke B. Mechanisms of altered excitation-contraction coupling in canine tachycardia-induced heart failure, II: model studies. Circulation Research. 1999;84(5):571–586. doi: 10.1161/01.res.84.5.571. [DOI] [PubMed] [Google Scholar]
- Akar F, Nass R, Hahn S, Cingolani E, Shah M, Hesketh G, DiSilvestre D, Tunin R, Kass D, Tomaselli G. Dynamic Changes in Conduction Velocity and Gap Junction Properties During Development of Pacing-Induced Heart Failure. American Journal of Physiology - Heart and Circulatory Physiology. 2007;293(2):H1223–H1230. doi: 10.1152/ajpheart.00079.2007. [DOI] [PubMed] [Google Scholar]
- Gurev V, Constantino J, Rice JJ, Trayanova N. Distribution of Electromechanical Delay in the Ventricles:Insights from a 3D Electromechanical Model of the Heart. Biophysical Journal. 99(3):745–754. doi: 10.1016/j.bpj.2010.05.028. [DOI] [PMC free article] [PubMed] [Google Scholar]
- Ten Tusscher KHWJ, Hren R, Panfilov AV. Organization of Ventricular Fibrillation in the Human Heart. Circulation Research. 2007;100(12):e87–e101. doi: 10.1161/CIRCRESAHA.107.150730. [DOI] [PubMed] [Google Scholar]
- Gima K, Rudy Y. Ionic Current Basis of Electrocardiographic Waveforms. Circulation Research. 2002;90:889–896. doi: 10.1161/01.res.0000016960.61087.86. [DOI] [PMC free article] [PubMed] [Google Scholar]
- Gerstenfeld E, Dixit S, Callans D, Rajawat Y, Rho R, Marchlinski F. Quantitative comparison of spontaneous and paced 12-lead electrocardiogram during right ventricular outflow tract ventricular tachycardia. Journal of Americal College of Cardiology. 2003;41(11):2046–2053. doi: 10.1016/s0735-1097(03)00427-3. [DOI] [PubMed] [Google Scholar]
- Potse M, Dube B, Richer J, Vinet A, Gulrajani RM. A comparison of monodomain and bidomain reaction-diffusion models for action potential propagation in the human heart. IEEE Transactions on Biomedical Engineering. 2006;53(12):2425–2435. doi: 10.1109/TBME.2006.880875. [DOI] [PubMed] [Google Scholar]
- Peyrat J-M, Sermesant M, Pennec X, Delingette H, Chenyang X, McVeigh ER, Ayache N. A Computational Framework for the Statistical Analysis of Cardiac Diffusion Tensors: Application to a Small Database of Canine Hearts. IEEE Transactions on Medical Imaging. 2007;26:1500–1514. doi: 10.1109/TMI.2007.907286. [DOI] [PubMed] [Google Scholar]
- Chen J, Song S-K, Liu W, McLean M, Allen SJ, Tan J, Wickline SA, Yu X. Remodeling of cardiac fiber structure after infarction in rats quantified with diffusion tensor MRI. American Journal of Physiology - Heart and Circulatory Physiology. 2003;285(3):H946–H954. doi: 10.1152/ajpheart.00889.2002. [DOI] [PubMed] [Google Scholar]
- Stecker EC, Chugh SS. Prediction of sudden cardiac death: next steps in pursuit of effective methodology. Journal of Interventional Cardiac Electrophysiolog. 2011;31(2):101–107. doi: 10.1007/s10840-010-9535-z. [DOI] [PMC free article] [PubMed] [Google Scholar]


